Introduction
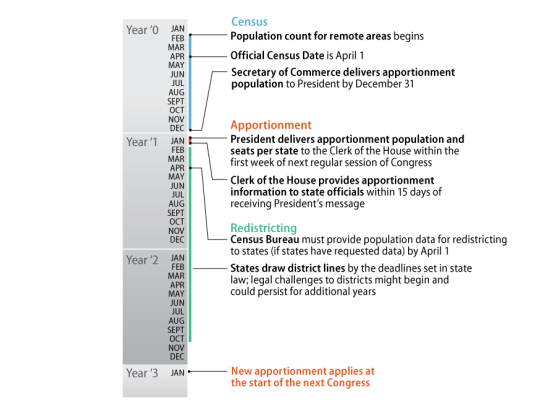
Every 10 years, the U.S. population is counted through the national census, and districts for the U.S. House of Representatives are readjusted to reflect the new population level and its distribution across states through the federal apportionment and state redistricting processes. The requirement to have proportional representation in the House is found in the U.S. Constitution, and constitutional provisions also underlie other elements of the census, apportionment, and redistricting practices. Figure 1 provides a generalized timeline for how these three interrelated processes occur, and the sections of the report that follow provide additional information on apportionment and redistricting. For additional information on the census process, see CRS Report R44788, The Decennial Census: Issues for 2020, and CRS In Focus IF11015, The 2020 Decennial Census: Overview and Issues.
Apportionment Process
Apportionment (or reapportionment) refers to the process of dividing seats in the U.S. House of Representatives among the states. Article 1, Section 2, of the U.S. Constitution, as amended by Section 2 of the Fourteenth Amendment, requires that seats for Representatives are divided among states, based on the population size of each state. House seats today are reallocated due to changes in state populations, since the number of U.S. states (50) has remained constant since 1959; in earlier eras, the addition of new states would also affect the reapportionment process, as each state is constitutionally required to receive at least one House seat.
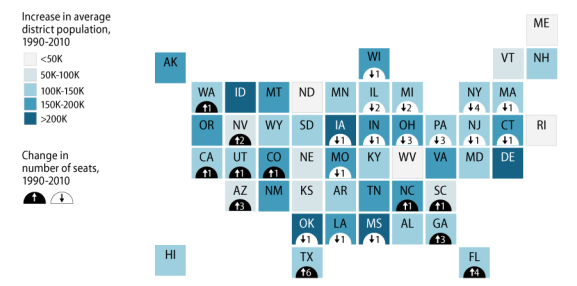
The 2010 census reported a 9.9% overall increase in the U.S. apportionment population since the 2000 census, to 309,183,463 individuals.1 The ideal (or average) district population size increased across all states following the 2010 census, even though some states experienced larger growth levels than others.2 The average congressional district population for the United States following the 2010 census was 710,767 individuals.3
The map in Figure 2 illustrates changes in states' ideal district size and changes in the number of House seats allocated to each state between the 1990 and 2010 apportionments. Twelve U.S. House seats shifted across states following the 2010 census; 10 states lost seats and 8 states gained seats, distributed as shown in Table 1. Table 2 provides additional historical data on the number of states and number of seats affected by each apportionment since 1910.
Regional patterns of population change observed following previous censuses continued in 2010, as the percentage of House seats distributed across the Northeast and Midwest regions decreased, and the percentage of House seats distributed across the South and West regions increased.4 California had the largest House delegation following the 2010 census, with 53 seats; Alaska, Delaware, Montana, North Dakota, South Dakota, Vermont, and Wyoming each had a single House seat.5
|
Lost U.S. House Seats |
Gained U.S. House Seats |
||
|
State |
Seat Change |
State |
Seat Change |
|
Illinois |
-1 |
Arizona |
+1 |
|
Iowa |
-1 |
Florida |
+2 |
|
Louisiana |
-1 |
Georgia |
+1 |
|
Massachusetts |
-1 |
Nevada |
+1 |
|
Michigan |
-1 |
South Carolina |
+1 |
|
Missouri |
-1 |
Texas |
+4 |
|
New Jersey |
-1 |
Utah |
+1 |
|
New York |
-2 |
Washington |
+1 |
|
Ohio |
-2 |
||
|
Pennsylvania |
-1 |
||
Source: Kristen D. Burnett, Congressional Apportionment: 2010 Census Briefs, U.S. Census Bureau, Report Number C2010BR-08, Washington, DC, November 2011, at https://www.census.gov/content/dam/Census/library/publications/2011/dec/c2010br-08.pdf.
|
Census Year |
States Losing Seats |
States Gaining Seats |
Total States Affected By Apportionment |
House Seats Affected by Apportionment |
|
2010 |
10 (20.0%) |
8 (16.0%) |
18 (36.0%) |
12 (2.8%) |
|
2000 |
10 (20.0%) |
8 (16.0%) |
18 (36.0%) |
12 (2.8%) |
|
1990 |
13 (26.0%) |
8 (16.0%) |
21 (42.0%) |
19 (4.4%) |
|
1980 |
10 (20.0%) |
11 (22.0%) |
21 (42.0%) |
17 (3.9%) |
|
1970 |
9 (18.0%) |
5 (10.0%) |
14 (28.0%) |
11 (2.5%) |
|
1960a |
16 (32.0%) |
10 (20.0%) |
26 (52.0%) |
21 (4.8%) |
|
1950b |
9 (18.8%) |
7 (14.6%) |
16 (33.3%) |
14 (3.2%) |
|
1940b |
9 (18.8%) |
7 (14.6%) |
16 (33.3%) |
9 (2.1%) |
|
1930b |
21 (43.8%) |
13 (27.1%) |
34 (70.8%) |
27 (6.2%) |
|
1920c |
— |
— |
— |
— |
|
1910d |
0 (0.0%) |
25 (54.3%) |
25 (54.3%) |
47 (10.9%) |
Source: U.S. Census Bureau, 2010 Census: Apportionment Data Map, at https://www.census.gov/2010census/data/apportionment-data-map.html.
a. The 1960 apportionment was the first to include Hawaii and Alaska, which became states in 1959.
b. Apportionments between 1930 and 1950 occurred with 48 states.
c. No apportionment occurred after the 1920 census.
d. The 1910 apportionment occurred with a House size of 433 and 46 states. Two seats were added to the House once Arizona and New Mexico became states in 1912.
Federal Requirements/Guidelines for Reapportionment: History and Current Policy
The constitutional requirements for representation in the House based on state population size are provided in Article I, Section 2, as amended by Section 2 of the Fourteenth Amendment.6 Article I, Section 2, specified the first apportionment of seats for the House of Representatives,7 and it also includes some standards for subsequent reapportionments. Article I, Section 2, requires that the national population be counted at least once every 10 years in order to distribute House seats across states. Broad parameters for the number of House Members are also contained in Article I, Section 2: there can be no more than one Representative for every 30,000 persons, provided that each state receives at least one Representative.
Federal statute establishes a number of other elements of the apportionment process, including how to count the population every 10 years via the decennial census; how many seats are in the House; how those House seats are divided across states; and certain related administrative details. In the 19th century, Congress often passed measures each decade to address those factors, specifically for the next upcoming census and reapportionment. By the early 20th century, however, Congress began to create legislation to standardize the process and apply it to all subsequent censuses and reapportionments, unless modified by later acts.8
One example of such legislation was the permanent authorization of the U.S. Census Bureau in 1902,9 which helped establish a recurring decennial census process and timeline. Other legislation established the current number of 435 House seats;10 this number was first used following the 1910 census and subsequently became fixed under the Permanent Apportionment Act of 1929.11 Congress also created a more general reapportionment formula and process to redistribute seats across states. The timeline for congressional reapportionment and current method for allocating seats among states were contained in the Apportionment Act of 1941, which would then apply to every reapportionment cycle, beginning with the one following the 1950 census.12 The size of the House, method for reapportionment, and timeline for reapportionment are codified in 2 U.S.C. §2a and are further detailed in the section below, alongside the relevant census procedures codified in Title 13 of the U.S. Code.
Reapportionment Method and Timeline
The apportionment steps detailed below are also summarized by the timeline in Figure 1. Under federal law, April 1 in any year ending in "0" marks the official decennial census date and the beginning of the population counting process.13 The U.S. Census Bureau calculates the apportionment population for the United States from the information it collects in the decennial census and certain administrative records.14 The apportionment population reflects the total resident population in each of the 50 states, including minors and noncitizens, plus Armed Forces personnel/dependents living overseas and federal civilian employees/dependents living overseas.15 The Secretary of Commerce must report the apportionment population to the President within nine months of the census date (by December 31 of the year ending in "0").16 In past years, the Census Bureau has released apportionment counts to the public at about the same time they are presented to the President.17
Under requirements in the Constitution, each state must receive at least one House Representative, and under statute, the current House size is set at 435 seats.18 To determine how the 51st through 435th seats are distributed across the 50 states, a mathematical approach known as the method of equal proportions is used, which is specified in statute.19 Essentially, under this method, the "next" House seat available is apportioned to the state ranked highest on a priority list. The priority list rankings are calculated by taking each state's apportionment population from the most recent census, and multiplying it by a series of values. The multipliers used are the reciprocals of the geometric means between every pair of consecutive whole numbers, with those whole numbers representing House seats to be apportioned.20 The resulting priority values are ordered from largest to smallest, and with the House size set at 435, the states with the top 385 priority values receive the available seats. See the Appendix for additional information on the method of equal proportions and other methods proposed or used in previous apportionments.
The President then transmits a statement to Congress showing (1) "the whole number of persons in each State," as determined by the decennial census and certain administrative records; and (2) the resulting number of Representatives each state would be entitled to under an apportionment, given the existing number of Representatives and using the method of equal proportions. The President submits this statement to Congress within the first week of the first regular session of the next Congress (typically, early January of a year ending in "1").21 Within 15 calendar days of receiving the President's statement, the Clerk of the House sends each state governor a certificate indicating the number of Representatives the state is entitled to. Each state receives the number of Representatives noted in the President's statement for its House delegation, beginning at the start of the next session of Congress (typically, early January of a year ending in "3").
States may then engage in their own redistricting processes, which vary based on state laws. Federal law contains requirements for how apportionment changes will apply to states in the event that any congressional elections occur between a reapportionment and the completion of a state's redistricting process. In these instances, states with the same number of House seats would use the existing congressional districts to elect Representatives; states with more seats than districts would elect a Representative for the "new" seat through an at-large election and use existing districts for the other seats; and states with fewer seats than districts would elect all Representatives through an at-large election.22
Redistricting Process23
Congressional redistricting involves creating or redrawing geographic boundaries for U.S. House districts within a state. Redistricting procedures are largely determined by state law and vary across states, but states must comply with certain parameters established by federal statute and court decisions. In general, there is variation among states regarding the practice of drawing districts and which decisionmakers are involved in the process. Across states, there are some common standards and criteria for districts, some of which reflect values that are commonly thought of as traditional districting practices. Districting criteria may result either from shared expectations and precedent regarding what districts should be like, or they may result from certain standards established by current federal statute and court decisions. These criteria typically reflect a goal of enabling "fair" representation for all residents, rather than allowing arbitrary, or discriminatory, map lines.24
Redistricting efforts intended to unfairly favor one group's interests over another's are commonly referred to as gerrymandering.25 Packing and cracking are two common terms that describe such districts, but there are various ways in which district boundaries might be designed to advantage or disadvantage certain groups of voters. Packing describes district boundaries that are drawn to concentrate individuals who are thought to share similar voting behaviors into certain districts. Concentrating prospective voters with shared preferences can result in a large number of "wasted votes" for these districts, as their Representatives will often be elected by a supermajority that far exceeds the number of votes required for a candidate to win. Cracking may be thought of as the opposite of packing, and occurs when individuals who are thought to share similar voting preferences are deliberately dispersed across a number of districts. This approach dilutes the voting strength of a group and can prevent its preferred candidates from receiving a majority of the vote in any district.
For some states, redistricting following an apportionment may be necessary to account for House seats gained or lost based on the most recent census population count.26 Generally, however, states with multiple congressional districts engage in redistricting following an apportionment in order to ensure that the population size of each district remains approximately equal under the equality standard or "one person, one vote" principle (discussed under "Population Equality" below). Some states might make additional changes to district boundaries in the years following an initial redistricting; in some instances, such changes are required by legal decisions finding that the initial districts were improperly drawn.27
Federal Requirements/Guidelines for Redistricting: History and Current Policy
From time to time, Congress considers legislation that would affect apportionment and redistricting processes. The Constitution requires the apportionment of House seats across states based on population size, but it does not specify how those seats are to be distributed within each state. Most redistricting practices are determined by state constitutions or statutes, although some parts of the redistricting process are affected by federal statute or judicial interpretations.28
The current system of single-member districts (rather than a general ticket system, where voters could select a slate of Representatives for an entire state) is provided by 2 U.S.C. §2c.29 In addition to requiring single-member districts, Congress has, at times, passed legislation addressing House district characteristics. For example, in the 1800s and early 1900s, some federal apportionment statutes included other standards for congressional districts, such as population equality or geographic compactness.30 None of these criteria is expressly contained in the current statute addressing federal apportionment.31
Many of the other federal parameters for congressional redistricting have resulted from judicial decisions.32 It is not uncommon for states to face legal challenges regarding elements of their redistricting plans.33 One analysis of the 2010 redistricting cycle, for example, found that redistricting lawsuits had been filed in 38 states,34 and legal challenges to congressional districts in several states continued into 2019.35 This report is not intended to be a legal analysis. For additional information on redistricting law, see CRS Report R44199, Congressional Redistricting: Legal and Constitutional Issues, and CRS Report R44798, Congressional Redistricting Law: Background and Recent Court Rulings.
Population Equality
One area of redistricting addressed by federal standards is population equality across districts. Legislative provisions, requiring that congressional districts "[contain] as nearly as practicable an equal number of inhabitants," were found in federal apportionment acts between 1872 and 1911.36 The U.S. Supreme Court has also addressed population size variance among congressional districts within a state, or malapportionment. Under what is known as the "equality standard" or "one person, one vote" principle, the Court has found congressional districts within a state should be drawn to approximately equal population sizes.37 Mathematically, there are several ways in which the population difference across districts (or deviation from an ideal district size) may be expressed.38
These equal population standards apply only to districts within a state, not to districts across states. To illustrate how district population sizes can vary across states, Table 3 provides Census Bureau estimates from 1910 to 2010 for the average district population size nationwide, as well as estimates for which states had the largest and smallest average district population sizes. Wide variations in state populations and the U.S. Constitution's requirement of at least one House seat per state make it difficult to ensure equal district sizes across states, particularly if the size of the House is fixed.39 The expectation that districts in a state will have equal population sizes reinforces the long-standing practice that states redraw district boundaries following each U.S. Census, in order to account for the sizable population shifts that can occur within a 10-year span.40
|
Apportionment Year |
Average District Population Size |
Largest Average District Population |
Smallest Average District Population |
|
2010 |
710,767 |
994,416 (Montanaa) |
527,624 (Rhode Island) |
|
2000 |
646,952 |
905,316 (Montanaa) |
495,304 (Wyominga) |
|
1990 |
572,466 |
803,655 (Montanaa) |
455,975 (Wyominga) |
|
1980 |
519,235 |
690,178 (South Dakotaa) |
393,345 (Montana) |
|
1970 |
469,088 |
624,181 (North Dakotaa) |
304,067 (Alaskaa) |
|
1960b |
410,481 |
484,633 (Maine) |
226,167 (Alaskaa) |
|
1950c |
344,587 |
395,948 (Rhode Island) |
160,083 (Nevadaa) |
|
1940c |
301,164 |
359,231 (Vermonta) |
110,247 (Nevadaa) |
|
1930c |
280,675 |
395,982 (New Mexicoa) |
86,390 (Nevadaa) |
|
1920d |
— |
— |
— |
|
1910e |
210,328 |
228,027 (Washington) |
80,293 (Nevadaa) |
Source: U.S. Census Bureau, 2010 Census: Apportionment Data Map, at https://www.census.gov/2010census/data/apportionment-data-map.html.
a. State had a single House district during the noted apportionment year.
b. The 1960 apportionment was the first to include Hawaii and Alaska, which became states in 1959.
c. Apportionments between 1930 and 1950 occurred with 48 states.
d. No apportionment occurred after the 1920 Census.
e. The 1910 apportionment occurred with a House size of 433 and 46 states. Two seats were added to the House once Arizona and New Mexico became states in 1912.
To assist states in drawing districts that have equal population sizes, the Census Bureau provides population tabulations for certain geographic areas identified by state officials, if requested, under the Census Redistricting Data Program, created by P.L. 94-171 in 1975. Under the program, the Census Bureau is required to provide total population counts for small geographic areas; in practice, the Bureau also typically provides additional demographic information, such as race, ethnicity, and voting age population, to states.41
Racial/Language Minority Protections42
The Voting Rights Act of 1965 (VRA) also affects how congressional districts are drawn. One key statutory requirement for congressional districts comes from Section 2 of the VRA, as amended, which prohibits states or their political subdivisions from imposing any voting qualification, practice, or procedure that results in denial or abridgement of the right to vote based on race, color, or membership in a language minority.43 Under the VRA, states cannot draw district maps that have the effect of reducing, or diluting, minority voting strength.44
Other Redistricting Considerations
In addition to requirements of population equality and compliance with the VRA, several other redistricting criteria are common across many states today, including compactness, contiguity, and observing political boundaries.45 Some of the common redistricting criteria specified by states are presented in Table 4. These factors are sometimes referred to as traditional districting principles and are often related to geography. The placement of district boundaries, for example, might reflect natural features of the state's land; how the population is distributed across a certain land area; and efforts to preserve existing subdivisions or communities (such as town boundaries or neighborhood areas). Redistricting laws in many states currently include such criteria, but they are not explicitly addressed in current federal statute. Previous federal apportionment statutes, however, sometimes contained similar provisions.
|
State |
Compact |
Contiguous |
Political Subdivisions |
Communities of Interest |
Competitive |
Preserve "Core" |
Avoid Pairing Incumbents |
|
AL |
Yes |
Yes |
Yes |
Yes |
|||
|
AZ |
Yes |
Yes |
Yes |
Yes |
Yes |
||
|
CA |
Yes |
Yes |
Yes |
Yes |
|||
|
CO |
Yes |
Yes |
Yes |
Yes |
Yes |
||
|
FL |
Yes |
Yes |
Yes |
||||
|
GA |
Yes |
Yes |
Yes |
Yes |
|||
|
HI |
Yes |
Yes |
Yes |
||||
|
ID |
Yes |
Yes |
Yes |
Yes |
|||
|
IA |
Yes |
Yes |
Yes |
||||
|
KS |
Yes |
Yes |
Yes |
Yes |
|||
|
KY |
Yes |
Yes |
Yes |
||||
|
LA |
Yes |
Yes |
Yes |
||||
|
ME |
Yes |
Yes |
Yes |
||||
|
MI |
Yes |
Yes |
Yes |
Yes |
|||
|
MN |
Yes |
Yes |
Yes |
Yes |
|||
|
MS |
Yes |
Yes |
Yes |
Yes |
|||
|
MO |
Yes |
Yes |
|||||
|
NE |
Yes |
Yes |
Yes |
Yes |
|||
|
NV |
Yes |
Yes |
Yes |
Yes |
Yes |
||
|
NM |
Yes |
Yes |
Yes |
Yes |
Yesa |
Yesa |
|
|
NY |
Yes |
Yes |
Yes |
Yes |
Yes |
Yes |
|
|
NC |
Yes |
Yes |
Yes |
Yesa |
|||
|
OH |
Yes |
Yes |
Yes |
Yes |
|||
|
OK |
Yes |
Yes |
Yes |
Yes |
|||
|
OR |
Yes |
Yes |
Yes |
||||
|
PA |
Yes |
Yes |
Yes |
||||
|
RI |
Yes |
Yes |
Yes |
||||
|
SC |
Yes |
Yes |
Yes |
Yes |
Yes |
Yes |
|
|
TX |
Yes |
Yes |
|||||
|
UT |
Yes |
Yes |
Yes |
Yes |
|||
|
VA |
Yes |
Yes |
Yes |
||||
|
WA |
Yes |
Yes |
Yes |
Yes |
Yes |
||
|
WV |
Yes |
Yes |
Yes |
||||
|
WYb |
Yes |
Yes |
Yes |
Source: National Conference of State Legislatures, "Redistricting Criteria," April 23, 2019, at http://www.ncsl.org/research/redistricting/redistricting-criteria.aspx; and individual state pages linked from Ballotpedia, "State-by-State Redistricting Procedures," at https://ballotpedia.org/State-by-state_redistricting_procedures. Additional information may be available from individual states. See the following text sections for an explanation of the criteria used as column headings in this table.
Notes: States excluded from this table do not specify any of these criteria for congressional redistricting. These states are Alaska, Arkansas, Connecticut, Delaware, Illinois, Indiana, Maryland, Massachusetts, Montana, New Hampshire, New Jersey, North Dakota, South Dakota, Tennessee, Vermont, and Wisconsin. Some of these states (Alaska, Delaware, Montana, North Dakota, South Dakota, and Vermont) currently have a single House seat.
a. Factor is something that state may "allow" for consideration.
Compactness and Contiguity
As a districting criterion, compactness reflects the idea that a congressional district should represent a geographically consolidated area.46 Compactness of congressional districts is a requirement in 30 states, but often, state laws do not specify precise measures of compactness.47 Generally, a compact district would tend to have smoother boundaries and might resemble a standard geometric shape more than a less compact district. In some conceptualizations, a compact district would have an identifiable "center" that seems reasonably equidistant from any of its boundaries.48
Federal apportionment acts between 1842 and 1911 contained a provision requiring that congressional districts be of "contiguous territory,"49 and most states have included similar language in their current redistricting laws. For a district to be contiguous, it generally must be possible to travel from any point in the district to any other place in the district without crossing into a different district.50
Preserving Political Subdivisions
Most states require that redistricting practitioners take into account existing political boundaries, such as towns, cities, or counties. In many instances, districts may not be able to be drawn in ways that encompass entire political subdivisions, given other districting standards, like population equality, that could take precedence. Maintaining political subdivisions can also help simplify election administration by ensuring that a local election jurisdiction is not split among multiple congressional districts. Some state laws direct redistricting authorities to preserve the "core" of existing congressional districts; other states prohibit drawing district boundaries that would create electoral contests between incumbent House Members.51
Preserving Communities of Interest
Some states include the preservation of communities of interest as a criterion in their redistricting laws. People within a community of interest generally have a shared background or common interests that may be relevant to their legislative representation. These recognized similarities may be due to shared social, cultural, historical, racial, ethnic, partisan, or economic factors. In some instances, communities of interest may naturally be preserved by following other redistricting criteria, such as compactness or preserving political subdivisions.52
Promoting Political Competition; Considering Existing District or Incumbent
Some states include measures providing that districts cannot be drawn to unduly favor a particular candidate or political party. The term gerrymander originated to describe districts drawn to favor a particular political party,53 and it is often used in this context today. Redistricting has traditionally been viewed as an inherently political process, where authorities have used partisan considerations in drawing district boundaries. Districts generally may be drawn in a way that is politically advantageous to certain candidates or political parties, unless prohibited by state law.54 Some states, for example, expressly allow the use of party identification information in the redistricting process, whereas others prohibit it; similarly, some states may allow for practices to protect an incumbent or maintain the "core" of an existing district, whereas other states prohibit any practices that would favor or disfavor an incumbent or candidate.55
State Processes for Redistricting
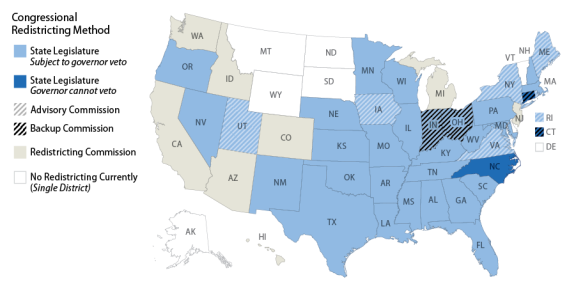
Redistricting processes are fundamentally the responsibility of state governments under current law and practice. Among the 43 states with multiple House districts, a variety of approaches are taken, but generally, states either allow their state legislatures or a separate redistricting commission to determine congressional district boundaries. The map in Figure 3 displays the redistricting methods currently used across states.
 |
|
Source: CRS compilation, based on information from Ballotpedia and the National Conference of State Legislatures. Graphic created by Amber Hope Wilhelm, CRS Visual Information Specialist. Notes: Iowa has nonpartisan legislative staff create its redistricting maps but requires legislative approval to enact them. Montana would use a redistricting commission if it receives an additional House seat. |
Historically, and in the majority of states today, congressional district boundaries are primarily determined by state legislatures. Currently, 37 states authorize their state legislatures to establish congressional district boundaries. Most of these states enable the governor to veto a redistricting plan created by the legislature; Connecticut and North Carolina do not allow a gubernatorial veto.56
Other states, in recent years, have begun to use redistricting commissions, which may be more removed from state legislative politics.57 In eight states that currently have multiple congressional districts (Arizona, California, Colorado, Hawaii, Idaho, Michigan, New Jersey, and Washington), redistricting commissions are primarily responsible for redrawing congressional districts; Montana's state constitution provides for an independent redistricting commission to draw congressional district boundaries, if reapportionment results in multiple seats for the state. In five other states (Maine, New York, Rhode Island, Utah, and Virginia), a commission serves in an advisory capacity during the redistricting process. Commissions may also be used as a "backup" or alternate means of redistricting if the legislature's plan is not enacted, such as in Connecticut, Indiana, and Ohio.
The composition of congressional redistricting commissions can also vary; many include members of the public selected by a method intended to be nonpartisan or bipartisan, whereas other commissions may include political appointees or elected officials, such as in Hawaii and New Jersey. A commission's membership, the authority granted to it, its relationship to other state government entities, and other features may affect whether a commission is perceived to be undertaking an objective process or a more politicized one. Some proponents of redistricting commissions believe that using independent redistricting commissions can prevent opportunities for partisan gerrymandering and may create more competitive and representative districts.58 Others, however, believe that political considerations can remain in commission decisionmaking processes, and that the effect of redistricting methods on electoral competitiveness is overstated.59 For more information on redistricting commissions, see CRS Insight IN11053, Redistricting Commissions for Congressional Districts.
The timeline for redistricting also varies across states, and can be affected by state or federal requirements regarding the redistricting process; the efficiency of the legislature, commission, or other entities involved in drawing a state's districts; and, potentially, by legal or political challenges made to a drafted or enacted redistricting plan.60 In general, the redistricting process would usually begin early in a year ending in "1," once each state has learned how many seats it is entitled to under the apportionment following the decennial census. Many states complete the process within the next year. After the 2010 reapportionment, for example, Iowa was the first state to complete its initial congressional redistricting plan on March 31, 2011, and 31 other states completed their initial plans by the end of 2011. The remaining 11 states with multiple congressional districts completed their initial redistricting plans by the middle of 2012, with Kansas becoming the final state to complete its initial plan on June 7, 2012.61 Some states may redistrict multiple times between apportionments, if allowed under state law or required by a legal challenge to the preliminary redistricting.62
Congressional Options Regarding Redistricting
Although redistricting processes in practice today are largely governed by state law, Congress has, at times, considered an expanded federal government role, which could serve to standardize certain elements of the redistricting process across states. Given the historically limited role the federal government has played in the redistricting process, concerns about federalism may arise in the context of certain congressional efforts addressing redistricting. The types of legislative proposals briefly introduced in this section reflect some common examples of redistricting bills introduced in recent Congresses; they are not meant to be an exhaustive list of all the options Congress has considered or could consider related to redistricting.
Some legislative proposals in recent Congresses would establish criteria for districts, such as population equality, compactness, contiguity, or preservation of existing political subdivisions.63 Bills have also been introduced that would require states to use independent redistricting commissions and/or maintain certain standards of public input and transparency regarding the redistricting process.64 Some congressional bills include provisions to prevent states from redistricting more than once following an apportionment, which is a practice sometimes referred to as "mid-decade redistricting."65 Other bills would expand oversight by the Department of Justice under certain circumstances related to existing requirements of, or proposed amendments to, the VRA.66
Most of these bills have been referred to committee but not passed by either chamber. In the 116th Congress, H.R. 1 served as a subject of multiple committee hearings and was passed by the House. H.R. 1 is a multifaceted bill that addresses multiple areas of election administration, among other topics; with respect to redistricting, it would require states to use independent redistricting commissions, adopt certain redistricting criteria, and prohibit mid-decade redistricting.67
Concluding Observations
Apportionment and redistricting address fundamental elements of representational democracy. Determining how many elected representatives should serve in the House, and how many people should be in each congressional district, are central questions for those who are concerned with how responsive the House can be to the interests of the American public. During earlier eras in the United States, the number of seats in the House of Representatives generally increased as the American population increased, and district sizes could be kept more equal over time and across states. The House size, however, has been set at 435 seats throughout the last century, while the national population has continued to grow and concentrate in certain geographic areas, leading to larger constituencies across all House districts over time and disparate district sizes across states.
Certain elements of the apportionment process are established by the U.S. Constitution. This includes the requirement for representation in the House based on state population size; the reallocation of House seats every 10 years upon the completion of a national population count; and the requirements that each state receives at least one Representative and that there can be no more than one Representative for every 30,000 persons. Other elements of the process are addressed through congressional legislation, such as the overall number of House seats or method of distributing seats among the states. Congress more regularly legislated in this area prior to the mid-20th century, passing decennial acts to address upcoming censuses and apportionments, rather than creating bills intended to apply for all future reapportionment cycles.
Whereas apportionment is a process largely governed by federal statute, redistricting is a process, in practice, largely governed by state law. Certain federal standards apply to House districts, generally in the interest of preserving equal access to representation, but the method and timeline by which those districts are created is largely determined by state law. In states with multiple congressional districts, there are a multitude of ways in which district boundaries can be drawn, depending upon the criteria used to create the districts. There is often an expectation that congressional districts will be drawn in a way that ensures "fair" representation, but "fairness" can be a somewhat subjective determination.
Many lawmakers and members of the public may agree on some of the more basic representational principles embedded in apportionment and redistricting law, but can find it difficult to apply those principles in practice. The criteria commonly used for redistricting today reflect a combination of state and federal statutes, judicial interpretations, and practices from past redistricting cycles that may require trade-offs between one consideration and another. Ensuring equal population size across all congressional districts, for example, may be an agreeable goal for many individuals. In practice, however, the geographic and demographic distribution of residents within and across states, coupled with requirements to observe state boundaries, provide all states with at least one Representative, and maintain a constant number of House seats, make this goal more difficult to achieve. Although mapmaking software today can design districts with increasing precision with respect to geographic boundaries and population characteristics, this technological capacity has not necessarily simplified the overall task of redistricting. A majority of states faced legal challenges to congressional district maps drawn following the 2010 census, and several cases remained pending in 2019, reflecting differing perspectives on fairness, representational access, and how competing redistricting criteria should be weighted.
Appendix. Determining an Apportionment Method
Congress is a bicameral legislature, in which each state receives equal representation in the Senate and each state's representation in the House is based upon its population. Essentially, any method of apportionment for the House must consider three key variables: (1) the number of House seats; (2) the number of U.S. states; and (3) the apportionment population of each state. A mathematical decision must also be made regarding how fractions of seats are addressed, since House seats must be allocated as whole numbers, and simple division methods are unlikely to produce this outcome for all (or any) states. Because the Constitution does not specify a particular method for apportionment, several options have been considered and utilized throughout history.
When determining apportionment, parameters could be set for the number of seats in the House, the population size of a district, or both.68 The Constitution, to an extent, addresses House size and district size by requiring that each state receives at least one House seat and requiring that there can be no more than one Representative per every 30,000 persons.69 Yet these provisions provide little practical guidance for what the size of the House or the size of a district should be. Based on the number of states and U.S. apportionment population from the 2010 Census, for example, the House could range from a minimum of 50 seats to a maximum size of over 10,000 seats. As a general principle, House size and district size are inversely related: a larger number of House seats means smaller population sizes for districts, and a smaller number of House seats means larger population sizes for districts. Attempts by the Framers and various Congresses to address apportionment reveal a number of perspectives on how best to create a representative legislature, along with political and logistical considerations related to changes in the size of the House.70
Prioritizing Equal-Sized Districts or Preserving a Fixed House Size
An apportionment method prioritizing relatively equal district population size would establish a representation ratio, where there would be one Representative per x number of persons. If the ratio remains the same across apportionment cycles, increases or decreases in the U.S. apportionment population would result in corresponding increases or decreases to the total number of House seats. The representation ratio could also be adjusted to create larger or smaller districts, in order to limit the magnitude of changes to the overall size of the House. If states receive fractional allocations of House seats and there is no constraint on the size of the House, a simple rounding rule could be utilized to arrive at a whole number of seats for the House overall.
A general example of an apportionment approach prioritizing relatively equal district size follows:
- 1. determine an ideal district population size, d;
- 2. divide each state's apportionment population, ps1, ps2 … ps50, by d to determine how many House seats a state would be entitled to (its "quota" of seats), q; and
- 3. determine a rounding rule to apply for states in which q is not a whole number.71
Until the early 20th century, the size of the House generally increased with each apportionment, due to the addition of new states and population growth,72 but today, the number of House seats is set at 435 by federal statute.73 Arguments to expand the House have included expanding the range of interests that House Members would represent and ensuring that Members remained knowledgeable about local issues. Yet concerns have also been raised that it would not be feasible to increase the House size apace with national population growth.74
To be sure that a particular apportionment conforms to a specified size of the House, each state must receive a whole number of seats, and the sum of all states' seats must equal the desired total House size. Many apportionment approaches vary on how to address fractional seats, as remainders will often result when calculating state seat quotas. A general example of an apportionment approach to reach a certain House size follows:
- 1. a set number of House seats, H, is agreed upon;
- 2. divide the national apportionment population, pUSA, by H to determine an "ideal" or average district population size, d, also known as the "initial divisor";
- 3. divide each state's apportionment population, ps1, ps2 … ps50, by d to determine how many House seats a state would be entitled to (its "quota" of seats), q;
- 4. determine a rounding rule to apply to any q values that are not whole numbers (to represent actual House seats, which cannot be divided);75 and
- 5. add these rounded (or adjusted), q values; if this sum does not equal H, determine a method to adjust state quotas so that the sum of the resulting q values equals H.
The following discussions provide an introduction to several methods that have been used for congressional apportionment in the United States. To illustrate how these methods work, for each method an imaginary example is provided in the accompanying table, in which the size of the House is fixed at 20 Members and the seats are divided among four states (states A, B, C, and D) with the populations specified in the tables.
Hamilton/Vinton Method (Ranking Fractional Remainders)
Congress considered various methods of apportionment after the first census of 1790 and passed an initial apportionment bill in 1792 that would have utilized what is now known as the Hamilton/Vinton method. President George Washington, however, exercised his first veto on the measure, in part, because the resulting apportionment calculations would have violated the requirement of at least 30,000 persons per district for multiple states.76 Representative Samuel Vinton later introduced legislation proposing this method, which was enacted, and this apportionment method was first used in 1850 and continued to inform apportionment considerations throughout the rest of the 19th century, in conjunction with the Webster method (discussed below). The Hamilton/Vinton method is based on a fixed House size, H. Each state receives the whole number of seats in its quota, q, of seats. The remainders from q are rank-ordered from largest to smallest, and any additional House seats are apportioned to the states with the largest remainders.
|
Step 1: Find whole number of seats using d (round down any q remainder) |
Step 2: Apportion additional seats in order of largest fractional remainders |
||||||
|
State |
Population |
Quota (q)a |
Seats |
Remainder |
Rank |
Additional Seat(s) |
Total Seats |
|
A |
2,560 |
2,560 / 594.1 = 4.31 |
4 |
.31 |
4th |
0 |
4 |
|
B |
3,315 |
3,315 / 594.1 = 5.58 |
5 |
.58 |
2nd |
1 |
6 |
|
C |
995 |
995 / 594.1 = 1.67 |
1 |
.67 |
1st |
1 |
2 |
|
D |
5,012 |
5,012 / 594.1 = 8.44 |
8 |
.44 |
3rd |
0 |
8 |
|
Total |
11,882 |
18 |
2 |
20 |
|||
Source: Adapted from U.S. Census Bureau, "Methods of Apportionment," at https://www.census.gov/history/www/reference/apportionment/methods_of_apportionment.html.
a. The denominator here is calculated by dividing the national apportionment population (pUSA = 11,882) by the number of House seats (H = 20).
Jefferson Method (Largest Divisors)
Following the presidential veto of the Hamilton method, Congress adopted the Jefferson method of apportionment, which was used from 1792 to 1832. The Jefferson method for apportionment is based on a fixed House size, H, and each state's quota of seats, q, is rounded down to the nearest whole number. Often, the sum of the rounded-down q values is less than H. When this occurs, divisor values smaller than d are tested until an adjusted divisor, dadj, is found that results in a set of q values which, when rounded down, sum to H.
|
Step 1: Find seats if apportioned using initial divisor, d (round down any q remainder) |
Step 2: Apportion seats using adjusted divisor, dadja |
||||
|
State |
Population |
Quota (q)b |
Seats |
Quota |
Total Seats |
|
A |
2,560 |
2,560 / 594.1 = 4.31 |
4 |
2,560 / 550 = 4.65 |
4 |
|
B |
3,315 |
3,315 / 594.1 = 5.58 |
5 |
3,315 / 550 = 6.03 |
6 |
|
C |
995 |
995 / 594.1 = 1.67 |
1 |
995 / 550 = 1.81 |
1 |
|
D |
5,012 |
5,012 / 594.1 = 8.44 |
8 |
5,012 / 550 = 9.11 |
9 |
|
Total |
11,882 |
18 |
20 |
||
Source: Adapted from U.S. Census Bureau, "Methods of Apportionment," at https://www.census.gov/history/www/reference/apportionment/methods_of_apportionment.html.
a. The regular divisor, d, is often used as a starting point to inform what values could work for an adjusted divisor, dadj. Here, 550 is used as the adjusted divisor value, but any integer between 513 or 552 would also produce a series of q values that, when rounded down, sum to the total House size of 20 seats.
b. The denominator here is calculated by dividing the national apportionment population (pUSA = 11,882) by the number of House seats (H = 20).
Webster Method (Major Fractions)
Some believed that the Jefferson method favored large states, and the Webster method was an approach first used for apportionment in 1842 and last used for apportionment following the 1930 census. The Webster method is similar to the Hamilton/Vinton method but differs in how it addresses remainders of seats. Each state receives the whole number of seats in its quota, q; then, q remainders greater than or equal to 0.5 are rounded up to the next whole number, and those states receive an additional seat. The example provided in Table A-3 happens to result in the same number of House seats as the other examples in this appendix, which treat the House size, H, as fixed at 20 seats, but performing these initial calculations under the Webster method could result in a subsequent adjustment to the number of House seats.77 If the House size remains fixed, and the initial sum of seats produced by the Webster method does not equal the desired number of seats, an adjusted divisor, dadj, can be used to calculate q values that, when rounded and summed, result in a specific House size.
|
Step 1: Find whole number of seats using d (round down any q remainder) |
Step 2: Apportion additional seat to state if quota remainder ≥ 0.5 |
|||||
|
State |
Population |
Quota (q)a |
Seats |
Remainder |
Additional Seat |
Total Seats |
|
A |
2,560 |
2,560 / 594.1 = 4.31 |
4 |
.31 |
0 |
4 |
|
B |
3,315 |
3,315 / 594.1 = 5.58 |
5 |
.58 |
1 |
6 |
|
C |
995 |
995 / 594.1 = 1.67 |
1 |
.67 |
1 |
2 |
|
D |
5,012 |
5,012 / 594.1 = 8.44 |
8 |
.44 |
0 |
8 |
|
Total |
11,882 |
18 |
2 |
20 |
||
Source: Adapted from U.S. Census Bureau, "Methods of Apportionment," at https://www.census.gov/history/www/reference/apportionment/methods_of_apportionment.html.
a. The denominator here is calculated by dividing the national apportionment population (pUSA = 11,882) by the number of House seats (H = 20).
Huntington-Hill Method (Method of Equal Proportions)
In addition to treating large and small states similarly, some have also believed that an apportionment method should minimize percentage differences in district population sizes (across states) as much as possible. The method of equal proportions, also known as the Huntington-Hill method, seeks to achieve this objective, and has been used for all House apportionments since 1941. This method differs from the Webster method by rounding up remainders for a state's quota, q, at the geometric mean, G, rather than at the arithmetic mean. The geometric mean is found by multiplying two successive numbers together, then taking the square root of their product; here, the successive numbers represent a state's q rounded down to the nearest whole number (its "lower" quota) and a state's q rounded up to the nearest whole number (its "upper" quota). Each state receives its "lower" quota of seats and then may receive an additional seat if its quota, q, is greater than or equal to its geometric mean, G.
|
Step 1: Find lower quota (round down any q remainder) and upper quota (round up any q remainder) |
Step 2: Apportion additional seat to state if quota ≥ geometric mean |
|||||||
|
State |
Population |
Quota (q)a |
Lower Quota |
Upper Quota |
Geometric Mean (G) |
Additional Seat (If q ≥ G) |
Total Seats |
|
|
A |
2,560 |
2,560 / 594.1 = 4.31 |
4 |
5 |
√(4x5) = 4.47 |
0 |
4 |
|
|
B |
3,315 |
3,315 / 594.1 = 5.58 |
5 |
6 |
√(5x6) = 5.48 |
1 |
6 |
|
|
C |
995 |
995 / 594.1 = 1.67 |
1 |
2 |
√(1x2) = 1.41 |
1 |
2 |
|
|
D |
5,012 |
5,012 / 594.1 = 8.44 |
8 |
9 |
√(8x9) = 8.49 |
0 |
8 |
|
|
Total |
11,882 |
18 |
22 |
2 |
20 |
|||
Source: Adapted from U.S. Census Bureau, "Methods of Apportionment," at https://www.census.gov/history/www/reference/apportionment/methods_of_apportionment.html.
a. The denominator here is calculated by dividing the national apportionment population (pUSA = 11,882) by the number of House seats (H = 20).
The initial calculation for a state's quota, q, under the method of equal proportions, is made by using the "ideal" district size, d, as the divisor. Table A-4 provides a sample apportionment in which the sum of the rounded geometric means happens to result in the desired House size, H, of 20 seats, but, in practice, this often does not occur. If the sum of the rounded geometric means for each state does not result in the desired number of House seats, there is an additional step: seats can be apportioned using a priority list, which essentially ranks each state's claim to the "next" House seat apportioned (i.e., the 51st-435th seats), after each state receives the one seat it is constitutionally entitled to.
To generate a priority list, each state's apportionment population is multiplied by a series of multiplier values. The multiplier values are created using the reciprocal of the geometric mean associated with each potential successive seat number for the state (above its constitutionally mandated first seat). For example, the multiplier value for a second House seat in any state would be 1/√(1 x 2) or 0.707, the multiplier for a third House seat would be √(2 x 3) or 0.408, and so on.78 The products that result from multiplying these values by each state's apportionment population are ranked from largest to smallest to create the priority list, and seats are distributed until H number of seats (currently 385, the number needed to get to a total of 435 seats once each of the 50 states receives its constitutionally required seat) have been apportioned.
Table A-5. Sample Priority Values and Resulting Priority List for Selected Values
House size (H) = 20 [Fixed]
|
State |
Population |
2nd Seat |
3rd Seat |
4th Seat |
5th Seat |
6th Seat |
7th Seat |
8th Seat |
9th Seat |
|
|
Priority Valuesa |
||||||||||
|
A |
2,560 |
1,810 |
1,045 |
739 |
572 |
467 |
395 |
342 |
302 |
|
|
B |
3,315 |
2,344 |
1,353 |
957 |
741 |
605 |
512 |
443 |
391 |
|
|
C |
995 |
704 |
406 |
287 |
222 |
182 |
154 |
133 |
117 |
|
|
D |
5,012 |
3,544 |
2,046 |
1,447 |
1,121 |
915 |
773 |
670 |
591 |
|
|
Corresponding Priority List Rankingb |
Total Seats |
|||||||||
|
A |
2,560 |
4 |
8 |
13 |
18 |
22 |
27 |
32 |
36 |
4 |
|
B |
3,315 |
2 |
6 |
9 |
12 |
16 |
20 |
23 |
28 |
6 |
|
C |
995 |
14 |
25 |
38 |
51 |
62 |
75 |
86 |
98 |
2 |
|
D |
5,012 |
1 |
3 |
5 |
7 |
10 |
11 |
15 |
17 |
8 |
|
Total |
11,882 |
20 |
||||||||
Source: CRS calculation.
a. Each priority value is calculated by multiplying the state's apportionment population by a multiplier, representing the reciprocal geometric mean of the last seat apportioned and the next seat to be apportioned. For seat number, n, the multiplier is 1 / (√((n-1) x n). For a list of multipliers, see U.S. Census Bureau, "Apportionment: Table of Multipliers using the Method of Equal Proportions," October 17, 2000, at https://www.census.gov/population/apportionment/files/atable.txt. In this table, priority values are rounded to the nearest whole number.
b. Values italicized and in bold represent the 16 remaining seats to be apportioned, after each state receives one seat as constitutionally required and assuming a House size of 20. Larger values in this table are not consecutive because this table only includes rankings associated with the first nine additional seats to be apportioned. Larger states could be ranked higher and entitled to additional seats (above nine) before smaller states receive any additional seats. In this example, if the priority list table continued to display values for additional seats, State D would be ranked 19th and would receive its 10th seat before State B receives its 7th seat (ranked 20th); State D is also ranked 21st and would receive its 11th seat before State A receives its 6th seat (ranked 22nd).