Introduction
Since the beginning of the program, Social Security taxes have been levied on covered earnings up to a maximum level set each year, referred to as the taxable earnings base.1 In 2019, an estimated 178 million workers paid into Social Security via Federal Insurance Contributions Act (FICA) taxes or Self-Employment Contributions Act (SECA) taxes, or both, on their wages and net self-employment income.2 Both employers and employees contribute taxes at the FICA rate, and SECA taxes are paid by the self-employed. Both taxes have three components: Old Age and Survivors Insurance (OASI), Disability Insurance (DI), and the Hospital Insurance (HI) part of Medicare. The OASDI (combined OASI and DI) tax is levied on earnings up to $132,900 in 2019 (see Table 1). The HI tax is levied on all earnings. By law, the Commissioner of Social Security is required to raise the base whenever an automatic benefit increase—a cost-of-living adjustment (COLA)—is granted to Social Security recipients, assuming wages have risen (e.g., there was no increase in the base from 2015 to 2016 due to no COLA increase for 2016).3
The taxable earnings base limits the amount of wages or self-employment income used to calculate contributions to Social Security. Unlike income taxes, workers who have earnings above the limit, whether they earn $200,000 or $2 million, pay the same dollar amount in Social Security payroll taxes. Under the 2019 limit of $132,900, the maximum amount a wage and salary worker directly contributes to Social Security is $8,240 (the worker's employer contributes an equal amount), whereas a self-employed individual contributes a maximum of $16,480.4
The taxable earnings base also limits the annual amount of earnings that are used in benefit calculations and thus sets a ceiling on the amount Social Security pays in benefits. If a worker earned at or above the earnings base for his or her entire career and retired in 2019 at the full retirement age,5 his or her annual benefit would be $34,332 ($2,861 per month).6 However, very few Americans receive the maximum benefit, as it is rare to have had such consistently high earnings over a lifetime.
Table 1. 2019 Social Security and Medicare Tax Rates and Maximum Taxable Earnings, Maximum Taxes Paid, and Maximum Retirement Benefits
|
FICA and SECA Tax Rates |
FICA |
SECAa |
|
5.30% |
10.60% |
|
|
+ Disability Insuranceb |
0.90% |
1.80% |
|
= Subtotal Social Security (OASDI) tax rate |
6.20% |
12.40% |
|
+ Hospital Insurance tax ratec |
1.45% |
2.90% |
|
Total FICA and SECA Rates |
7.65% |
15.30% |
|
+ Employer contribution |
7.65% |
|
|
Combined Employee and Employer FICA Tax Rates |
15.30% |
|
|
Maximum Taxable Earnings and Taxes Paid |
OASDI |
HI |
|
Social Security Maximum Taxable Earnings |
$132,900 |
no maximum |
|
Employee/Employer (each), Maximum Taxes Paid |
$8,240 |
No limit |
|
Self-employed, Maximum Taxes Paid |
$16,480 |
No limit |
|
Maximum Social Security Benefit |
Monthly |
Annual |
|
Retired at full retirement age (66)d |
$2,861 |
$34,332 |
Source: Social Security Administration (SSA), https://www.ssa.gov/news/press/factsheets/colafacts2019.pdf; and https://www.ssa.gov/oact/progdata/oasdiRates.html.
Notes: FICA = Federal Insurance Contributions Act; SECA = Self Employed Contributions Act; OASDI = Old-Age, Survivors and Disability Insurance; and HI = Hospital Insurance (Medicare Part A).
a. Certain adjustments and income tax deductions apply.
b. The payroll taxes directed to OASI and DI were changed for 2016 to 2018, at 5.015% for OASI and 1.185% for DI, to extend the projected date of DI reserve depletion about six years (P.L. 114-74).
c. Beginning in 2013, individuals with earned income of more than $200,000 ($250,000 for married couples filing jointly) pay an additional 0.9% in Medicare taxes. See Social Security Fact Sheet, 2019, at https://www.ssa.gov/news/press/factsheets/colafacts2019.pdf.
d. Monthly benefits are reduced if a worker claims benefits before his or her full retirement age; a worker receives credits that increase his or her monthly benefits if he or she claims benefits after full retirement age.
Workers with Earnings Above the Taxable Earnings Base
According to the Social Security Administration's (SSA's) statistics, a small share of workers earn above the taxable earnings base each year. In 2016, about 6.5% of workers (11.1 million individuals) earned more than the taxable earnings base (Table 2). Most of the individuals earning above the base were men (8.1 million individuals, or roughly 73.0% of the total). Approximately 9.1% of all male workers and 3.6% of all female workers had earnings above the maximum. Most individuals with earnings above the base were wage and salary workers (roughly 94.5% of the total). Some 6.9% of individuals who earned above the base were self-employed. A relatively small group of workers who earned above the base (156,000 individuals or 1.4% of the total) have earnings in both wage and salary employment and self-employment.7
Table 2. Number and Percentage of Workers with Earnings Above the Taxable Earnings Base of $118,500 by Type of Earnings and Sex, 2016
|
Number of Workersa |
Percentage of Workers with Earnings Above Taxable Earnings Base |
|||||||||
|
Group |
Total |
with Earnings Above the Taxable Earnings Base |
Total Workers with Earnings Above Taxable Earnings Base |
Total Workers with Any Earnings |
||||||
|
All workers |
|
|
|
|
||||||
|
Men |
|
|
|
|
||||||
|
Women |
|
|
|
|
||||||
|
Wage and salary workers |
|
|
|
|
||||||
|
Men |
|
|
|
|
||||||
|
Women |
|
|
|
|
||||||
|
Self-employed |
|
|
|
|
||||||
|
Men |
|
|
|
|
||||||
|
Women |
|
|
|
|
||||||
|
Waged/salaried and self-employed |
|
|
|
|
||||||
Source: Social Security Bulletin, Annual Statistical Supplement, 2018, at https://www.ssa.gov/policy/docs/statcomps/supplement/2018/index.html. The Congressional Research Service (CRS) calculations based on 2016 estimates from tables, 4.B1, 4.B3, 4.B4, 4.B7, and 4.B9.
Notes: Totals do not necessarily equal the sum of rounded components.
a. Workers with earnings in both wage and salary employment and self-employment are counted in each type of employment but only once in the total.
Origin and History of the Taxable Earnings Base
In 1935, the designers of Social Security, President Franklin Roosevelt's Committee on Economic Security, did not recommend a maximum level of taxable earnings in their plan, and the draft bill that President Roosevelt sent to Congress did not include one. The bill emphasized who was to be covered by the system, not how much wages should be taxed. Being in the midst of the Depression, the Administration's attention was on the large number of aged people living in poverty. The committee's goal in proposing a Social Security program was to complement public assistance measures (Old-Age Assistance) in its plan.8 The plan offered immediate cash aid to the aged poor and created an earnings-replacement system intended to lessen the need for welfare benefits in the long run. It was recognized that the new system would not be sufficient to provide full income in retirement, but would provide a "core" benefit as a floor of protection against poverty. Not concerned about high-income retirees, the Administration's proposal exempted nonmanual workers earning $250 or more a month from coverage. Manual workers were to be covered regardless of their earnings, but few had earnings above this level.
It was the Social Security bill reported by the House Ways and Means Committee that clearly established a maximum taxable amount, which the bill set at $3,000 per year, equivalent to 12 months of earnings at the $250 level.9 In addition, the committee dropped the exemption for nonmanual workers with high earnings. The committee's report and floor statements made at the time give no clear record as to the reasoning for the taxable limit, but the elimination of the high-earner exemption would include high-income individuals in the system (increasing income to the system that could be redistributed to low- and middle-income workers) and attain as much program coverage of the workforce as possible. In addition, the Administration's original exemption would be erratic for workers whose earnings fluctuated above and below the $250 monthly threshold.
Although tax policy concerns were raised in later years, with a higher base preferred by those seeking a more proportional tax system, there was little, if any, serious attention given to eliminating the base entirely. In the late 1940s and early 1950s, and to a lesser extent later on, the major arguments concerned the base's size and how it affected the development of Social Security. A larger base meant that more earnings would be credited to a person's Social Security record and would lead to higher benefits (because benefits are based on a worker's contribution into the system via taxes on earnings). Proponents argued that the base needed to be raised to reflect wage or price growth so that the benefits of recipients, in particular moderate and well-to-do recipients, would not erode over time, thereby preserving their support for the system.10 Critics argued that this would increase benefits for people who could save on their own while making saving by private means more difficult.11
Prior to 1974, increases to the taxable earnings bases were specifically legislated on an ad hoc basis. However, a period of large increases to the cost of living (e.g., 5.5% in 1970) led to concerns that such a rise in the cost of living would reduce the purchasing power of Social Security benefits, and that ad hoc increases might be insufficient.12 President Nixon had recommended automatic adjustments to benefits in 1969, but efforts in 1970 and 1971 to incorporate automatic adjustments failed. This changed in 1972, when H.R. 1 (which would eventually become the Social Security Amendments of 1972; P.L. 92-603) gained traction. The bill included a COLA provision, but this provision, along with some others, split off from the main text, and was enacted under P.L. 92-336 instead. P.L. 92-336 included procedures that increased the taxable earnings base automatically as a means of financing COLAs for Social Security recipients, though the adjustment to the taxable earnings base was tied to average wages.13
The Social Security Amendments of 1977 (P.L. 95-216) gradually increased the base beyond what resulted from the automatic-adjustment procedures from 1978 to 1981, such that in 1981, the taxable earnings base was $7,500 higher than the "old-law" base.14 This was done as a means of raising revenue to help shore up the program's ailing financial condition and was intended to achieve a base under which 90% of all covered payroll would be subject to tax (to match the original 1935 act);15 increases to the taxable earnings base after 1981 returned to automatic-adjustments procedures.
Medicare was enacted in 1965, under the Social Security Amendments of 1965 (P.L. 89-97), with the HI portion of the program financed by payroll taxes. The HI tax was first levied in 1966 at a rate of 0.35% (on employee and employer, each) and the maximum taxable amount was set at the same level as Social Security's.16 The HI rate was subsequently raised periodically (reaching its current level of 1.45% in 1986) to meet the financing needs of the program. However, its base continued to be the same as Social Security's through 1990. Then, to reduce federal budget deficits, the Omnibus Budget Reconciliation Act of 1990 (P.L. 101-508) raised the HI base to $125,000. The HI base then rose automatically to $135,000 over the next two years. In 1993, as part of his plan to reduce budget deficits, President Clinton proposed that the HI base be eliminated entirely; with the Omnibus Budget Reconciliation Act of 1993 (P.L. 103-66), the HI base was removed. As there is no maximum taxable earnings amount in Medicare, Medicare financing will not be discussed further in this report.
The Taxable Earnings Base Over Time
The portion of Social Security covered earnings that is subject to the payroll tax has fluctuated over time (Figure 1). When the program began in 1937, taxable earnings represented 92% of covered earnings (Table A-1). By 1965, this ratio had dropped to a low of 71%. Prior to 1972, the taxable earnings base was updated periodically by Congress, which contributed to its dramatic fluctuations in the 1950s and 1960s. Between 1972 and 1977, and since 1982, the base has been indexed to the increase in wages in the economy, which has reduced the volatility somewhat.17
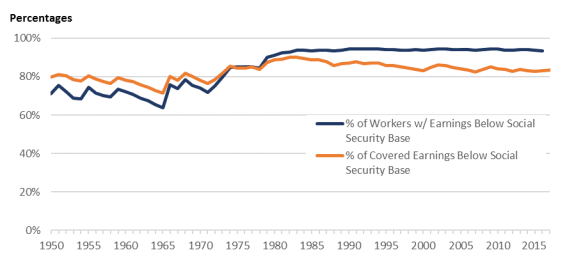
Since the 1980s, the share of covered workers below the taxable earnings base has remained relatively stable at roughly 94%. However, the share of covered earnings that is taxed has fallen from 90% of all earnings in 1982 to 83% in 2000, and it has fluctuated with the business cycle since then (rising during economic recessions and falling during recoveries).18 The large declines in the percentage of covered earnings from the early 1980s to 2000 were mainly due to salaries for top earners growing faster than the pay of workers below the cap, which means top earners had wage growth that was higher than average.19 Because increases in the taxable maximum are based on average wage growth, salaries for top earners increased faster than the taxable maximum. This increasing gap between top earner salaries and the taxable maximum has led to more earnings that are not covered by payroll taxes (because these earnings are above the taxable maximum), and thus a decline in the percentage of aggregate covered earnings that is below the taxable maximum.
The Future of the Taxable Earnings Base
The taxable earnings base is increased annually by the average growth in wages, so the share of the population below the cap is expected to remain relatively stable over time. However, because of increasing earnings inequality, the share of payroll that is taxed is expected to decline even further (see "The Taxable Earnings Base Over Time"). Under the intermediate assumptions in the 2019 Trustees Report, the percentage of covered earnings that is taxable is assumed to decline to 82.5% for 2028,20 and the levels will remain stable thereafter.21
Projections of the Share of the Population Who Have Earned Above the Taxable Earnings Base at Least Once in Their Lifetime
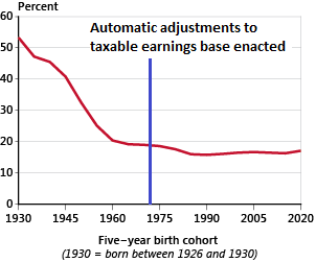
Workers' earnings rise and fall during their careers, so any analysis of the population that earns above the taxable earnings base in a given year is limited in that it may miss individuals who were above the base in previous years or will have earnings above the base in the future. SSA's Office of Research, Evaluation, and Statistics provides some projections as to how many workers are expected to ever earn above the taxable earnings base and provides a distribution of these workers by lifetime shared earnings.
In 2016, about 6% of workers earned more than the taxable earnings base.22 In SSA's taxable earnings base fact sheet, it is projected that almost 20% of current and future covered workers (through birth cohorts born in 2020) will have at least one year of earnings above the taxable earnings base.23 Figure 2 shows how this group of workers is projected to stabilize as a percentage of the population over the next few decades. Note that the figure groups workers by five-year birth cohorts, so the workers in the last several birth cohorts in the graph have not entered the labor market yet.
|
Figure 2. Covered Workers Projected to Earn Above the Taxable |
 |
|
Source: SSA's Office of Research, Evaluation, and Statistics, Population Profiles: Taxable Maximum Earners, https://www.ssa.gov/policy/docs/population-profiles/tax-max-earners.html. Notes: Prior to the automatic adjustments of the taxable earnings base in 1974, the irregular changes to the taxable earnings base, coupled with regular growth in average wages, led to a decline in the real value of the taxable earnings base. A decrease in the real value of the taxable earnings base meant more workers in earlier birth cohorts would have earnings above the taxable earnings base (see the percentage of workers with earnings below Social Security base in Table A-1). With the enactment of automatic adjustments, changes in the real value of the taxable earnings base were minimized, and the number of covered workers earning above the taxable earnings base stabilized. |
Impact of Raising or Eliminating the Taxable Earnings Base
Raising or removing the taxable earnings base could reduce the long-term Social Security deficit (i.e., improve the long-term solvency of the program).24 The full impact of the policy change would depend on whether the wages above the maximum would also be counted toward benefits. Raising or eliminating the taxable earnings base while maintaining the current benefit structure, where benefits are calculated on the full contribution base, would lead to higher monthly Social Security checks for individuals who earned more than the current taxable earnings base during their careers. These higher benefit payments would lead to greater program outlays, although these expenditures would be more than offset by greater tax revenues. Although the solvency impact would be improved to a greater degree if the cap on taxes were eliminated and the cap on benefits were retained, the traditional link between contributions and benefits would be broken.
Rather than eliminate the taxable earnings base, policymakers could set it to cover a constant share of aggregate earnings. As described previously, the portion of Social Security covered earnings subject to the payroll tax has fluctuated since its inception. Larger increases in the earnings of the highest-paid individuals relative to other workers have led to a decline in the share of Social Security covered earnings that is taxed. The proportion of earnings that is taxed is projected to continue to fall. Maintaining a consistent tax base would increase revenue and help to improve the system's solvency. Some have proposed raising the taxable earnings base to consistently tax 90% of aggregate covered earnings, restoring it to roughly the level of coverage in 1982, when Congress last undertook a major reform effort to address Social Security solvency. SSA and the Joint Committee on Taxation (JCT) have also used this benchmark to analyze the impact of raising the base on the Social Security trust funds and the budget.
The following sections examine the impact of raising or eliminating the taxable earnings base on individuals' taxes and benefits, on the Social Security trust funds, on federal revenue, and on workers' and employers' behavior.
Impact on Individuals' Social Security Benefits If the Taxable Earnings Base Were Raised or Eliminated
SSA's Office of Research, Evaluation and Statistics provides projections, using the Modeling Income in the Near Term, Version 7 (MINT7) microsimulation model,25 of the impact of raising or eliminating the taxable earnings base on benefits in 2030, 2050, and 2070.26 The estimates for raising the amount of earnings subject to the payroll tax to 90% of covered earnings are based on a phase in from 2015 to 2024. The estimates for eliminating the taxable earnings base are based on the removal of the taxable earnings base in 2015. Earnings above the current taxable earnings base are included in the benefit computations. SSA also provides the change in benefits among different demographic groups and estimates of the median percentage change of benefits for all beneficiaries and affected beneficiaries.
SSA, however, does not provide projections of the changes in taxes paid by demographic groups. Because of the linking of taxes and benefits in this proposal, the change in benefits provides an idea of how many individuals are paying more taxes, but the values are not identical. Dependents receive higher benefits when a worker pays more in taxes, so beneficiaries with higher benefits might not have paid higher taxes based on their own working records. Retired worker benefits represent three-quarters of the affected beneficiaries; spouse and widow(er) benefits make up around a quarter of the affected beneficiaries.27
Based on the projections, if the taxable earnings base were eliminated and all earnings were subject to the Social Security payroll tax, 6% of all beneficiaries would receive a higher benefit amount in 2030, with a median percentage increase in benefits of 4% for affected beneficiaries. The percentage of beneficiaries affected would be 16% in 2050 and 19% in 2070, and the median percentage change in benefits would be 6% in 2050 and 8% in 2070.28 Phasing in the increase to the taxable earnings base to make 90% of covered earnings subject to the payroll tax leads to a median percentage change in benefits of 2% in 2030, 5% in 2050, and 7% in 2070 for affected beneficiaries.29
The discussion of the impact on beneficiaries by group will use the projections from eliminating the taxable earnings base, to avoid complications with how the change is phased in (because the projections for raising the amount of earnings subject to the payroll tax to 90% are based on a phase in from 2015 to 2024, while the projections for eliminating the taxable earnings base are based on an immediate elimination), coupled with the fact that beneficiaries whose benefits change by less than 1% are not considered affected in the projections.30
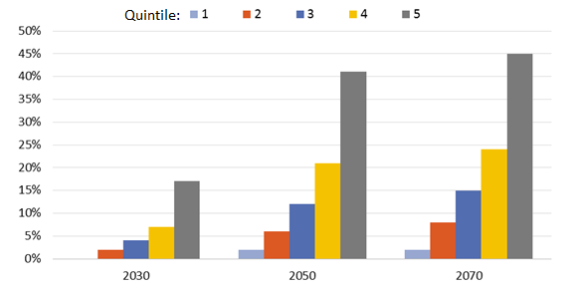
Changes by Income Group
Figure 3 shows that the impact of eliminating the taxable earnings base immediately on future beneficiaries varies significantly by income group (quintiles).31 Few beneficiaries in the lowest quintile would see an increase in benefits in 2030, compared with 17% of beneficiaries in the highest quintile who would gain increased benefits if the taxable earnings base were eliminated. The percentage of beneficiaries affected by eliminating the taxable earnings base more than doubles in 2050. By 2070, almost half of the beneficiaries in the highest quintile would have an increase in benefits if the taxable earnings base was removed.
|
Figure 3. Projected Percentage of Future Beneficiaries Affected by Eliminating the Taxable Earnings Base, by Income Quintile |
 |
|
Source: SSA, Office of Research, Evaluation, and Statistics; Table 1 from https://www.ssa.gov/retirementpolicy/projections/taxation/remove-tax-max-include-2030.html, https://www.ssa.gov/retirementpolicy/projections/taxation/remove-tax-max-include-2050.html, and https://www.ssa.gov/retirementpolicy/projections/taxation/remove-tax-max-include-2070.html. Notes: The projected percentage increase of beneficiaries in the lowest quintile in 2030 shows 0% due to rounding. Income groups are defined using annual family income for the year of the projection, so some low-income beneficiaries are affected by the policy if they earned above the taxable earnings base at any point in their careers. Beneficiaries must receive a greater than 1% difference in benefits in order to be considered affected. |
The SSA analysis suggests that increases in benefit amounts among affected beneficiaries would be similar for the lower four quintiles across the three different projection years, with a median percentage change between 3% and 7%. The changes fluctuate slightly between each projection year, but remain relatively stable. Conversely, the highest quintile would see an increase in median change in benefits, from 5% in 2030 to 13% in 2070.32
Changes by Age
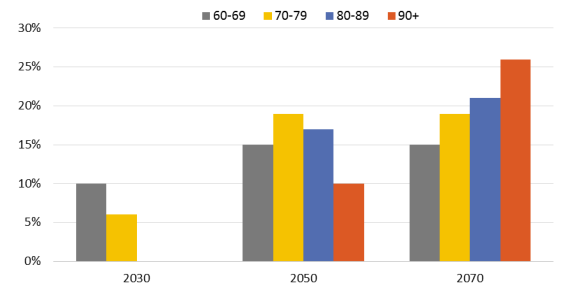
The percentage of future beneficiaries affected, by age, with the elimination of the taxable earnings base is shown in Figure 4. In 2030, very few people aged 80 and older would have higher benefits if the taxable earnings base had been eliminated in 2015. These workers would have been over 65 years old in 2015, and are likely to have retired already. In 2050, the percentage of beneficiaries in the different age groups that have higher benefits would be higher. Similar to 2030, older cohorts would have fewer beneficiaries with higher benefits, although the age cutoff is 90 and older, as opposed to 80. This percentage changes in 2070, in which the largest change in beneficiaries with higher benefits would happen for the older cohorts.
|
Figure 4. Projected Percentage of Future Beneficiaries Affected by Eliminating the Taxable Earnings Base, by Age |
 |
|
Source: SSA, Office of Research, Evaluation, and Statistics; Table 1 from https://www.ssa.gov/retirementpolicy/projections/taxation/remove-tax-max-include-2030.html, https://www.ssa.gov/retirementpolicy/projections/taxation/remove-tax-max-include-2050.html, and https://www.ssa.gov/retirementpolicy/projections/taxation/remove-tax-max-include-2070.html. Notes: The projected percentage increase of beneficiaries in the aged 80-89 group in 2030 shows 0% due to rounding; the projected percentage increase of beneficiaries in the aged 90+ group in 2030 is a true 0%. |
The change in benefit amounts among affected beneficiaries tends to increase in the later years. Older cohorts have a smaller median change in benefit amounts, as they have fewer years of contributing higher taxes. The cohort aged 60-69 in 2050 would not have had the taxable earnings base, and thus would have no cap on benefits, for much of their career, whereas the cohort aged 90+ has only a few years' worth of potential to earn higher benefits. By 2070, all cohorts would have had most or all of their careers without the taxable earnings base, and the median percentage change in benefits would be about 8% for all age cohorts.33
Impact on the Social Security Trust Funds
The 2019 Trustees Report projects that without any changes to current law, the OASDI trust funds would be depleted (i.e., the trust fund will have a balance of zero) in 2035. Under the intermediate assumptions of the 2019 Trustees Report, SSA actuaries calculate that it would take an immediate and permanent 2.70% increase in the payroll tax rate (from 12.40% to 15.10%) to achieve solvency over the next 75 years. The actuaries have estimated the impact on the trust funds of numerous policies related to the taxable earnings base.34 Contributions can be increased by (1) eliminating the taxable earnings base immediately or in a future year, (2) raising the taxable earnings base such that, for example, 90% of earnings are subject to the payroll tax, (3) taxing earnings above the current taxable earnings base at a lower payroll tax rate, or (4) taxing earnings above a certain threshold that is greater than the current-law taxable maximum at the current payroll tax rate. To accommodate changes to the payroll tax, benefits associated with earnings above the current taxable earnings base can be (1) credited the same as the earnings below the current taxable earnings base; (2) still counted toward benefits, but at a reduced rate; or (3) not credited at all.35
Table 3 presents some trust fund solvency outcomes of a few of these proposals, as estimated by SSA's Office of the Chief Actuary: the percentage of the 75-year shortfall eliminated with the proposal and the 75-year shortfall as a percentage of taxable payroll (the percentage that the payroll tax rate would have to be raised for the system to be solvent over the next 75 years). None of the proposals involving a change to the taxable earnings base results in long-term (75-year) solvency. The table focuses on eliminating and raising the taxable earnings base, because these two changes to the contributions include different proposals on how to change the benefits, and illustrates how contributions and benefits interact to affect the long-range shortfall. A brief discussion on the impact of applying a payroll tax above the current taxable earnings base is included below.
Table 3. Impact on the Social Security Trust Funds of Raising or
Eliminating the Social Security Taxable Earnings Base
|
Options |
Percentage of 75-year Shortfall Eliminated |
Remaining 75-year Shortfall as Percentage of Taxable Payroll |
|
|
Current Law based on 2019 Trustees Report |
— |
2.78a |
|
|
Tax all earnings above the current-law taxable maximum: 1. Eliminate taxable earnings base, so all earnings are subject to current payroll tax, with… |
|||
|
1A |
No credit to benefits (retain cap for benefit calculations) |
84% |
0.43 |
|
1B |
Credit to benefits (current benefit formula) |
65% |
0.98 |
|
1C |
Adjusted benefits (new benefit formula)b |
76% |
0.66 |
|
1D |
Phased in 2020-2026 (new benefit formula)c |
78% |
0.60 |
|
1E |
Phased in 2021-2025 (new benefit formula)d |
75% |
0.70 |
|
1F |
Phased in 2022-2031 (new benefit formula)b |
68% |
0.88 |
|
2. Tax earnings above a certain threshold at current payroll tax rate, and tax all earnings once the current-law maximum exceeds that amount, with the threshold equal to… |
|||
|
2A |
$250,000 beginning in 2020 (retain cap for benefit calculations) |
80% |
0.56 |
|
2B |
$400,000 beginning in 2021 (new benefit formula)e |
69% |
0.86 |
|
2C |
$250,000 beginning in 2021 (new benefit formula)e |
77% |
0.65 |
|
2D |
$300,000 beginning in 2021 (new benefit formula)f |
73% |
0.75 |
|
Tax a portion of earnings above the current-law taxable maximum: |
|||
|
3. Increase taxable earnings base so 90% of covered earnings are subject to payroll tax (phased in 2020-2029), with... |
|||
|
3A |
No credit to benefits (retain cap for benefit calculations) |
35% |
1.79 |
|
3B |
Credit to benefits (current benefit formula) |
26% |
2.05 |
|
3C |
Phased in 2021-2026 with adjusted benefits (new benefit formula)g |
34% |
1.82 |
|
3D |
Apply 6.2% tax rate for earnings above the revised taxable maximum, credit to benefits up to revised taxable maximum |
49% |
1.42 |
|
4. Increase the taxable maximum by 2% each year until reach 90% of covered earnings, with... |
|||
|
4A |
No credit to benefits beginning in 2022 (retain cap for benefit calculations) |
27% |
2.02 |
|
4B |
Credit to benefits beginning in 2020 (current benefit formula) |
22% |
2.17 |
|
4C |
Adjusted benefits beginning in 2021 (new benefit formula)h |
23% |
2.15 |
|
4D |
For employee only, while eliminating taxable maximum for employer beginning in 2020 (current benefit formula using revised tax maximum) |
51% |
1.37 |
Source: SSA's Office of the Chief Actuary, Solvency Provisions: Payroll Taxes, https://www.ssa.gov/oact/solvency/provisions/payrolltax_summary.pdf, as retrieved in August 2019.
Notes: Projections based on intermediate assumptions of 2019 Trustees Report. The Trustees Report uses three sets of assumptions to project trust fund solvency to generate a range of possibilities: low cost, intermediate cost, and high cost. The Trustees Report's primary text uses the intermediate (cost) assumptions.
a. In 2019, the Social Security trustees project that the 75-year actuarial deficit for the trust funds is equal to 2.78% of taxable payroll. Stated a different way, the trustees point out that an immediate 2.70-percentage-point increase in the payroll tax rate (from 12.40% to 15.10%) would be needed for the trust funds to remain solvent throughout the 75-year projection period. The necessary tax rate increase of 2.70% differs from the 2.78% actuarial deficit for two reasons. First, the estimated tax increase projects zero trust funds reserves at the end of the projection period whereas the actuarial deficit assumes trust fund reserves equal to one year's cost. Second, the estimated payroll tax increase needed to maintain solvency does not reflect behavioral response changes to tax rate changes.
b. New benefit calculation: add a bend point at current taxable earnings base and apply a formula factor of 3% to AIME above the new bend point. See footnote 35 for a summary on how Social Security benefits are calculated under current law.
c. Calculate benefit credit for earnings above the current-law taxable maximum that are subject to the payroll tax using a secondary PIA formula, which involves (1) an "AIME+" derived from annual earnings from each year after 2019 that were in excess of that year's current-law taxable maximum; (2) a new bend point equal to 134% of the monthly current-law taxable maximum; and (3) formula factors of 3% and 0.25% below and above the new bend point, respectively.
d. Calculate benefit credit for earnings above the current-law taxable maximum that are subject to the payroll tax using a secondary PIA formula, which involves (1) an AIME+ derived from annual earnings from each year after 2020 that were in excess of that year's current-law taxable maximum and (2) a formula factor of 5% on this newly computed AIME+.
e. Calculate benefit credit for earnings above the current-law taxable maximum that are subject to the payroll tax using a secondary PIA formula, which involves (1) an AIME+ derived from annual earnings from each year after 2020 that were in excess of that year's current-law taxable maximum and (2) a formula factor of 2% on this newly computed AIME+.
f. Calculate benefit credit for earnings above the current-law taxable maximum that are subject to the payroll tax using a secondary PIA formula, which involves (1) an AIME+ derived from annual earnings from each year after 2020 that were in excess of that year's current-law taxable maximum and (2) a formula factor of 3% on this newly computed AIME+.
g. Calculate benefit credit for earnings above the current-law taxable maximum that are subject to the payroll tax using a secondary PIA formula, which involves (1) an AIME+ derived from annual earnings that were in excess of that year's current-law taxable maximum and (2) a formula factor of 2.5% on this newly computed AIME+.
h. New benefit calculation: add a bend point at current taxable earnings base and apply a formula factor of 5% to AIME above the new bend point.
Option 1A-1C: Eliminate Taxable Earnings Base Immediately
The Social Security Administration's Office of the Chief Actuary analyzed several proposals that involve eliminating the taxable earnings base immediately, so that all earnings are taxed; these proposals differ based on how benefits are calculated to take into account earnings above the current taxable earnings base. In all of these proposals, the trust fund depletion date is pushed back by at least 30 years. If no credits to benefits are provided for earnings above the current taxable earnings base (i.e., earnings above the current taxable earnings base do not count toward benefits),36 the trust fund becomes depleted a little less than a decade before the long-range 75-year solvency target. The increased revenue would eliminate 84% of the projected shortfall and the program would have a projected shortfall equal to 0.43% of taxable payroll. Under this scenario, the payroll tax rate would need to be increased from 12.40% to 12.83% or other policy changes would have to be made for the system to be solvent for the next 75 years. However, the traditional link between the level of wages that is taxed and the level of wages that counts toward benefits would be broken.
If all wages counted toward benefits as they are now,37 the trust fund would be depleted in 2065; 65% of the projected financial shortfall in the Social Security program would be eliminated. To achieve solvency for the full 75-year projection period, the option would require an increase of 0.98% in total payroll tax rate (from 12.40% to 13.38%) or other policy changes would have to be made to cover the shortfall. Under this scenario, high earners would pay higher taxes but also receive higher benefits, maintaining the traditional link between the tax paid and benefits received. The net benefit to the trust funds is still positive, as $5 in additional revenue would provide only $1 in additional benefits, on average, over their 75-year valuation period. Some annual Social Security benefit payments would be much higher than today's annual maximum (if claimed at full retirement age) of $34,332. To contextualize how benefits are affected by the increase in contributions, authors Reno and Lavery estimate that a worker who paid taxes on earnings of $400,000 each year would get a benefit of approximately $6,000 a month or $72,000 a year, a replacement rate of 18%, whereas someone with lifetime earnings of $1 million a year would get a monthly Social Security benefit of approximately $13,500 a month or $162,000 a year, a replacement rate of 16.2%.38
One possibility to maintain the link between contributions and benefits, but limit the benefits for high earners, is to change the benefit formula. This is generally done by adding a new bend point, with a lower conversion rate for the additional contributions above the current-law taxable earnings base. The proposals scored by SSA that contain a provision with a new benefit formula have projections that are close to halfway between the "no additional benefit" and the "current benefit" proposals. The proposal that changes the benefit computation formula to include a new bend point at the current-law taxable earnings base and applies a formula factor of 3% for AIME above this new bend point extends the year of trust fund depletion to 2070.39 This proposal eliminates 76% of the projected shortfall, and the payroll tax would need to increase from 12.40% to 13.06% or other policy changes would have to be made for the system to be solvent for the next 75 years.
Options 1D-1F: Eliminate Taxable Earnings Base Gradually
Some proposals suggest gradually eliminating the taxable earnings base so full elimination takes place some time between 2025 and 2031. These proposals were usually accompanied with a secondary PIA formula.40 This secondary PIA formula generally involves a new term called AIME+, which is derived from annual earnings in excess of the current-law taxable maximum and a new formula factor between 2% and 5% is set on the newly computed AIME+. Sometimes, a new bend point is created together with this secondary PIA formula. These proposals generally increase the long-term revenue of Social Security trust funds and would eliminate about 68%-78% of the projected 75-year shortfall. The payroll tax rate would need to be increased from the current 12.40% to about 13.00%-13.28%, or other policy changes would have to be made for the system to be solvent for the next 75 years.
Option 2: Taxes on Earnings Above a Certain Threshold Until the Taxable Earnings Base is Eliminated
Several recent proposals suggest applying the current payroll tax rate on earnings above a certain threshold and taxing all earnings once the current-law taxable maximum exceeds that threshold. A secondary PIA formula was also proposed to provide benefit credit for earnings above the current-law taxable maximum, which involves a new item called AIME+ derived from annual earnings from each year in excess of the taxable maximum, and a formula factor of 2%-3% on this AIME+ amount.41 These proposals would have a budgetary effect of eliminating 69%-80% of the projected financial shortfall and requiring an increase of 0.56%-0.86% in the payroll tax, or other policy changes would have to be made to eliminate the shortfall for the next 75 years. Some of these proposals delay the date of trust fund depletion by about 30 years.42
Options 3 and 4: Increase Taxable Earnings Base to Cover 90% of Earnings
Proposals from various organizations to increase the taxable earnings base to cover 90% of earnings generally follow two approaches to phasing in the new taxable earnings base. One option is to phase in the increase over the next 10 years (option 3); the other option is to increase the taxable earnings base by an additional 2% on top of year-to-year indexing, until taxable earnings cover 90% of covered earnings (option 4). The second method is estimated to take around 40 years to cover 90% of earnings.
Most proposals in option 3 (3A-3C) would delay the date of trust fund depletion by fewer than eight years. Phasing in the increase over the next 10 years could cover 26%-35% of the projected long-range shortfall, requiring an increase of 1.79%-2.05% in the payroll tax, or other policy changes would have to be made to eliminate the shortfall for the next 75 years.43 A variation of this option (option 3D) suggested applying the 6.2% tax rate for earnings above the revised taxable maximum (90% of covered earnings), but no credit to benefits above the revised taxable maximum. This proposal could eliminate 49% of the 75-year financial shortfall and the program would have a remaining projected shortfall equal to 1.42% of taxable payroll.
Phasing in the increase by raising the taxable earnings base by an additional 2% a year will cover approximately 22%-27% of the shortfall (Option 4A-4C).44 In these cases, paying higher benefits on the additional covered earnings does little to change the fund depletion date. An alternative option proposed increasing (phased in) the taxable earnings base to 90% of covered earnings only to employees,45 but eliminating taxable maximum for employers. Applying the current benefit formula to the revised taxable maximum for employees, the provision could eliminate 51% of the projected long-range shortfall and the payroll tax rate would need to be increased from 12.40% to about 13.77%, or other policy changes would have to be made for the system to be solvent for the next 75 years.
Taxes for Earnings Above the Taxable Earnings Base
SSA scored several proposals that apply a new lower payroll tax rate to earnings above the taxable earnings base.46 This is similar to eliminating the taxable earnings base, but reducing the payroll tax rate workers have to pay on those higher earnings. Proposals generally have tax rates between 2% and 6%, with some proposals allowing for the higher tax rates to be phased in over the course of a few years. Even though most of these proposals do not include higher benefits, the only proposals that cover more than 40% of the shortfall have payroll tax rates of 6% on earnings above the taxable maximum.47
A group of proposals that would tax a portion of earnings above the current taxable maximum are characterized as setting a wage-indexed equivalent threshold.48 The earnings above the threshold would be taxed at a lower payroll tax rate, such as 2%, and the benefits for additional earnings taxed could be either not credited or proportionally credited based on the payroll tax rate on the additional earnings divided by the original 12.4% payroll tax rate. These proposals generally had little effect on the trust fund's long-range financial solvency. Based on the estimates from SSA, none of these proposals could eliminate more than 10% of the long-range 75-year shortfall.
Impact on Federal Revenue
Raising the taxable earnings base would lead to an increase in total federal revenues. JCT and the Congressional Budget Office (CBO) estimated that raising the wage base to cover 90% of earnings to $245,000 in 2017 would generate $273.1 billion in additional revenue over the 5-year budget window (2017-2021) and more than $648 billion over the 10-year window (2022-2026).49 The change in revenues would consist of an increase in receipts from Social Security payroll taxes, which would be off-budget, offset in part by a reduction in individual income tax revenues, which would be on-budget.50 The reduction in income tax revenue is due to the decrease in after-tax take-home pay leading to fewer hours worked and a substitution to (payroll) tax-exempt fringe benefits in lieu of wages. Outlays, via additional payments of Social Security benefits, would total about $15 billion over the 10-year period, and would be classified as off-budget.
Table 4. Effect on the Deficit: Increasing the Maximum Taxable Earnings for the Social Security Payroll Tax to $245,000, Cover 90% of Aggregate Covered Earnings
(in billions of dollars)
|
Total |
||||||||||||
|
2017 |
2018 |
2019 |
2020 |
2021 |
2022 |
2023 |
2024 |
2025 |
2026 |
2017-2021 |
2017-2026 |
|
|
Change in outlays |
0.1 |
0.2 |
0.5 |
0.7 |
1.1 |
1.5 |
1.9 |
2.5 |
3.1 |
3.8 |
2.6 |
15.4 |
|
Change in revenues |
18.6 |
60.1 |
62.5 |
64.7 |
67.3 |
70.1 |
72.4 |
75 |
77.7 |
80.2 |
273.1 |
648.4 |
|
Change in the deficit |
-18.5 |
-59.9 |
-62 |
-64 |
-66.2 |
-68.6 |
-70.5 |
-72.5 |
-74.6 |
-76.4 |
-270.5 |
-633 |
Source: Staff of the Joint Committee on Taxation (JCT); Congressional Budget Office (CBO). https://www.cbo.gov/sites/default/files/114th-congress-2015-2016/reports/52142-budgetoptions.pdf.
Note: Based on option taking effect in January 2017.
Impact on Workers' and Employers' Behavior
The reaction of high-earning workers and their employers to raising or removing the taxable earnings base is unknown. Behavioral changes were not taken into consideration in the above estimates of the distributional and trust fund impacts, and only partially accounted for in the revenue analysis.
Workers who earn more than the taxable maximum would have a reduced incentive to work, because workers pay more in taxes than they expect to receive in lifetime Social Security benefits and this effectively reduces the return to work.51 However, the degree to which the work effort will be reduced is a matter of debate; each worker would face a different choice between the reduced earnings and the additional leisure time, based on the worker's individual preferences.52 Workers earning above the current base would also have an incentive to change the form of their compensation (e.g., from earnings to fringe benefits) to avoid paying additional payroll taxes.53
The impact of raising the base on employers of high-income earners is also unknown. Employers contribute 6.2% of workers' wages up to the taxable earnings base toward Social Security. If employers are unable to pass along the higher tax costs to workers in the form of reduced earnings, their overall labor costs will increase. Employers may react by raising prices to consumers; reducing other nonwage forms of compensation, such as health benefits or pensions; or reducing the number of workers.
Arguments For and Against Raising or Eliminating the Base
Some arguments for and against changing the Social Security taxable earnings base follow.
Arguments For
The major critique about the Social Security base is that it creates a regressive tax structure above maximum taxable earnings. Workers earning less than the base have a greater proportion of earnings taxed than workers whose earnings exceed it.54 In 2019, someone with annual earnings of $50,000 pays $3,100 in Social Security taxes, or 6.2% of his or her earnings (ignoring the employer share of the tax). However, because the tax is levied on only the first $132,900 in earnings, someone earning $200,000 a year pays $8,240, or 4.1% of his or her earnings.
Supporters of changing the wage base point out that only 6% of workers have earnings above the base in any given year. However, because of rising earnings inequality, the proportion of covered earnings that escapes Social Security payroll taxation has risen from 12% to 17% since 1991 (see Table A-1). They therefore contend that the current Social Security payroll tax structure favors a small group of the higher-earning workers in society.
Supporters argue that subjecting a larger percentage of earnings to the payroll tax would also adjust for the higher life expectancies of high earners.55 On average, people with more education and higher earnings live longer than those with less education and lower earnings, and this difference has been growing over time.56 The impact on the Social Security program is that higher-earning individuals receive benefits for more years over their lifetimes, making the system less progressive.57 Supporters claim that raising the taxable earnings base would make a reasonable adjustment for the faster-than-average life expectancy gains among high earners.
Among supporters of changing the current base, there is disagreement regarding how high the base should be raised or if other changes should be made to tax income above the base. Several proposals would not eliminate the base entirely but raise it to cover 90% of taxable wages, restoring the level that was set in the 1977 amendments to the Social Security Act. Other options would be to remove the taxable maximum, but lower the tax rate on those higher earnings or tax employers and employees at different rates above the current base (see various proposals in Table 3). Others have called for broadening the sources of income that are taxed beyond earnings.58 Proponents of these ideas argue that they would close a significant portion of Social Security's long-range deficit without subjecting upper-middle-income individuals to sizeable increases in their marginal tax rates.
Arguments Against
Those who support keeping the base as it is point out that although the structure of the payroll tax may be regressive above the taxable maximum, it might be partially offset by the progressive calculation of benefits.59
Supporters further maintain that its critics fail to take into account the effect of other tax and transfer programs targeted to low earners. They point out that mitigating the Social Security tax bite was part of the motivation for creating the earned income tax credit (EITC), which provides an income tax credit on earnings up to $55,952 in 2019 for married workers with three or more children (up to $21,370 for married workers without children).60 They also point out that low-income families receive a greater share of government transfer payments that are not subject to Social Security payroll taxes. They argue that the combination of these factors mitigates the flat-rate nature of the tax at lower earnings levels, and that for most other workers the tax is proportional (because it is flat rate). It is only at the upper end of the income spectrum that it takes on a regressive appearance.61
Critics also argue that raising the cap will serve as a disincentive to work and could serve as a drain on the economy.62 Because additional work effort would cause lifetime payroll taxes to increase by more than lifetime Social Security benefits, opponents claim that workers faced with lower marginal rewards for work would either reduce their hours or avoid the tax by changing the form of their compensation.
There are additional arguments against eliminating the taxable earnings base. For example, maintaining a base makes Social Security seem less like ordinary income taxation. Another argument is that high earners would pay more payroll taxes and receive more benefits after removing the base, but the larger benefits that high earners would receive would represent a poor return for the higher taxes they would pay. Some question the wisdom of paying large benefits to higher-income people, arguing that the purpose of the program is to provide a floor of protection for retirement, not large benefits for those who can save on their own. These people contend that eliminating the base would raise public cynicism about a publicly financed system that pays enormous benefits to people who already are well off.
Appendix. Taxable Earnings Bases: Detailed Table
|
Tax Rates |
Maximum Taxable Earnings |
Percentage of |
|||||
|
Year |
Social Securitya |
HIa |
Self-employed (Social Security and HI combined) |
Social Security |
HI |
Workers with Earnings Below Social Security Base |
Covered Earnings Below Social Security Base |
|
1937 |
1.000 |
— |
— |
$3,000 |
— |
96.9 |
92.0 |
|
1940 |
1.000 |
— |
— |
3,000 |
— |
96.6 |
92.4 |
|
1945 |
1.000 |
— |
— |
3,000 |
— |
86.3 |
87.9 |
|
1950 |
1.500 |
— |
— |
3,000 |
— |
71.1 |
79.7 |
|
1951 |
1.500 |
— |
2.25 |
3,600 |
— |
75.5 |
81.1 |
|
1952 |
1.500 |
— |
2.25 |
3,600 |
— |
72.1 |
80.5 |
|
1953 |
1.500 |
— |
2.25 |
3,600 |
— |
68.8 |
78.5 |
|
1954 |
2.000 |
— |
3.0 |
3,600 |
— |
68.4 |
77.7 |
|
1955 |
2.000 |
— |
3.0 |
4,200 |
— |
74.4 |
80.3 |
|
1956 |
2.000 |
— |
3.0 |
4,200 |
— |
71.6 |
78.8 |
|
1957 |
2.250 |
— |
3.375 |
4,200 |
— |
70.1 |
77.5 |
|
1958 |
2.250 |
— |
3.375 |
4,200 |
— |
69.4 |
76.4 |
|
1959 |
2.500 |
— |
3.75 |
4,800 |
— |
73.3 |
79.3 |
|
1960 |
3.000 |
— |
4.5 |
4,800 |
— |
72.0 |
78.1 |
|
1961 |
3.000 |
— |
4.5 |
4,800 |
— |
70.8 |
77.4 |
|
1962 |
3.125 |
— |
4.7 |
4,800 |
— |
68.8 |
75.8 |
|
1963 |
3.625 |
— |
5.4 |
4,800 |
— |
67.5 |
74.6 |
|
1964 |
3.625 |
— |
5.4 |
4,800 |
— |
65.5 |
72.8 |
|
1965 |
3.625 |
— |
5.4 |
4,800 |
— |
63.9 |
71.3 |
|
1966 |
3.850 |
0.35 |
6.15 |
6,600 |
6,600 |
75.8 |
80.0 |
|
1967 |
3.900 |
0.5 |
6.4 |
6,600 |
6,600 |
73.6 |
78.1 |
|
1968 |
3.800 |
0.6 |
6.4 |
7,800 |
7,800 |
78.6 |
81.7 |
|
1969 |
4.200 |
0.6 |
6.9 |
7,800 |
7,800 |
75.5 |
80.1 |
|
1970 |
4.200 |
0.6 |
6.9 |
7,800 |
7,800 |
74.0 |
78.2 |
|
1971 |
4.600 |
0.6 |
7.5 |
7,800 |
7,800 |
71.7 |
76.3 |
|
1972 |
4.600 |
0.6 |
7.5 |
9,000 |
9,000 |
75.0 |
78.3 |
|
1973 |
4.850 |
1.0 |
8.0 |
10,800 |
10,800 |
79.7 |
81.8 |
|
1974 |
4.950 |
0.9 |
7.9 |
13,200 |
13,200 |
84.9 |
85.3 |
|
1975 |
4.950 |
0.9 |
7.9 |
14,100 |
14,100 |
84.9 |
84.4 |
|
1976 |
4.950 |
0.9 |
7.9 |
15,300 |
15,300 |
85.1 |
84.3 |
|
1977 |
4.950 |
0.9 |
7.9 |
16,500 |
16,500 |
85.2 |
85.0 |
|
1978 |
5.050 |
1.0 |
8.1 |
17,700 |
17,700 |
84.6 |
83.8 |
|
1979 |
5.080 |
1.05 |
8.1 |
22,900 |
22,900 |
90.0 |
87.3 |
|
1980 |
5.080 |
1.05 |
8.1 |
25,900 |
25,900 |
91.2 |
88.9 |
|
1981 |
5.350 |
1.3 |
9.3 |
29,700 |
29,700 |
92.4 |
89.2 |
|
1982 |
5.400 |
1.3 |
9.35 |
32,400 |
32,400 |
92.9 |
90.0 |
|
1983 |
5.400 |
1.3 |
9.35 |
35,700 |
35,700 |
93.7 |
90.0 |
|
1984 |
5.700 |
1.3 |
14.0 |
37,800 |
37,800 |
93.6 |
89.3 |
|
1985 |
5.700 |
1.35 |
14.1 |
39,600 |
39,600 |
93.5 |
88.9 |
|
1986 |
5.700 |
1.45 |
14.3 |
42,000 |
42,000 |
93.8 |
88.6 |
|
1987 |
5.700 |
1.45 |
14.3 |
43,800 |
43,800 |
93.9 |
87.6 |
|
1988 |
6.060 |
1.45 |
15.02 |
45,000 |
45,000 |
93.5 |
85.8 |
|
1989 |
6.060 |
1.45 |
15.02 |
48,000 |
48,000 |
93.8 |
86.8 |
|
1990 |
6.200 |
1.45 |
15.3 |
51,300 |
51,300 |
94.3 |
87.2 |
|
1991 |
6.200 |
1.45 |
15.3 |
53,400 |
125,000 |
94.4 |
87.8 |
|
1992 |
6.200 |
1.45 |
15.3 |
55,500 |
130,200 |
94.3 |
86.8 |
|
1993 |
6.200 |
1.45 |
15.3 |
57,600 |
135,000 |
94.4 |
87.2 |
|
1994 |
6.200 |
1.45 |
15.3 |
60,600 |
94.6 |
87.1 |
|
|
1995 |
6.200 |
1.45 |
15.3 |
61,200 |
94.2 |
85.8 |
|
|
1996 |
6.200 |
1.45 |
15.3 |
62,700 |
93.9 |
85.7 |
|
|
1997 |
6.200 |
1.45 |
15.3 |
65,400 |
93.8 |
85.1 |
|
|
1998 |
6.200 |
1.45 |
15.3 |
68,400 |
93.7 |
84.5 |
|
|
1999 |
6.200 |
1.45 |
15.3 |
72,600 |
93.9 |
83.9 |
|
|
2000 |
6.200 |
1.45 |
15.3 |
76,200 |
93.8 |
83.2 |
|
|
2001 |
6.200 |
1.45 |
15.3 |
80,400 |
94.0 |
84.7 |
|
|
2002 |
6.200 |
1.45 |
15.3 |
84,900 |
94.6 |
86.1 |
|
|
2003 |
6.200 |
1.45 |
15.3 |
87,000 |
94.5 |
85.9 |
|
|
2004 |
6.200 |
1.45 |
15.3 |
87,900 |
94.1 |
84.8 |
|
|
2005 |
6.200 |
1.45 |
15.3 |
90,000 |
93.9 |
84.1 |
|
|
2006 |
6.200 |
1.45 |
15.3 |
94,200 |
94.0 |
83.4 |
|
|
2007 |
6.200 |
1.45 |
15.3 |
97,500 |
93.9 |
82.6 |
|
|
2008 |
6.200 |
1.45 |
15.3 |
102,000 |
94.0 |
83.6 |
|
|
2009 |
6.200 |
1.45 |
15.3 |
106,800 |
94.5 |
85.2 |
|
|
2010 |
6.200 |
1.45 |
15.3 |
106,800 |
94.3 |
84.1 |
|
|
2011 |
6.200 |
1.45 |
15.3 |
106,800 |
93.8 |
83.6 |
|
|
2012 |
6.200 |
1.45 |
15.3 |
110,100 |
93.9 |
82.8 |
|
|
2013 |
6.200 |
1.45 |
15.3 |
113,700 |
94.0 |
83.6 |
|
|
2014 |
6.200 |
1.45 |
15.3 |
117,000 |
94.0c |
83.2c |
|
|
2015 |
6.200 |
1.45 |
15.3 |
118,500 |
93.7c |
82.9c |
|
|
2016 |
6.200 |
1.45 |
15.3 |
118,500 |
93.5c |
83.1c |
|
|
2017 |
6.200 |
1.45 |
15.3 |
127,200 |
— |
83.4c |
|
|
2018 |
6.200 |
1.45 |
15.3 |
128,400 |
— |
— |
|
|
2019 |
6.200 |
1.45 |
15.3 |
132,900 |
|||
Source: Tables 2.A3 and 4.B1, Social Security Bulletin, Annual Statistical Supplement, 2018, at http://www.ssa.gov/policy/docs/statcomps/supplement/2018.
Notes: The original Social Security Act only included Old Age Insurance (OAI), coverage expanded to cover dependents and survivors in 1940 (Old Age and Survivors Insurance, or OASI), and Disability Insurance (DI) was created in 1957, leading to the combined Old Age, Survivors, and Disability Insurance (OASDI).
a. Same for employer except 1984—employees received 0.3% credit (not reflected above). Various credits also applied to self-employed (not reflected above) for 1984-1989 period.
b. Upper limit on earnings subject to Hospital Insurance (HI) taxes was repealed by Omnibus Budget Reconciliation Act (OBRA) 1993.