Background
The Transportation Investments Generating Economic Recovery (TIGER) grant program is a discretionary program providing grants to projects of national, regional, or metropolitan-area significance in various surface transportation modes on a competitive basis, with recipients selected by the federal Department of Transportation (DOT).1 It originated in the American Recovery and Reinvestment Act (ARRA; P.L. 111-5), where it was called "national infrastructure investment" (as it has been in subsequent appropriations acts). Beginning with the FY2018 round of grants, DOT renamed the program the Better Utilizing Investments to Leverage Development (BUILD) program.
Unless otherwise noted, all dollar amounts in this report are expressed in 2019 dollars to adjust for inflation over the life of the program, and all percentages are calculated on that basis. These figures therefore do not correspond to DOT data, which in general are not adjusted for inflation.
The Origin of the Program
The TIGER program began in the depths of the 2007-2009 recession as a way to both improve transportation infrastructure and stimulate economic activity. For much of its existence it was virtually the only significant discretionary surface transportation grant program, and virtually the only program that allowed local communities to apply for and receive highway funding directly from the federal government rather than through their state's department of transportation, which might have different priorities than the community.
One of President Obama's first acts after taking office in January 2009 was to propose an economic stimulus bill. Congress passed ARRA after roughly a month of intense debate. The bill provided over $700 billion to stimulate the economy, mostly through reductions in taxes. It authorized $43 billion for transportation infrastructure, including $1.5 billion for a discretionary grant program to make capital investments in surface transportation infrastructure, which Congress labeled "national infrastructure investment." In implementing this new program, DOT retitled it Transportation Investments Generating Economic Recovery, although the annual DOT appropriations act continues to refer to it as national infrastructure investment.
The program initially had two goals: to make investments that would improve the condition of the nation's surface transportation infrastructure, and to do so quickly to provide immediate stimulus to the economy. Thus ARRA required DOT to give priority to projects that were expected to be completed by February 17, 2012, three years after the legislation was enacted. Since it took nearly a year for DOT to set up an office to manage the program, solicit applications, review them, and select which projects to award, the process favored projects that could be completed within two years. The initial awards were announced on February 17, 2010.
In that first round, DOT received 1,497 applications requesting $72.5 billion. It awarded 51 grants totaling $1.69 billion. See Table 3 for details about annual applications and awards.
Unless otherwise noted, all dollar amounts in this report are expressed in 2019 dollars to adjust for inflation over the life of the program, and all percentages are calculated on that basis. These figures therefore do not correspond to DOT data, which in general are not adjusted for inflation.
After Earmarks Ended
During the early 2000s, transportation authorization and appropriations bills included growing numbers of earmarks directing discretionary grants to specific projects. In response to criticism of this practice, in 2011 the Republican conferences in both the House and the Senate prohibited Members from requesting earmarks. In his State of the Union Address on January 25, 2011, President Obama vowed to veto any legislation containing earmarks.2
In the 2012 surface transportation reauthorization legislation, the Moving Ahead for Progress in the 21st Century Act (MAP-21; P.L. 112-141), Congress reduced opportunities for earmarking by abolishing most of DOT's discretionary grant programs, providing virtually all federal surface transportation funding to recipients based on formulas. The TIGER grant program, which has been funded in the annual DOT appropriations acts and was not included in MAP-21, became one of the few remaining discretionary transportation grant programs.
The Obama Administration did not support continuing the program in its FY2010 and FY2011 budgets, but requested funding in FY2012 and following years. A pattern emerged in which the Republican majority in the House of Representatives proposed cutting funding or eliminating it altogether, the Senate supported the program, and the program ultimately received funding in each year's appropriations legislation. Since the Democratic Party regained the House majority in the 2018 midterm election, the House has supported sizable increases in the program3 (Table 1).
|
Budget Request |
House |
Senate |
Enacted |
|
|
2009 |
NA |
NA |
$5,500 |
$1,500 |
|
2010 |
0 |
0 |
1,100 |
600 |
|
2011 |
0 |
400 |
800 |
527 |
|
2012 |
2,000 |
—a |
550 |
500 |
|
2013 |
$500 |
$0 |
500 |
474 |
|
2014 |
500 |
0 |
550 |
600 |
|
2015 |
1,250 |
100 |
550 |
500 |
|
2016 |
1,250 |
100 |
500 |
500 |
|
2017 |
1,250 |
450 |
525 |
500 |
|
2018 |
0 |
0b |
550c |
1,500 |
|
2019 |
0 |
750 |
1,000 |
900 |
|
2020 |
1,000 |
1,000 |
NA |
NA |
Source: Committee reports accompanying Departments of Transportation, Housing and Urban Development, and Related Agencies appropriations acts, various years.
Notes: NA = not available.
a. The House did not pass a separate DOT appropriations act in FY2012.
b. Recommended by House Appropriations Committee.
c. Recommended by Senate Appropriations Committee.
Evolution of the Program's Grant Criteria
Since Congress has continued the TIGER/BUILD program on an annual basis, the annual DOT appropriations act gives Congress the opportunity to adjust the criteria for the program each year. Some criteria, such as a requirement that DOT must ensure an equitable distribution of grant funds geographically and between urban and rural areas, have been the same since the first year. Other criteria, such as the minimum and maximum grant size, have changed frequently. In general, the trend has been toward distributing the funding to a larger number of grantees (through such measures as lowering the maximum grant size). Table A-1 summarizes the changes in many of the program's grant criteria over the past decade.
Merit Criteria: Considerations Beyond Economic Stimulus
Born in the anxious days of early 2009, when there was genuine concern about the state of the U.S. economy, the initial focus of the TIGER/BUILD grant program was twofold: to make grants to surface transportation projects that would improve the nation's transportation infrastructure and that would be able to spend the money quickly in order to stimulate the economy. Other considerations included the likelihood of on-time completion and the benefits of the project compared to the costs.
In subsequent years, as the economy began to recover, DOT added additional merit criteria to its project selection, as shown in Table 2.These criteria were determined administratively, and have not been specified in appropriations legislation providing funds for the program.
|
Merit Criteria |
Definition |
Fiscal Year Added |
|
Livability/Quality of Life |
a project's contribution to increasing transportation choices for individuals, expanding access to essential services, and improving citizens' access to jobs, health care, and other critical destinations |
2011 |
|
Economic Competitiveness |
a project's contribution to improving the efficiency of the movement of goods and people |
2011 |
|
Safety |
a project's ability to contribute to improving the safety of transporting goods and people |
2011 |
|
State of Good Repair |
a project's contribution to maintaining or addressing current needs for the transportation system's state of good repair |
2011 |
|
Environmental Sustainability/ Protection |
a project's contribution to improving energy efficiency, reducing dependence on oil, reducing congestion-related emissions, improving water quality, and otherwise offering environmental benefits |
2011 |
|
Innovation |
a project's use of innovative technologies, innovative project delivery, or innovative financing |
2011 |
|
Partnership |
the extent to which a project shows strong collaboration among a broad range of stakeholders, such as state and local governments, other public entities, and private or nonprofit entities |
2011 |
|
Additional Non-Federal Revenue |
the extent to which a project includes new nonfederal revenue for transportation infrastructure investment |
2018 |
Source: U.S. Department of Transportation, Office of the Secretary, "Notice of Funding Availability/Opportunity for the Department of Transportation's National Infrastructure Investments" published in the Federal Register, various years.
Some of these criteria can conflict with each other in specific instances. For example, a project could reduce congestion-related emissions on a roadway by supporting alternatives (e.g., transit improvements) or by altering the roadway to reduce congestion (e.g., adding lanes, adjusting traffic signal timing, reshaping intersections). The first option might also reduce dependence on oil, whereas the second might increase dependence on oil while reducing emissions and improving the efficiency of the movement of goods and people. How DOT reconciles such conflicts has not been disclosed.
Program Issues
Demand and Supply in Program Funding
Beginning with the first round of awards in FY2009, each annual grant announcement has noted that the amount of funding applied for has greatly exceeded the amount of funding available through the program (see Table 3). After the relatively large first-year appropriation, in succeeding years the amount provided was around one-third of the first year of funding. The total amount applied for also dropped significantly after the first year. The reasons for the decline in funding may include the opposition of the House of Representatives to funding the program (see Table 1), the general limitations on the amounts provided in appropriations bills, and the competition for that funding among the proponents and constituencies of different programs.
One possible reason for the dramatic decline in the amount applied for from FY2016 to FY2017 was the reduction in the maximum grant size that Congress decreed for FY2017 (and succeeding years), from a maximum of $100 million in FY2016 to $25 million in FY2017. Of the $9.8 billion applied for in FY2016, $3.8 billion was represented by a total of 87 applications that exceeded $25 million (nominal) and thus exceeded the maximum limit for FY2017. The combination of that lowered cap on grant amounts, combined with the introduction of several new discretionary transportation grant programs beginning in FY2017, may explain part of the decline in the amount applied for in FY2017. The amount applied for rose in FY2018, when the amount of funding available tripled.
Table 3. Ratio of TIGER/BUILD Funding Applied For and Awarded, FY2009-2018
(in millions of constant 2019 dollars)
|
Fiscal Year |
Amount Applied For |
Amount Awarded |
Ratio of Request/Award |
|
2009 |
$72,473 |
$1,690 |
43 |
|
2010 |
26,244 |
642 |
41 |
|
2011 |
15,402 |
559 |
28 |
|
2012 |
11,147 |
526 |
21 |
|
2013 |
9,752 |
493 |
20 |
|
2014 |
9,028 |
619 |
15 |
|
2015 |
10,628 |
511 |
21 |
|
2016 |
9,837 |
512 |
19 |
|
2017 |
6,406 |
499 |
13 |
|
2018 |
11,145 |
1,505 |
7 |
|
Total |
182,063 |
7,557 |
24 |
Source: CRS, based on data from the Department of Transportation.
Notes: Figures were inflated to 2019 dollars using the Direct Capital Nondefense Composite Outlay Deflator column (column P) from Table 10.1, "Gross Domestic Product and Deflators Used in the Historical Tables: 1940 – 2024," published in the Office of Management and Budget, President's Budget for Fiscal Year 2020, Historical Tables volume (https://www.whitehouse.gov/omb/historical-tables/).
Since applicants are required to submit new applications each year, the "amount requested" may include repeated applications for the same projects, and thus may overcount the total amount requested for projects.
Congressional Directives for Distribution of Grants
Geographic Distribution
One of the directives Congress gave DOT regarding the distribution of TIGER/BUILD grants was that DOT "shall ensure an equitable geographic distribution." Beyond using the term "equitable," the only other legislative guidance on this point is the limitation on the amount of the program funding that can be awarded to projects in a single state. That limit ranged from a high of 25% to a single state during the FY2010-FY2015 rounds to a low of 10% during the FY2017-FY2019 rounds.
There have been a total of 553 grants4 awarded over the period FY2009-FY2018. Every state and most territories have received at least one grant; America Samoa and the Northern Marianas Islands have not received a grant.5 California has received the most funding, 6.9% of the total over that period; that is considerably less than California's share of the total U.S. population (12.1%). Of the top 10 states by share of grant funding received, Texas, New York, Pennsylvania, and Florida also received smaller shares of funding than their shares of the nation's population, while Illinois, Washington, Massachusetts, and Missouri received larger shares of funding than their shares of the population (see Table 4).
It would be difficult for DOT to match the funding awarded to each state's share of the nation's population, since projects are not distributed proportionally among the states on the bases of cost, merit, and number.
|
State |
Share of Total Grant Funding Awarded |
Share of US Population (2014) |
|
California |
6.9% |
12.1% |
|
Illinois |
5.0% |
4.0% |
|
Texas |
4.5% |
8.5% |
|
New York |
4.5% |
6.2% |
|
Washington |
3.9% |
2.2% |
|
Pennsylvania |
3.1% |
4.0% |
|
North Carolina |
3.0% |
3.1% |
|
Florida |
2.8% |
6.2% |
|
Massachusetts |
2.6% |
2.1% |
|
Missouri |
2.5% |
1.9% |
Source: CRS; population data from U.S. Bureau of the Census; funding data calculated from data provided by the U.S. Department of Transportation.
Notes: Population shares are based on 2014 population estimates, used as being roughly the midpoint of the FY2009-FY2018 period. Share of total funding calculated after every grant was converted to constant 2019 dollars.
Urban and Rural Area Grants
Another congressional directive, in place since the second year of the program, is that DOT "shall ensure an appropriate balance in addressing the needs of urban and rural areas." DOT has responded to this directive in different ways over time.
FY2009-FY2016
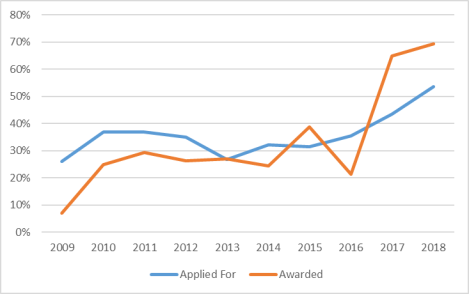
In the first year (FY2009) of the program, 7% of the funding went to projects in rural areas. Since then, Congress has directed that a specific minimum share of the grant funding go to projects located in rural areas. That share has typically been around 20% to 30% (see Table 5 and Figure 1).
The definition of rural and urban areas used by the TIGER/BUILD Grant program has varied from that used by the U.S. Census Bureau. The Census Bureau defines urban areas as both
Urbanized Areas of 50,000 or more people;
Urban Clusters of at least 2,500 and less than 50,000 people.
Rural areas are defined as those areas not included within an urban area.
By this definition, 81% of the U.S. population lived in urban areas and 19% in rural areas over the 2011-2015 period.6
For most of its history, the TIGER/BUILD program has defined urban areas as areas located in an Urbanized Area, and rural areas as everything else. Urban Clusters as defined by the Census Bureau were thus considered rural areas for purposes of the program.7 By this definition, roughly 70% of the U.S. population lived in urban areas and 30% in rural areas in 2015.8 During the period FY2009-FY2016, the proportion of TIGER/BUILD grant funding awarded to projects in rural areas as defined by the program, measured in 2019 dollars, was around 21%.9
|
Fiscal Year |
Share of Funding Requested for Projects in Rural Areas |
Share of Funding Awarded to Projects in Rural Areas |
|
2009 |
26% |
7% |
|
2011 |
37% |
25% |
|
2012 |
37% |
29% |
|
2013 |
35% |
26% |
|
2014 |
27% |
24% |
|
2015 |
32% |
39% |
|
2016 |
35% |
21% |
|
2017 |
44% |
65% |
|
2018 |
54% |
69% |
|
Total |
31% |
34% |
Source: CRS, based on data provided by the U.S. Department of Transportation.
Notes: In 2009 and 2010, roughly 10% of the applications were for projects that DOT categorized as "urban/rural." For purposes of this table, half of the funding for those applications was applied to the rural category for 2009 and 2010. In assessing the total rural share, each year's requests and awards were converted to constant 2019 dollars.
|
Figure 1. Annual Share of TIGER/BUILD Funding for Projects in Rural Areas |
 |
|
Source: CRS, based on data provided by the U.S. Department of Transportation |
FY2017-FY2018
In the program's 2017 Notice of Funding Opportunity (NOFO), the new Trump Administration announced that it would give special consideration to projects in rural areas.10 No rationale for this special consideration has been given, but one is implied in the observation that "While only 19 percent of the nation's population lives in rural areas, 51 percent of all traffic fatalities occurred on rural roads (2014)."11
In announcing the FY2017 round of awards, the Secretary of Transportation noted that "an effort was made to re-balance the under-investment in rural communities—to address overlooked needs."12 This assertion that there had been under-investment in the transportation needs of rural communities was reiterated in the FY2018 NOFO; that assertion is not included in the FY2019 NOFO, but that document reiterates that special consideration will be given to project applications from rural areas.
Under this new policy, the proportion of program funding requested for rural areas rose from 35% in the FY2016 round to 44% in the FY2017 round, and the share of program funding awarded to rural areas rose from 21% to 65% (see Table 5). Another factor that may have influenced this shift is that although the amount of grant funding available in the FY2017 round ($500 million) was the same as in the previous couple of rounds, the number of applications and amount of funding applied for dropped significantly in FY2017, particularly from urban areas (see Table 6). Why that happened is not clear. The current surface transportation authorization act (MAP-21), which was enacted in December 2015, created several new discretionary grant programs for surface transportation; that, combined with the new lowered cap of $25 million on maximum TIGER/BUILD grant sizes that took effect in FY2017, may have led sponsors of more expensive projects, which are often located in urban areas, to seek funding from the new grant programs rather than from the TIGER/BUILD program.
|
Fiscal Year |
Amount of Funding Available |
Amount of Funding Applied For |
||
|
Rural |
Urban |
Total |
||
|
2015 |
$500 |
$3,178 |
$6,897 |
$10,075 |
|
2016 |
500 |
3,304 |
6,009 |
9,313 |
|
2017 |
500 |
2,677 |
3,470 |
6,147 |
|
2018 |
1,500 |
5,850 |
5,074 |
10,924 |
Source: CRS, based on data provided by the U.S. Department of Transportation.
Notes: The amount of funding available is the program funding appropriated by Congress.
The Administration's stated rationales for prioritizing funding for projects in rural areas are open to question. While 71% of the nation's roads are in rural areas, they account for only 30% of total vehicle miles traveled,13 and over the period FY2009-FY2015, 37% of federal highway funding went to rural roads.14 Rural roads are on average in better condition than urban roads; in 2012 93% of the vehicle miles traveled on rural roads were on roads with pavement conditions rated as acceptable or good, compared with 78% of the vehicle miles traveled on urban roads.15
The Administration's claim that safety factors justify directing two-thirds of BUILD grants to rural areas is only partially supported by available data. While a disproportionate share of highway deaths occurs on rural roads, that proportion has been trending downward, declining from around 60% in the early 2000s to 46% in 2017. The number of traffic fatalities in rural areas declined by 18% from 2008-2017, while the number of fatalities in urban areas increased by 17% over the same period.16 Moreover, road conditions are only one factor among the reasons why the share of highway fatalities in rural areas exceeds the share of population in those areas. Other factors include driver behavior (e.g., higher typical speeds, lower rates of seat belt use, and higher driver fatigue rates), typically longer travel times for emergency medical care, and vehicle condition.
In the FY2019 DOT appropriations act, Congress made two changes that may constrain the Administration's discretion to steer funding toward projects in rural areas: limiting the share of program funding that can go to rural areas to 50%, and changing the definitions of urban and rural areas used in the BUILD program. Urban areas would be defined as areas "located within (or on the boundary of) a Census-designated urbanized area that had a population greater than 200,000 in the 2010 Census."17 Areas outside that are considered rural. By this definition, roughly 60% of the U.S. population lived in urban areas, and roughly 40% in rural areas, in 2015.18 Thus, some areas that in previous rounds of applications would have been considered urban areas would now be considered rural for the purposes of the BUILD program. How this change will affect the distribution of funds in FY2019 and subsequent years is unclear.
Grants to a Variety of Modes
Since the second year of the program, Congress has directed DOT to ensure that the program makes "investment in a variety of transportation modes." A unique feature of the BUILD grant program is its flexibility: any surface transportation infrastructure is eligible for funding. Throughout most of the program's life, this flexibility has been reflected in the grants awarded; while road projects received more funding than projects in other modes, other modes collectively received two-thirds of the total program funding (see Table 7). This situation changed beginning with the FY2017 round of grants; for FY2017-FY2018, road projects received over two-thirds of the funding awarded, with the remainder divided among four other modes, one of which—bicycle-pedestrian projects—receiving no funding at all.
|
Road |
Transit |
Rail |
Bike/Ped |
Port/Maritime |
|
|
2009-2016 |
33% |
27% |
21% |
7% |
11% |
|
2017-2018 |
71% |
8% |
10% |
0% |
10% |
Source: CRS, based on U.S. Department of Transportation data.
Notes: Percentages were calculated after all grants were converted to constant 2019 dollars. Grants for planning of projects are not included in this table. Grants for project planning were authorized by Congress and were awarded by DOT in FY2010 and FY2014; in total the amounts represented less than 1% of total funding for the FY2009-FY2016 period. In FY2018 Congress again authorized DOT to make grants for planning of projects; no applications for planning grants were received and no planning grants were awarded.
Distribution Requirements Versus Economic Impact in Grant Awards
From the first round of funding through FY2017, Congress directed that grants be made for projects that will have a significant impact on the nation, a metropolitan area, or a region. Surface transportation projects that are likely to have a significant impact on the nation, or even a multistate region, are typically quite expensive; for example, Amtrak's Hudson River Tunnel Project, to replace the deteriorating tunnels that carry Amtrak and commuter trains under the Hudson River between New Jersey and New York, is estimated to cost over $11 billion.19
Given the relatively modest amounts of funding available for TIGER/BUILD grants each year and Congress's directive that grant funding be awarded equitably across the nation, between rural and urban areas, and among surface transportation modes, the amount of money any single project is likely to receive limits the ability of the TIGER/BUILD program to provide more than a small share of the funding needed to complete projects that could have a significant impact on the nation. The largest single grant awarded during the FY2009-FY2018 period was for $118.5 million, and that was for a project that spanned two states (see Table 8). Three grants have been awarded for more than $100 million; of the 553 grants awarded, few have been for more than $50 million. Of the 10 largest grants awarded, nine were awarded in the first year of the program, when available funding was far larger than in any subsequent year (see Table 8). Even though the maximum grant size permitted was $200 million from FY2010 to FY2015 and $100 million in FY2016, the largest grant awarded since FY2010 has been $25 million.
|
Grant Amount |
State(s) |
Mode |
Fiscal Year |
|
$118.5 |
TN, AL |
Rail (freight) |
2009 |
|
112.9 |
IL |
Rail (freight) |
2009 |
|
110.6 |
OH, PA, WV, MD |
Rail (freight) |
2009 |
|
93.7 |
NY |
Transit |
2009 |
|
71.1 |
AZ |
Transit |
2009 |
|
66.4 |
DC, VA, MD |
Transit |
2009 |
|
62.6 |
MA |
Transit |
2009 |
|
56.4 |
MO, KS |
Transit |
2009 |
|
55.8 |
OK |
Road |
2009 |
|
53.3 |
GA |
Transit |
2010 |
Source: CRS, based on data provided by the U.S. Department of Transportation.
The first year of grants also saw the largest average grant size, $33 million; in subsequent rounds of funding, the average size of grants in each round has fluctuated between $9 million and $17 million (see Table 9). In addition to the lower limit on the maximum grant amount, one factor that may have led to the decrease in the average size of grants after the first year was that the total amount of TIGER/BUILD grant funding available in each year until FY2018 was less than half the amount in FY2009, so DOT may have chosen to make smaller grants in order to distribute the available funding widely.
|
Fiscal Year |
Total Amount Awarded in Grants |
Number of Grants Awarded |
Average Grant Amount |
|
2009 2010 2011 2012 2013 2014 2015 2016 2017 2018 |
$1,691 642 559 526 493 619 511 512 499 1,505 |
51 41 46 47 52 41 39 40 41 91 |
$33.2 15.6 12.2 11.2 9.5 15.1 13.1 12.8 12.2 16.5 |
|
Total |
7,557 |
489 |
15.5 |
Source: CRS, based on U.S. Department of Transportation data.
Notes: Planning grants, which were awarded in FY2010 and FY2014, are not included.
In a 2014 review of the program, the U.S. Government Accountability Office (GAO) reported that while DOT had selection criteria for the TIGER grant program, it had sometimes awarded grants to lower-ranked projects while bypassing higher-ranked projects without explaining why it did so, raising questions about the integrity of the selection process.20 DOT responded that while its project rankings were based on transportation-related criteria, such as safety and economic impact, sometimes it had to select lower-ranking projects over higher-ranking ones to comply with other selection criteria established by Congress, such as geographic balance and a balance between rural and urban awards.21
Attempt to Increase the Program's Funding Leverage
In FY2018, the Notice of Funding Opportunity soliciting grant applications noted two changes to the program under the Trump Administration: the program was renamed the Better Utilizing Investments to Leverage Development (BUILD), and the practical reflection of that name change was a statement that DOT would give priority to grant applicants that provided new, nonfederal revenue for projects for which they were seeking BUILD funding. "New revenue" was defined as "revenue that is not included in current and projected funding levels and results from specific actions taken to increase transportation infrastructure investment."22 Examples given in the notice included sales or gas tax increases, tolling, tax-increment financing, and asset recycling. Borrowing (issuing bonds) did not count as a new revenue source. DOT would not consider any source of revenue that had been authorized prior to January 1, 2015, as new revenue.
The Administration presented this new stance as a way of increasing the leverage of federal funding to raise more revenue from other sources. Critics charged that the policy penalized states and localities that had already acted to raise more revenue for transportation projects. Critics also noted the irony of the Administration encouraging states and localities to provide additional revenue for transportation investment when Congress had been unable to increase the federal excise tax on motor fuel, the primary source of federal surface transportation revenues, since 1993. Critics also noted that favoring projects involving additional revenue from new sources posed a particular challenge for rural areas, as the number of residents who might pay a new sales tax or highway toll is by definition relatively low.23
Despite that concern, in the FY2018 round of awards, projects in rural areas received a higher proportion of the program's funding than ever before in the history of the program: 69% (see Table 5). The information about the projects receiving grants is not sufficiently detailed to show how much additional nonfederal revenue was raised in connection to the projects. In the FY2019 DOT Appropriations Act, Congress directed DOT not to use an applicant's ability to generate nonfederal revenue as a selection criterion in approving future BUILD grants.24
Measures of Program Impact
In 201625 and 201826 DOT published reports measuring the performance of projects that received TIGER grants. The reports state that, given the array of projects that can receive TIGER grants, measuring their performance is challenging and, for the same reason, valuable. DOT has required grantees to develop performance plans and measures for each project, beginning before the construction of the project and continuing for years after the project is completed. The sponsor of each project is responsible for setting up performance measures it considers relevant to its project. There is no requirement for comparability of the measures across projects.
The DOT reports do not summarize the projects and their benefits. Rather, each presents a number of case studies of individual projects, including the performance measures chosen by each grantee.
Appendix. TIGER/BUILD Grant Program Criteria, FY2009-FY2019
Table A-1. TIGER/BUILD Grant Program Criteria, FY2009-FY2019
(dollar figures are not adjusted for inflation)
|
2009 |
2010 |
2011 |
2012 |
2013 |
2014 |
2015 |
2016 |
2017 |
2018 |
2019 |
|
|
Funding |
$1.5 billion |
$600 million |
$600 million |
$528 million |
$500 million |
$600 million |
$500 million |
$500 million |
$500 million |
$1.5 billion |
$900 million |
|
Eligible applicants |
State and local governments, including U.S. territories, tribal governments, transit agencies, port authorities, metropolitan planning organizations (MPOs), other political subdivisions of state or local governments, and multistate or multijurisdictional groups applying through a single lead applicant |
||||||||||
|
Eligible projects |
Include, but are not limited to (1) highway, bridge, or other road projects eligible under Title 23, United States Code; (2) public transportation projects eligible under chapter 53 of Title 49, United States Code; (3) passenger and freight rail transportation projects; (4) port infrastructure investments (including inland port infrastructure and land ports of entry), and (5) intermodal projects. |
||||||||||
|
Planning |
Up to $35 million for project planning, preparation, or design. |
Up to $35 million for project planning, preparation, or design. |
Up to $15 million for project planning, preparation, or design. |
||||||||
|
Federal share of total cost |
Up to 100% |
Up to 80% (up to 100% in rural areas) |
|||||||||
|
Available to pay subsidy and administrative costs of TIFIA loans |
Up to $200 million |
Up to $150 million |
Up to $175 million |
Up to $166 million |
Up to 35% ($210 million) |
Up to 20% ($100 million) |
Up to 20% ($300 million) |
Up to 20% ($180 million) |
|||
|
Grant size |
Minimum $20 million; maximum $300 million. Minimum can be waived for projects in smaller cities, regions, or states. |
Minimum $10 million for urban areas, $1 million for rural areas. Maximum $200 million. |
Minimum $5 million for urban areas, $1 million for rural areas. Maximum $100 million. |
Minimum $5 million for urban areas, $1 million for rural areas. Maximum $25 million. |
|||||||
|
Maximum share to a single state |
No more than 20% ($300 million) |
No more than 25% |
No more than 20% |
No more than 10% |
|||||||
|
Geographic distribution |
DOT must ensure an equitable geographic distribution. |
||||||||||
|
Urban/ rural split |
DOT must ensure an appropriate balance in addressing the needs of urban and rural areas. |
||||||||||
|
Not less than $140 million for projects in rural areas. |
Not less than $120 million for projects in rural areas. |
Not less than 20% ($100 million) for projects in rural areas. |
Not less than 30% ($450 million) for projects in rural areas. |
Not less than 50% ($450 million) for projects in rural areas. |
|||||||
|
By mode |
DOT must ensure an appropriate balance of investment in a variety of modes. |
||||||||||
Source: CRS, based on DOT appropriation acts and Notice of Funding Availability/Opportunity notices in the Federal Register, various years.
Notes: In 2010 and 2018, planning, preparation, or design of surface transportation projects (including environmental analysis, feasibility studies, and other preconstruction activities) was included as an eligible expense; in these years, DOT categorized grants for such purposes as "planning grants." TIFIA refers to the U.S. DOT loan program created by the Transportation Infrastructure Finance and Innovation Act.