Introduction
Medicare is a federal insurance program that pays for covered health care services of qualified beneficiaries. It was established in 1965 under Title XVIII of the Social Security Act as a federal entitlement program to provide health insurance to individuals aged 65 and older, and it has been expanded over the years to include permanently disabled individuals under the age of 65.
Medicare consists of four distinct parts, A through D. Part A covers hospital services, skilled nursing facility (SNF) services, home health visits, and hospice services. Most persons aged 65 and older are automatically entitled to premium-free Part A because they or their spouse paid Medicare payroll taxes for at least 40 quarters (10 years) on earnings covered by either the Social Security or the Railroad Retirement systems. Part B covers a broad range of medical services, including physician services, laboratory services, durable medical equipment, and outpatient hospital services. Enrollment in Part B is voluntary; however, most beneficiaries with Part A also enroll in Part B. Part C, Medicare Advantage (MA), provides private plan options, such as managed care, for beneficiaries who are enrolled in both Part A and Part B. Part D provides optional outpatient prescription drug coverage.1
Medicare expenditures are driven by a variety of factors, including the level of enrollment, the complexity of medical services provided, health care inflation, and life expectancy. In 2018, Medicare provided benefits to about 60 million persons at an estimated total cost of $741 billion.2
The Medicare program has two separate trust funds—the Hospital Insurance (HI) Trust Fund and the Supplementary Medical Insurance (SMI) Trust Fund. The Part A program, which is financed mainly through payroll taxes levied on current workers, is accounted for through the HI Trust Fund. The Part B and Part D programs, which are funded primarily through general revenue and beneficiary premiums, are accounted for through the SMI Trust Fund.3 Both funds are maintained by the Department of the Treasury and overseen by the Medicare Board of Trustees, which reports annually to Congress concerning the funds' financial status.4 Financial projections are made using economic assumptions based on current law, including estimates of consumer price index, workforce size, wage increases, and life expectancy.
From its inception, the HI Trust Fund has faced a projected shortfall and eventual insolvency. Because of the way it is financed, the SMI Trust Fund cannot become insolvent; however, the Medicare trustees continue to express concerns about the rapid growth in SMI costs.5
Medicare Hospital Insurance Financing
Similar to the Social Security system, the HI portion of Medicare was designed to be self-supporting and is financed through dedicated sources of income, rather than relying on general tax revenues. The primary source of income credited to the HI Trust Fund is payroll taxes paid by employees and employers; each pays a tax of 1.45% on earnings. The self-employed pay 2.9%. Unlike Social Security, there is no upper limit on earnings subject to the tax.6 The Patient Protection and Affordable Care Act (ACA; P.L. 111-148, as amended) imposes an additional tax of 0.9% on high-income workers with wages over $200,000 for single filers and $250,000 for joint filers, effective for taxable years beginning in 2013.7
Additional income to the HI Trust Fund consists of premiums paid by voluntary enrollees who are not entitled to premium-free Medicare Part A through their (or their spouse's) work in covered employment, a portion of the federal income taxes paid on Social Security benefits,8 and interest on federal securities held by the HI Trust Fund.
What Is the HI Trust Fund?
The HI Trust Fund is a financial account in the U.S. Treasury into which all income to the Part A portion of the Medicare program is credited and from which all benefits and associated administrative costs of the Part A program are paid. The trust fund is solely an accounting mechanism—no actual money is transferred into or out of the fund.9
HI operates on a "pay-as-you-go" basis, meaning the annual revenues to the HI Trust Fund, primarily the taxes paid by current workers and their employers, are used to pay Part A benefits for today's Medicare beneficiaries. When the government receives Medicare revenues (e.g., payroll taxes), income is credited by the Treasury to the appropriate trust fund in the form of special issue interest-bearing government securities.10 (Interest on these securities is also credited to the trust fund.) The tax income exchanged for these securities then goes into the General Fund of the Treasury and is indistinguishable from other cash in the General Fund; this cash may be used for any government spending purpose. When payments for Medicare Part A services are made, the payments are paid out of the General Fund of the Treasury and a corresponding amount of securities is deleted from (written off) the HI Trust Fund.
In years in which the HI Trust Fund spends less than it receives in income, the fund has a cash-flow surplus. When this occurs, the HI Trust Fund securities exchanged for any income in excess of spending show up as assets on the trust fund's financial accounting balance sheets and are available to the system to meet future obligations. The trust fund surpluses are not reserved for future Medicare benefits but are simply bookkeeping entries that indicate how much Medicare has lent to the Treasury (or, alternatively, what is owed to Medicare by the Treasury). From a unified budget perspective, these assets represent future budget obligations and are treated as liabilities.11
If, in a given year, the HI Trust Fund spends more than it receives in income, the fund has a cash-flow deficit. In deficit years, Medicare can redeem any securities accumulated in previous years (including interest). When the securities are redeemed, the government needs to raise the resources necessary to pay for the securities and the monies are transferred from the Treasury's General Fund to the HI Trust Fund. When the assets credited to the trust fund reach zero, the fund is deemed insolvent.
(See Appendix A for a discussion of recent and projected HI cash flows and for data on historical and projected HI operations through 2028.)
History of HI Solvency Projections
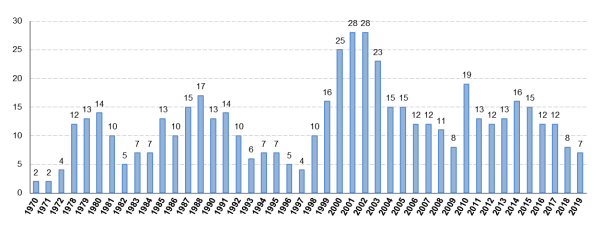
The HI Trust Fund has never become insolvent. The Medicare Board of Trustees projected insolvency for the HI Trust Fund beginning with the 1970 report,12 at which time the trust fund was expected to become insolvent in only two years. (See Table 1 and Figure 1.) The insolvency date has been postponed a number of times since the beginning of Medicare through various methods. For example, the payroll tax rate has been adjusted periodically by Congress as one of the mechanisms to maintain the financial adequacy of the HI Trust Fund. (See Appendix B for historical payroll tax rates.)
Other legislative changes have been made at various times to slow the growth in HI program spending; generally, these measures have been part of larger budget reconciliation laws that attempt to restrain overall federal spending. To illustrate, in the mid-1990s, efforts to curtail Medicare spending intensified as Congress considered legislation to bring the entire federal budget into balance and culminated in the passage of the Balanced Budget Act of 1997 (BBA 97; P.L. 105-33). In early 1997, the Medicare trustees had projected that the HI Trust Fund would become insolvent within four years, in 2001. Following the enactment of BBA 97, significant improvements were made in the short-term projections over the next few years. The new projections reflected a number of factors, including lower expected expenditures as a result of changes made by BBA 97 (primarily resulting from modifications in Medicare Part C payments and the establishment of prospective payment systems for certain Part A providers);13 continued efforts to combat fraud and abuse; and strong economic growth, which was expected to generate more revenues to the trust fund from payroll taxes.
Table 1. Year of Projected Insolvency of the Hospital Insurance (HI) Trust Fund in Past and Current Trustees Reports
|
Year of Trustees Report |
Year of Projected Insolvency |
Year of Trustees Report |
Year of Projected Insolvency |
Year of Trustees Report |
Year of Projected Insolvency |
|
1970 |
1972 |
1986 (amended) |
1998 |
2003 |
2026 |
|
1971 |
1973 |
1987 |
2002 |
2004 |
2019 |
|
1972 |
1976 |
1988 |
2005 |
2005 |
2020 |
|
1973 |
None Indicated |
1989 |
None Indicated |
2006 |
2018 |
|
1974 |
None Indicated |
1990 |
2003 |
2007 |
2019 |
|
1975 |
Late 1990s |
1991 |
2005 |
2008 |
2019 |
|
1976 |
Early 1990s |
1992 |
2002 |
2009 |
2017 |
|
1977 |
Late 1980s |
1993 |
1999 |
2010 |
2029 |
|
1978 |
1990 |
1994 |
2001 |
2011 |
2024 |
|
1979 |
1992 |
1995 |
2002 |
2012 |
2024 |
|
1980 |
1994 |
1996 |
2001 |
2013 |
2026 |
|
1981 |
1991 |
1997 |
2001 |
2014 |
2030 |
|
1982 |
1987 |
1998 |
2008 |
2015 |
2030 |
|
1983 |
1990 |
1999 |
2015 |
2016 |
2028 |
|
1984 |
1991 |
2000 |
2025 |
2017 |
2029 |
|
1985 |
1998 |
2001 |
2029 |
2018 |
2026 |
|
1986 |
1996 |
2002 |
2030 |
2019 |
2026 |
Sources: Intermediate projections of various Medicare Trustees Reports, 1970-2019.
There were concerns that the savings achieved through the enactment of BBA 97 were greater than intended at the time of enactment and had unintended consequences for health care providers. As a result of these concerns, Congress enacted two measures: the Balanced Budget Refinement Act of 1999 (BBRA 99; P.L. 106-113) and the Medicare, Medicaid, and SCHIP Benefits Improvement and Protection Act of 2000 (BIPA 2000; P.L. 106-554). These measures were designed to reverse some of the BBA 97 spending reductions.
Despite enactment of BBRA 99 and BIPA 2000, which increased program spending, the 2001 and 2002 Medicare Trustees Reports continued to delay the projected insolvency date. These improvements in solvency projections reflected both stronger-than-expected economic growth and lower-than-expected program costs due to lower projected enrollment in Medicare Part C, heightened antifraud and abuse initiatives, and lower-than-expected increases in health care costs.
The 2003 report projections, however, shifted direction. The projected insolvency date was 2026, four years earlier than the 2030 date projected in the 2002 report. The revision was due to lower-than-expected HI-taxable payroll and higher-than-expected hospital expenditures. In the next year, the 2004 report projected that the HI Trust Fund would become insolvent in 2019, seven years earlier than projected in 2003. A number of factors contributed to the revision of the projected insolvency date, including slow wage growth (on which payroll taxes are based) and faster growth in inpatient hospital benefits. In addition, the enactment of the Medicare Prescription Drug, Improvement, and Modernization Act of 2003 (MMA; P.L. 108-173) added significantly to HI costs, primarily through higher payments to rural hospitals and to private plans under the MA program.14
The 2005 Medicare Trustees Report projected that the HI Trust Fund would become insolvent one year later than projected in 2004, in 2020. The revision reflected slightly higher income and slightly lower costs in 2004 than previously estimated. The 2006 report moved the insolvency date forward again, to 2018. The revision reflected expectations of slightly higher costs and increased utilization of HI services. Both the 2007 and 2008 reports projected a 2019 insolvency date, although the 2008 report indicated that insolvency would occur earlier in the year. The 2009 report moved the insolvency date forward to 2017, due primarily to the economic recession.
The 2010 Medicare Trustees Report, issued subsequent to the enactment of the ACA, estimated that the combination of lower Part A costs and higher payroll-tax revenues expected to result from the ACA would postpone depletion of the HI Trust Fund's assets until 2029, 12 years later than the date projected in the 2009 report.15 However, the 2011 report projected that the HI Trust Fund would become insolvent in 2024, five years earlier than projected in the 2010 report. The worsening financial outlook was primarily due to lower-than-expected payroll taxes stemming from higher-than-expected unemployment and slow wage growth in 2010. The 2012 Medicare Trustees Report projected the same 2024 insolvency date. Although income from payroll taxes was expected to increase at a faster rate than expenditures through 2018 due to the projected economic recovery, the application of an additional 0.9% HI payroll tax for high-income workers beginning in 2013,16 and the 2% reduction in spending required by the Budget Control Act of 2011 (BCA; P.L. 112-25) from 2013 through 2021,17 income was still expected to be insufficient to fully cover projected HI expenses during that period.
In their 2013 report, the Medicare trustees projected a somewhat better short-term outlook for the HI Trust Fund. They moved the insolvency date two years later than their 2012 estimate, to 2026. The improved projections were primarily due to lower-than-expected expenditures in 2012, the base year used to project future expenditures, and a larger-than-estimated impact of ACA payment methodology changes on MA costs.18 In their 2014 report, the Medicare trustees reported some improvement in Medicare's financial outlook and therefore moved the insolvency date four years later than their 2013 estimate, to 2030. This improvement was mainly due to lower expected utilization of and/or spending for certain Part A services, including inpatient hospital, skilled nursing, and home health care. The 2015 trustees report projected a similar short-term financial outlook and maintained the 2030 insolvency date estimate.
The 2016 Medicare Trustees Report projected a slightly worsened short-term outlook for the HI Trust Fund and therefore moved the insolvency date two years earlier than their 2015 estimate, to 2028. This change was primarily due to lower-than-expected payroll-tax income resulting from a slowing in real wage growth. In their 2017 report, the Medicare trustees projected a slightly improved short-term outlook for the HI Trust Fund and therefore moved the insolvency date one year later than their 2016 estimate, to 2029. This change was primarily due to lower-than-expected HI expenditures in 2016 (which reduced the projection base) and lower projected future utilization of inpatient hospital services.
The 2018 Medicare Trustees Report projected a worsened short-term outlook for the HI Trust Fund,19 and therefore moved the insolvency date three years earlier than their 2017 estimate, to 2026 (from 2029 in the 2017 report). This shift was primarily due to changes in estimates affecting HI revenues, including a reduction in projected income from payroll taxes due to lower-than-expected wages in 2017 and projections of slower gross domestic product growth, as well as expectations of reduced income from taxes on Social Security benefits as a result of recent legislation that lowered individual income taxes through 2025.
Current Insolvency Projections
In their 2019 report,20 the Medicare trustees project the same date of insolvency (2026) as in their 2018 report. However, HI income is projected to be lower than estimated in the 2018 report due to expected lower payroll tax revenue and reduced income from the taxation of Social Security benefits. Additionally, although expenditures are expected to be slightly higher than last year's estimates because of higher-than-projected 2018 HI expenditures and higher projected updates to provider payments, these updated spending estimates are mostly offset by an expectation of lower future utilization of skilled nursing facility services.
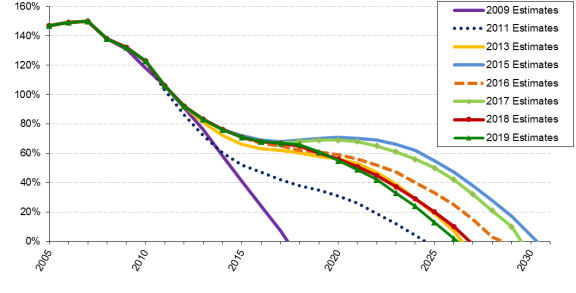
While expenditures in the HI Trust Fund exceeded income each year from 2008 through 2015, the Medicare trustees reported small surpluses in 2016 and 2017. (See Table A-1.) In 2018 and beyond, however, expenditure growth is expected to again outpace growth in income. Trust fund assets are expected to be used to make up the difference between income and expenditures, until the assets are depleted in 2026 under the 2019 estimates. (See Figure 2.)
Each year, beginning in 2010, the Centers for Medicare & Medicaid Services (CMS) actuaries have issued an illustrative alternative scenario that has assumed that certain ACA changes that reduce Part A provider reimbursements would be gradually phased out.21 As the 2019 alternative scenario assumes that this phaseout would begin in 2028, after the projected 2026 HI insolvency date, this alternative analysis assumes the same 2026 date of insolvency.
What Would Happen If the Fund Became Insolvent?
The practical function of the HI Trust Fund is to permit the continued payment of bills in the event of a temporary financial strain (e.g., lower income or higher costs than expected) without requiring legislative action. As long as the HI Trust Fund has a balance (i.e., securities are credited to the fund), the Treasury Department is authorized to make payments for Medicare Part A services. If the HI Trust Fund is not able to pay all current expenses out of current income and accumulated trust fund assets, the HI Trust Fund is considered to be insolvent.22
To date, the HI Trust Fund has never become insolvent. There are no provisions in the Social Security Act that govern what would happen if insolvency were to occur. For example, the program has no statutory authority to use general revenues to fund Part A services in the event of such a shortfall.
In their 2019 report, the Medicare trustees project that the HI Trust Fund will be exhausted in 2026. At that time, HI would continue to receive payroll tax income from which some benefits could be paid; however, funds would be sufficient to pay for only 89% of Part A expenses. Unless action is taken prior to that date to increase revenues or to decrease expenditures (or some combination of the two), Congress may face a legislative decision regarding whether, and how, to provide for another source of funding (e.g., general revenues) to make up for these deficits.
Medicare Financing Issues
Much of the concern about the financial status of Medicare tends to focus on the HI Trust Fund date of insolvency, when Medicare no longer has the authority to pay for Part A health care services in full. This focus can, however, detract from the larger issues confronting the Medicare program as a whole and from the program's current and future impact on the federal budget and on taxpayers. When viewed from the perspective of the entire federal budget, as the number of beneficiaries and per capita health care costs continue to grow, total Medicare spending obligations (HI and SMI spending combined) are expected to place increasing demands on federal budgetary resources.
As noted earlier, because of the way it is financed, the SMI (Parts B and D) portion of Medicare cannot become insolvent. However, a continuing shift from providing care in inpatient (Part A) settings to outpatient (Parts B and D) settings has resulted in a greater portion of Medicare spending being covered by beneficiary premiums and general revenues than by dedicated payroll taxes.23 In the future, the Medicare trustees estimate that the portion of personal and corporate income taxes needed to fund SMI will increase from about 15.2% in 2019 to about 22.3% in 2030 and 28.3% in 2093.24
Appendix A. Operation of the Hospital Insurance Trust Fund
Beginning in 2004, expenditures began exceeding tax income (from payroll taxes and from the taxation of Social Security benefits). Expenditures began to exceed total income (tax income plus all other sources of revenue) in 2008, and Hospital Insurance (HI) assets (the balance of the HI Trust Fund at the beginning of the year) were used to meet the portion of expenditures that exceeded income. Expenditures exceeded income every year from 2008 through 2015. In 2016 and 2017, the HI Trust Fund ran a small surplus. Beginning in 2018, expenditures are expected to again exceed income each year, with trust fund assets making up the difference, until the asset balance is depleted in 2026. At that time, the HI Trust Fund would no longer have sufficient funds to allow for the full payment of Part A expenditures (see Table A-1, below, for historical and projected Medicare financial data through 2028).
Table A-1. Operation of the Hospital Insurance Trust Fund,
Calendar Years 1970-2028
(in billions of dollars)
|
Year |
Income |
Expenditures |
Trust Fund |
|||||
|
Payroll Taxes |
Interest, Transfers, Othera |
Total |
Benefit Payments |
Admin. Expenses |
Total |
Net Change from Prior Year |
Balance at End of Year |
|
|
Historical Data |
||||||||
|
1970 |
$4.9 |
$1.2 |
$6.0 |
$5.1 |
$0.2 |
$5.3 |
$0.7 |
$3.2 |
|
1975 |
11.5 |
1.4 |
13.0 |
11.3 |
0.3 |
11.6 |
1.4 |
10.5 |
|
1980 |
23.8 |
2.1 |
26.1 |
25.1 |
0.5 |
25.6 |
0.5 |
13.7 |
|
1985 |
47.6 |
3.9 |
51.4 |
47.6 |
0.8 |
48.4 |
4.8 |
20.5 |
|
1990 |
72.0 |
8.4 |
80.4 |
66.2 |
0.8 |
67.0 |
13.4 |
98.9 |
|
1995 |
98.4 |
16.7 |
115.0 |
116.4 |
1.2 |
117.6 |
-2.6 |
130.3 |
|
2000 |
144.4 |
22.9 |
167.2 |
128.5 |
2.6 |
131.1 |
36.1 |
177.5 |
|
2005 |
171.4 |
28.0 |
199.4 |
180.0 |
2.9 |
182.9 |
16.4 |
285.8 |
|
2006 |
181.3 |
30.2 |
211.5 |
189.0 |
2.9 |
191.9 |
19.6 |
305.4 |
|
2007 |
191.9 |
31.9 |
223.7 |
200.2 |
2.9 |
203.1 |
20.7 |
326.0 |
|
2008 |
198.7 |
32.0 |
230.8 |
232.3 |
3.3 |
235.6 |
-4.7 |
321.3 |
|
2009 |
190.9 |
34.5 |
225.4 |
239.3 |
3.2 |
242.5 |
-17.1 |
304.2 |
|
2010 |
182.0 |
33.6 |
215.6 |
244.5 |
3.5 |
247.9 |
-32.3 |
271.9 |
|
2011 |
195.6 |
33.4 |
228.9 |
252.9 |
3.8 |
256.7 |
-27.7 |
244.2 |
|
2012 |
205.7 |
37.3 |
243.0 |
262.9 |
3.9 |
266.8 |
-23.8 |
220.4 |
|
2013 |
220.8 |
30.3 |
251.1 |
261.9 |
4.3 |
266.2 |
-15.0 |
205.4 |
|
2014 |
227.4 |
33.9 |
261.2 |
264.9 |
4.5 |
269.3 |
-8.1 |
197.3 |
|
2015 |
241.1 |
34.3 |
275.4 |
273.4 |
5.5 |
278.9 |
-3.5 |
193.8 |
|
2016 |
253.5 |
37.3 |
290.8 |
280.5 |
4.9 |
285.4 |
5.4 |
199.1 |
|
2017 |
261.5 |
37.8 |
299.4 |
293.3 |
3.2 |
296.5 |
2.8 |
202.0 |
|
2018 |
268.3 |
38.3 |
306.6 |
303.0 |
5.2 |
308.2 |
−1.6 |
200.4 |
|
Intermediate Estimates |
||||||||
|
2019 |
285.3 |
38.3 |
323.7 |
325.0 |
5.4 |
330.4 |
−6.7 |
193.7 |
|
2020 |
301.3 |
40.5 |
341.9 |
346.0 |
5.7 |
351.8 |
−9.9 |
183.8 |
|
2021 |
317.1 |
43.1 |
360.2 |
369.7 |
6.1 |
375.8 |
−15.7 |
168.1 |
|
2022 |
333.5 |
45.4 |
378.9 |
397.0 |
6.5 |
403.5 |
−24.6 |
143.5 |
|
2023 |
350.2 |
47.9 |
398.2 |
425.7 |
7.0 |
432.6 |
−34.5 |
109.0 |
|
2024 |
367.9 |
50.8 |
418.7 |
455.1 |
7.4 |
462.5 |
−43.8 |
65.3 |
|
2025 |
385.7 |
53.8 |
439.5 |
486.3 |
7.9 |
494.2 |
−54.6 |
10.6 |
|
2026 |
404.5 |
61.3 |
465.7 |
518.5 |
8.4 |
526.9 |
−61.2 |
−50.5 |
|
2027 |
423.8 |
67.6 |
491.5 |
549.8 |
9.0 |
558.8 |
−67.3 |
−117.8 |
|
2028 |
443.6 |
70.4 |
514.0 |
599.9 |
10.0 |
609.9 |
−95.9 |
−213.7 |
Source: Boards of Trustees, Federal Hospital Insurance and Federal Supplementary Medical Insurance Trust Funds, 2019 Annual Report of the Boards of Trustees of the Federal Hospital Insurance and Federal Supplementary Medical Insurance Trust Funds, April 22, 2019, Table III.B4.
Notes: Sums may not equal totals due to rounding.
a. Includes income from the taxation of Social Security benefits, Railroad Retirement account transfers, premiums paid by voluntary enrollees, and interest.
Appendix B. Historical Payroll Tax Rates
|
Calendar Year |
Maximum Tax Base |
Tax Rate (percentage of taxable earnings) |
|
|
Employees and Employers, Each |
Self-Employed |
||
|
1966 |
$6,600 |
0.35% |
0.35% |
|
1967 |
6,600 |
0.50 |
0.50 |
|
1968-1971 |
7,800 |
0.60 |
0.60 |
|
1972 |
9,000 |
0.60 |
0.60 |
|
1973 |
10,800 |
1.00 |
1.00 |
|
1974 |
13,200 |
0.90 |
0.90 |
|
1975 |
14,100 |
0.90 |
0.90 |
|
1976 |
15,300 |
0.90 |
0.90 |
|
1977 |
16,500 |
0.90 |
0.90 |
|
1978 |
17,700 |
1.00 |
1.00 |
|
1979 |
22,900 |
1.05 |
1.05 |
|
1980 |
25,900 |
1.05 |
1.05 |
|
1981 |
29,700 |
1.30 |
1.30 |
|
1982 |
32,400 |
1.30 |
1.30 |
|
1983 |
35,700 |
1.30 |
1.30 |
|
1984 |
37,800 |
1.30 |
2.60 |
|
1985 |
39,600 |
1.35 |
2.70 |
|
1986 |
42,000 |
1.45 |
2.90 |
|
1987 |
43,800 |
1.45 |
2.90 |
|
1988 |
45,000 |
1.45 |
2.90 |
|
1989 |
48,000 |
1.45 |
2.90 |
|
1990 |
51,300 |
1.45 |
2.90 |
|
1991 |
125,000 |
1.45 |
2.90 |
|
1992 |
130,200 |
1.45 |
2.90 |
|
1993 |
135,000 |
1.45 |
2.90 |
|
1994-2012 |
no limit |
1.45 |
2.90 |
|
2013 and latera |
no limit |
1.45 |
2.90 |