Introduction
Levels of pay for congressional staff are a source of recurring questions among Members of Congress, congressional staff, and the public. Senators set the terms and conditions of employment for staff in their offices. These include job titles and descriptions; rates of pay, subject to minimum and maximum levels;1 and resources available to them to carry out their official duties.2 There may be interest in congressional pay data from multiple perspectives, including assessment of the costs of congressional operations, guidance in setting pay levels for staff in Senators' offices, or comparison of congressional staff pay levels with those of other federal government pay systems.
Publicly available information sources do not provide aggregated congressional staff pay data in a readily retrievable form. The most recent publicly available Senate staff compensation report was issued in 2006,3 and relied on anonymous, self-reported survey data. Data in this report are based on official, retrievable Senate reports, which afford the opportunity to use data from a consistent, authoritative source. Pay4 information in this report is based on the Senate's Report of the Secretary of the Senate, published semiannually, in periods from April 1 to September 30, and October 1 to March 31,5 as collated by LegiStorm, a private entity that provides some congressional data by subscription.6 Annual data allow for observations about the nature of Senators' personal staff compensation over time.
This report provides pay data for 16 staff position titles that are typically found in Senators' offices.7 The positions include the following:
- Administrative Director
- Casework Supervisor8
- Caseworker9
- Chief of Staff
- Communications Director
- Constituent Services Representative
- Counsel
- Executive Assistant
- Field Representative10
- Legislative Assistant
- Legislative Correspondent
- Legislative Director
- Press Secretary
- Scheduler
- Staff Assistant
- State Director
The collection of Senators' staff pay data for FY2001-FY2018 proceeded as follows. For each fiscal year, a random sample11 of 25 Senators' offices was taken for each position. Senate staff had to hold a position with the same job title in the Senator's office for the entire fiscal year examined, and not receive pay from any other congressional employing authority to be included. Generally, each position has no more than one observation per Senator's office each fiscal year.
Every recorded payment ascribed in the LegiStorm data to those staff for the fiscal year is included in the calculation of a staffer's annual pay. Data collected for this report may differ from an employee's stated annual salary due to the inclusion of overtime, bonuses, or other payments12 in addition to base salary paid in the course of a year.
For some positions, it was not possible to identify 25 offices that employed staff in some positions for an entire year. In circumstances when data for 10 or fewer staff were identified for a position, this report provides no data.
The Congressional Research Service provides a number of products on staffing issues. These can be found in CRS Report R44688, Congressional Staff: CRS Products on Size, Pay, and Job Tenure.
Data Concerns
There may be some advantages to relying on official salary expenditure data instead of survey findings, but data presented here are subject to some challenges that could affect findings or their interpretation. Some of the concerns include the following:
- Since periods of time covered by the Report of the Secretary of the Senate overlap the end of one Congress and convening of the next, data are not available for first-term Senators in the first session of a Congress. Data presented in this report do not include staff serving in the offices of first-term Senators during the first nine months of their service.13
- The Report of the Secretary of the Senate reports monies paid directly by the Senate to staff, but does not provide the individual value of other components of compensation, which might include paid leave or employer contributions to various insurance and retirement benefits.
- Pay data provide no insight into the education, work experience, position tenure, full- or part-time status of staff, or other potential explanations for levels of compensation.
- Staff could be based in Washington, DC, state offices, or both.
- Potential differences might exist in the job duties of positions with the same title. Aggregation of pay by job title rests on the assumption that staff with the same title carry out the same or similar tasks. Given the wide discretion congressional employing authorities have in setting the terms and conditions of employment, there may be differences in the duties of similarly titled staff that could have effects on their levels of pay. Acknowledging the imprecision inherent in congressional job titles, an older edition of the Senate Handbook states, "Throughout the Senate, individuals with the same job title perform vastly different duties."14
Data Tables and Visualizations
Tables in this section provide background information on Senate pay practices, comparative data for each position, and detailed data and visualizations for each position. Table 1 provides the maximum payable rates for staff in Senators' offices since 2001 in both nominal (current) and constant 2019 dollars. Constant dollar calculations throughout the report are based on the Consumer Price Index for All Urban Consumers (CPI-U) for various years, expressed in constant 2019 dollars.15
Table 2 provides available percentage changes in median pay in constant 2019 dollars for each of the 16 positions, Members of Congress,16 and salaries paid under the General Schedule in Washington, DC, and surrounding areas, and in the Rest of the United States (RUS) area.17 Table 3 through Table 18 provide tabular pay data for each staff position for FY2001, FY2004, FY2009, and FY2014-FY2018, including data distributed by quartile, including the median, as well as average pay. The numbers of staff for which data were counted are identified as "Number" in the data tables. Staff pay tables also provide a comparison, at various intervals to FY2018, based on data availability, of the cumulative percentage change in median pay for that position, in constant 2019 dollars.
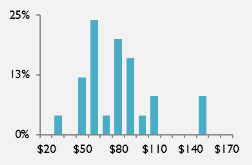
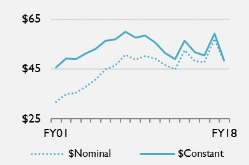
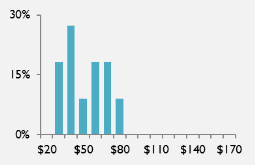
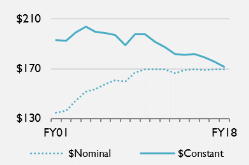
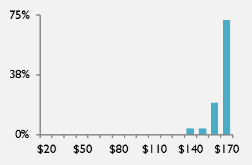
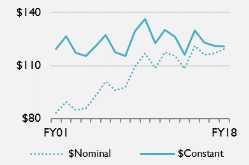
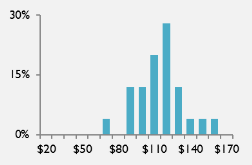
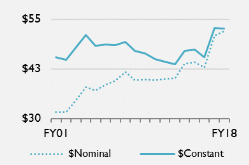
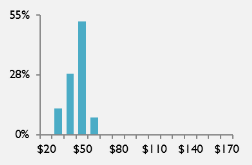
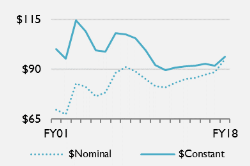
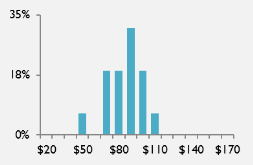
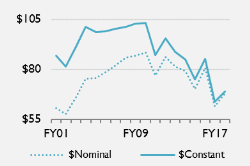
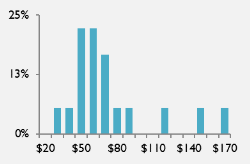
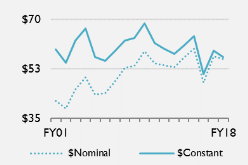
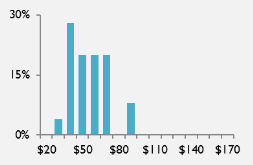
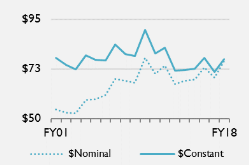
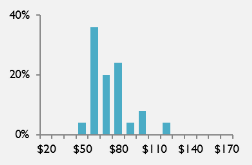
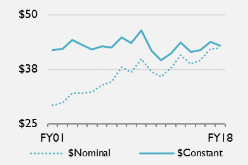
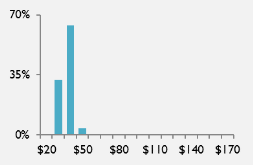
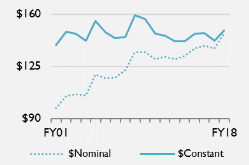
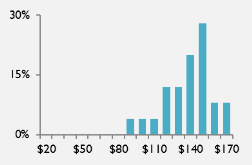
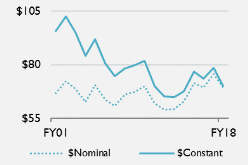
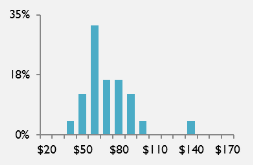
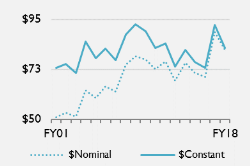
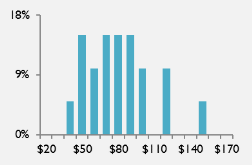
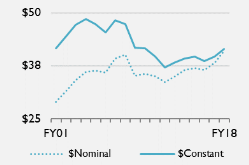
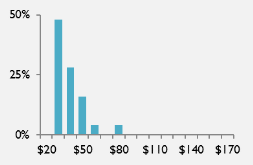
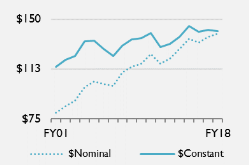
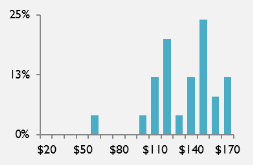
Graphic displays are also included for each position, providing representations of pay from two perspectives, including the following:
- a line graph showing change in median pay, FY2001-FY2018, in nominal (current) and constant 2019 dollars; and
- distributions of FY2018 pay in 2019 dollars, in $10,000 increments.
|
Year |
Nominal $ |
Constant |
||
|
2001 |
|
|
||
|
2002 |
|
|
||
|
2003 |
|
|
||
|
2004 |
|
|
||
|
2005 |
|
|
||
|
2006 |
|
|
||
|
2007 |
|
|
||
|
2008 |
|
|
||
|
2009 |
|
|
||
|
2010 |
|
|
||
|
2011 |
|
|
||
|
2012 |
|
|
||
|
2013 |
|
|
||
|
2014 |
|
|
||
|
2015 |
|
|
||
|
2016 |
|
|
||
|
2017 |
|
|
||
|
2018 |
|
|
||
|
2019 |
|
|
Source: 2 U.S.C. 4575, note, CRS calculations. Detailed information about data sources is available above in "Data Tables and Visualizations."
|
Change Based on Constant, 2019 Dollars |
|||||
|
FY17-FY18 |
FY14-FY18 |
FY09-FY18 |
FY04-FY18 |
FY01-FY18 |
|
|
Administrative Director |
-2.36% |
0.88% |
3.05% |
3.93% |
21.65% |
|
Casework Supervisor |
-3.21% |
3.83% |
-9.81% |
0.30% |
13.49% |
|
Caseworker |
-18.02% |
-13.96% |
-15.64% |
-5.04% |
6.52% |
|
Chief of Staff |
-2.38% |
-5.49% |
-13.27% |
-15.90% |
-11.23% |
|
Communications Director |
-0.38% |
3.84% |
-6.77% |
4.65% |
1.12% |
|
Constituent Services Representative |
-0.18% |
11.96% |
11.96% |
3.28% |
15.97% |
|
Counsel |
4.94% |
5.44% |
-8.64% |
-11.75% |
-3.94% |
|
Executive Assistant |
7.85% |
-19.03% |
-33.13% |
-32.08% |
-20.77% |
|
Field Representative |
-3.86% |
-6.49% |
-10.57% |
-15.00% |
-4.45% |
|
Legislative Assistant |
8.04% |
6.94% |
-1.80% |
-2.27% |
-0.80% |
|
Legislative Correspondent |
-2.13% |
-1.86% |
-1.55% |
-0.33% |
2.21% |
|
Legislative Director |
4.81% |
5.12% |
-6.56% |
4.76% |
7.03% |
|
Press Secretary |
-10.67% |
3.85% |
-12.22% |
-16.61% |
-26.63% |
|
Scheduler |
-11.24% |
1.18% |
-11.48% |
-3.44% |
12.30% |
|
Staff Assistant |
4.68% |
5.63% |
-0.64% |
-14.68% |
-0.35% |
|
State Director |
-0.60% |
2.99% |
4.38% |
5.81% |
23.50% |
|
Members of Congress |
-2.38% |
-5.72% |
-14.56% |
-17.21% |
-15.43% |
|
General Schedule, DC |
-0.14% |
1.66% |
-4.77% |
1.16% |
8.19% |
|
General Schedule, Rest of U.S. |
-0.75% |
-0.46% |
-7.29% |
-5.91% |
-0.34% |
|
Congressional Staff Positions |
|||||
|
Increase |
5 |
11 |
3 |
6 |
9 |
|
Decrease |
11 |
5 |
13 |
10 |
7 |
Source: CRS calculations, based on pay data provided in Table 3-Table 18 for congressional positions in constant, 2019 dollars; CRS Report 97-1011, Salaries of Members of Congress: Recent Actions and Historical Tables, by Ida A. Brudnick, for Members of Congress; and the Office of Personnel Management for federal civilian workers in the District of Columbia and surrounding areas and rest of the U.S., various years. Detailed information about data sources is available above in "Data Tables and Visualizations."
Senate Member Office Staff Pay Tables
|
Interpreting Pay Tables: Statistics Describing Pay Data For each year that data are available, statistical values for staff positions are included in Table 3 through Table 18, including the following:
Statistical Measures Used in Pay Tables
|
|
Nominal, Current $ |
Constant, 2019, $ |
|||||||||||||||||
|
Year |
Number |
Minimum |
25 %ile |
50 %ile Median |
75 %ile |
Maximum |
Average |
Minimum |
25 %ile |
50 %ile Median |
75 %ile |
Maximum |
Average |
|||||
|
FY01 |
10 |
$46,340 |
$61,630 |
$66,542 |
$73,599 |
$76,500 |
$66,200 |
$66,515 |
$88,462 |
$95,512 |
$105,641 |
$109,805 |
$95,020 |
|||||
|
FY04 |
18 |
$33,750 |
$71,408 |
$83,080 |
$100,410 |
$142,968 |
$83,942 |
$45,417 |
$96,093 |
$111,800 |
$135,121 |
$192,392 |
$112,961 |
|||||
|
FY09 |
25 |
$46,459 |
$85,297 |
$95,164 |
$111,170 |
$140,250 |
$96,479 |
$55,048 |
$101,067 |
$112,758 |
$131,723 |
$166,180 |
$114,316 |
|||||
|
Most Recent Five Years |
||||||||||||||||||
|
FY14 |
25 |
$50,937 |
$87,667 |
$107,265 |
$122,484 |
$139,080 |
$103,458 |
$54,696 |
$94,134 |
$115,179 |
$131,521 |
$149,341 |
$111,091 |
|||||
|
FY15 |
25 |
$56,375 |
$97,357 |
$104,433 |
$117,500 |
$150,522 |
$106,212 |
$60,462 |
$104,415 |
$112,005 |
$126,019 |
$161,436 |
$113,913 |
|||||
|
FY16 |
25 |
$40,625 |
$82,276 |
$107,752 |
$123,750 |
$154,035 |
$101,903 |
$43,028 |
$87,142 |
$114,125 |
$131,069 |
$163,145 |
$107,930 |
|||||
|
FY17 |
25 |
$63,667 |
$100,937 |
$114,750 |
$128,875 |
$160,192 |
$114,516 |
$66,025 |
$104,676 |
$119,000 |
$133,648 |
$166,125 |
$118,758 |
|||||
|
FY18 |
25 |
$72,510 |
$102,840 |
$114,778 |
$126,262 |
$161,458 |
$113,389 |
$73,404 |
$104,107 |
$116,192 |
$127,818 |
$163,448 |
$114,786 |
|||||
|
Median Pay |
FY18 Pay Distribution |
Change |
||||||||||||||||
|
|
|
FY17-FY18 FY14-FY18 FY09-FY18 FY04-FY18 FY01-FY18 |
-2.36% 0.88% 3.05% 3.93% 21.65% |
|||||||||||||||
|
Dollars in figures are in thousands. |
||||||||||||||||||
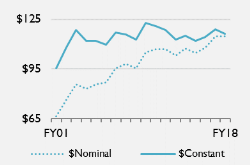
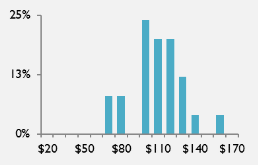
Source: Report of the Secretary of the Senate, as collated by LegiStorm, various years, and CRS calculations. Percentage change in pay is based on the change in median pay (expressed in constant, March 2019 dollars) for the periods noted. In the visualizations, position pay information based on constant 2019 dollars in thousands of dollars, or change in those levels, are presented in solid blue. Detailed information about data sources is available above in "Data Tables and Visualizations." Data provided here are partial; complete data, FY2001-FY2018, are available to congressional requesters upon request.
|
Nominal, Current $ |
Constant, 2019, $ |
||||||||||||||||
|
Year |
Number |
Minimum |
25 %ile |
50 %ile Median |
75 %ile |
Maximum |
Average |
Minimum |
25 %ile |
50 %ile Median |
75 %ile |
Maximum |
Average |
||||
|
FY01 |
25 |
$23,928 |
$45,479 |
$51,828 |
$56,550 |
$83,000 |
$50,594 |
$34,345 |
$65,279 |
$74,391 |
$81,169 |
$119,135 |
$72,621 |
||||
|
FY04 |
25 |
$27,500 |
$54,125 |
$62,549 |
$70,954 |
$88,679 |
$60,683 |
$37,007 |
$72,836 |
$84,172 |
$95,483 |
$119,335 |
$81,661 |
||||
|
FY09 |
25 |
$55,750 |
$69,349 |
$79,000 |
$87,875 |
$109,356 |
$79,269 |
$66,057 |
$82,171 |
$93,606 |
$104,122 |
$129,575 |
$93,924 |
||||
|
Most Recent Five Years |
|||||||||||||||||
|
FY14 |
25 |
$35,500 |
$66,427 |
$75,719 |
$86,800 |
$113,875 |
$74,974 |
$38,119 |
$71,328 |
$81,306 |
$93,204 |
$122,276 |
$80,505 |
||||
|
FY15 |
25 |
$37,829 |
$64,000 |
$79,500 |
$86,788 |
$118,500 |
$79,051 |
$40,572 |
$68,640 |
$85,264 |
$93,081 |
$127,092 |
$84,782 |
||||
|
FY16 |
25 |
$52,698 |
$67,264 |
$77,821 |
$90,251 |
$127,500 |
$81,928 |
$55,815 |
$71,242 |
$82,424 |
$95,588 |
$135,041 |
$86,773 |
||||
|
FY17 |
25 |
$46,219 |
$70,103 |
$84,106 |
$90,815 |
$115,167 |
$81,630 |
$47,931 |
$72,699 |
$87,221 |
$94,178 |
$119,432 |
$84,653 |
||||
|
FY18 |
25 |
$36,500 |
$62,017 |
$83,395 |
$96,754 |
$155,750 |
$84,682 |
$36,950 |
$62,782 |
$84,423 |
$97,947 |
$157,670 |
$85,726 |
||||
|
Median Pay |
FY18 Pay Distribution |
Change |
|||||||||||||||
|
|
|
FY17-FY18 FY14-FY18 FY09-FY18 FY04-FY18 FY01-FY18 |
-3.21% 3.83% -9.81% 0.30% 13.49% |
||||||||||||||
|
Dollars in figures are in thousands. |
|||||||||||||||||

Source: Report of the Secretary of the Senate, as collated by LegiStorm, various years, and CRS calculations. Percentage change in pay is based on the change in median pay (expressed in constant, March 2019 dollars) for the periods noted. In the visualizations, position pay information based on constant 2019 dollars in thousands of dollars, or change in those levels, are presented in solid blue. Detailed information about data sources is available above in "Data Tables and Visualizations." Data provided here are partial; complete data, FY2001-FY2018, are available to congressional requesters upon request.
|
Nominal, Current $ |
Constant, 2019, $ |
||||||||||||||||
|
Year |
Number |
Minimum |
25 %ile |
50 %ile Median |
75 %ile |
Maximum |
Average |
Minimum |
25 %ile |
50 %ile Median |
75 %ile |
Maximum |
Average |
||||
|
FY01 |
25 |
$23,227 |
$27,873 |
$31,781 |
$39,900 |
$61,039 |
$34,342 |
$33,339 |
$40,007 |
$45,617 |
$57,271 |
$87,613 |
$49,293 |
||||
|
FY04 |
25 |
$25,775 |
$31,250 |
$38,024 |
$41,982 |
$57,700 |
$38,761 |
$34,686 |
$42,053 |
$51,168 |
$56,495 |
$77,647 |
$52,160 |
||||
|
FY09 |
20 |
$37,837 |
$41,875 |
$48,611 |
$55,411 |
$92,988 |
$52,042 |
$44,833 |
$49,617 |
$57,599 |
$65,656 |
$110,180 |
$61,664 |
||||
|
Most Recent Five Years |
|||||||||||||||||
|
FY14 |
24 |
$21,167 |
$41,340 |
$52,598 |
$62,125 |
$81,250 |
$53,187 |
$22,728 |
$44,390 |
$56,478 |
$66,708 |
$87,244 |
$57,111 |
||||
|
FY15 |
21 |
$21,167 |
$42,083 |
$48,250 |
$66,485 |
$80,000 |
$52,439 |
$22,701 |
$45,135 |
$51,748 |
$71,306 |
$85,800 |
$56,241 |
||||
|
FY16 |
25 |
$23,355 |
$39,583 |
$47,607 |
$62,955 |
$86,458 |
$50,554 |
$24,736 |
$41,924 |
$50,423 |
$66,678 |
$91,572 |
$53,543 |
||||
|
FY17 |
21 |
$35,000 |
$41,958 |
$57,156 |
$68,523 |
$87,500 |
$56,058 |
$36,296 |
$43,512 |
$59,273 |
$71,061 |
$90,741 |
$58,135 |
||||
|
FY18 |
22 |
$31,000 |
$43,437 |
$48,000 |
$64,850 |
$70,000 |
$51,829 |
$31,382 |
$43,973 |
$48,592 |
$65,649 |
$70,863 |
$52,468 |
||||
|
Median Pay |
FY18 Pay Distribution |
Change |
|||||||||||||||
|
|
|
FY17-FY18 FY14-FY18 FY09-FY18 FY04-FY18 FY01-FY18 |
-18.02% -13.96% -15.64% -5.04% 6.52% |
||||||||||||||
|
Dollars in figures are in thousands. |
|||||||||||||||||
Source: Report of the Secretary of the Senate, as collated by LegiStorm, various years, and CRS calculations. Percentage change in pay is based on the change in median pay (expressed in constant, March 2019 dollars) for the periods noted. In the visualizations, position pay information based on constant 2019 dollars in thousands of dollars, or change in those levels, are presented in solid blue. Detailed information about data sources is available above in "Data Tables and Visualizations." Data provided here are partial; complete data, FY2001-FY2018, are available to congressional requesters upon request.
|
Nominal, Current $ |
Constant, 2019, $ |
||||||||||||||||
|
Year |
Number |
Minimum |
25 %ile |
50 %ile Median |
75 %ile |
Maximum |
Average |
Minimum |
25 %ile |
50 %ile Median |
75 %ile |
Maximum |
Average |
||||
|
FY01 |
25 |
$103,657 |
$124,270 |
$134,630 |
$138,000 |
$139,609 |
$130,841 |
$148,784 |
$178,372 |
$193,242 |
$198,079 |
$200,389 |
$187,803 |
||||
|
FY04 |
25 |
$100,000 |
$142,000 |
$151,576 |
$152,526 |
$152,709 |
$145,165 |
$134,570 |
$191,089 |
$203,975 |
$205,253 |
$205,500 |
$195,347 |
||||
|
FY09 |
25 |
$147,960 |
$165,305 |
$166,926 |
$167,305 |
$167,305 |
$164,532 |
$175,316 |
$195,867 |
$197,789 |
$198,237 |
$198,237 |
$194,952 |
||||
|
Most Recent Five Years |
|||||||||||||||||
|
FY14 |
25 |
$141,050 |
$161,214 |
$169,042 |
$169,459 |
$169,459 |
$164,932 |
$151,456 |
$173,108 |
$181,514 |
$181,961 |
$181,961 |
$177,100 |
||||
|
FY15 |
25 |
$102,800 |
$167,000 |
$169,459 |
$169,459 |
$169,459 |
$162,671 |
$110,253 |
$179,108 |
$181,746 |
$181,746 |
$181,746 |
$174,466 |
||||
|
FY16 |
25 |
$154,500 |
$166,000 |
$169,000 |
$169,459 |
$169,459 |
$166,857 |
$163,638 |
$175,818 |
$178,995 |
$179,481 |
$179,481 |
$176,725 |
||||
|
FY17 |
25 |
$126,775 |
$165,743 |
$169,459 |
$169,459 |
$169,459 |
$165,680 |
$131,470 |
$171,882 |
$175,735 |
$175,735 |
$175,735 |
$171,816 |
||||
|
FY18 |
25 |
$143,815 |
$166,957 |
$169,459 |
$169,459 |
$169,459 |
$166,646 |
$145,587 |
$169,015 |
$171,548 |
$171,548 |
$171,548 |
$168,700 |
||||
|
Median Pay |
FY18 Pay Distribution |
Change |
|||||||||||||||
|
|
|
FY17-FY18 FY14-FY18 FY09-FY18 FY04-FY18 FY01-FY18 |
-2.38% -5.49% -13.27% -15.90% -11.23% |
||||||||||||||
|
Dollars in figures are in thousands. |
|||||||||||||||||
Source: Report of the Secretary of the Senate, as collated by LegiStorm, various years, and CRS calculations. Percentage change in pay is based on the change in median pay (expressed in constant, March 2019 dollars) for the periods noted. In the visualizations, position pay information based on constant 2019 dollars in thousands of dollars, or change in those levels, are presented in solid blue. Detailed information about data sources is available above in "Data Tables and Visualizations." Data provided here are partial; complete data, FY2001-FY2018, are available to congressional requesters upon request.
|
Nominal, Current $ |
Constant, 2019, $ |
||||||||||||||||
|
Year |
Number |
Minimum |
25 %ile |
50 %ile Median |
75 %ile |
Maximum |
Average |
Minimum |
25 %ile |
50 %ile Median |
75 %ile |
Maximum |
Average |
||||
|
FY01 |
25 |
$42,189 |
$72,441 |
$83,186 |
$94,455 |
$128,974 |
$83,784 |
$60,556 |
$103,979 |
$119,402 |
$135,577 |
$185,124 |
$120,259 |
||||
|
FY04 |
25 |
$56,908 |
$76,001 |
$85,733 |
$110,160 |
$142,726 |
$92,741 |
$76,581 |
$102,275 |
$115,371 |
$148,242 |
$192,065 |
$124,801 |
||||
|
FY09 |
25 |
$75,400 |
$92,333 |
$109,296 |
$121,277 |
$156,687 |
$111,197 |
$89,340 |
$109,404 |
$129,503 |
$143,699 |
$185,656 |
$131,756 |
||||
|
Most Recent Five Years |
|||||||||||||||||
|
FY14 |
25 |
$80,000 |
$99,500 |
$108,288 |
$122,836 |
$157,137 |
$112,337 |
$85,902 |
$106,841 |
$116,277 |
$131,899 |
$168,730 |
$120,625 |
||||
|
FY15 |
25 |
$95,675 |
$102,000 |
$121,065 |
$132,797 |
$169,459 |
$122,710 |
$102,612 |
$109,395 |
$129,843 |
$142,426 |
$181,746 |
$131,607 |
||||
|
FY16 |
25 |
$75,344 |
$105,871 |
$116,250 |
$127,500 |
$148,750 |
$116,696 |
$79,800 |
$112,133 |
$123,126 |
$135,041 |
$157,548 |
$123,598 |
||||
|
FY17 |
25 |
$92,000 |
$106,875 |
$116,875 |
$128,000 |
$155,000 |
$118,145 |
$95,408 |
$110,833 |
$121,204 |
$132,741 |
$160,741 |
$122,520 |
||||
|
FY18 |
25 |
$76,717 |
$107,000 |
$119,270 |
$126,960 |
$163,275 |
$117,207 |
$77,663 |
$108,319 |
$120,740 |
$128,525 |
$165,288 |
$118,652 |
||||
|
Median Pay |
FY18 Pay Distribution |
Change |
|||||||||||||||
|
|
|
FY17-FY18 FY14-FY18 FY09-FY18 FY04-FY18 FY01-FY18 |
-0.38% 3.84% -6.77% 4.65% 1.12% |
||||||||||||||
|
Dollars in figures are in thousands. |
|||||||||||||||||
Source: Report of the Secretary of the Senate, as collated by LegiStorm, various years, and CRS calculations. Percentage change in pay is based on the change in median pay (expressed in constant, March 2019 dollars) for the periods noted. In the visualizations, position pay information based on constant 2019 dollars in thousands of dollars, or change in those levels, are presented in solid blue. Detailed information about data sources is available above in "Data Tables and Visualizations." Data provided here are partial; complete data, FY2001-FY2018, are available to congressional requesters upon request.
|
Nominal, Current $ |
Constant, 2019, $ |
||||||||||||||||
|
Year |
Number |
Minimum |
25 %ile |
50 %ile Median |
75 %ile |
Maximum |
Average |
Minimum |
25 %ile |
50 %ile Median |
75 %ile |
Maximum |
Average |
||||
|
FY01 |
19 |
$23,802 |
$26,801 |
$31,611 |
$37,367 |
$45,180 |
$31,778 |
$34,165 |
$38,468 |
$45,373 |
$53,635 |
$64,850 |
$45,613 |
||||
|
FY04 |
25 |
$23,410 |
$32,031 |
$37,863 |
$42,000 |
$58,719 |
$37,753 |
$31,503 |
$43,104 |
$50,951 |
$56,519 |
$79,018 |
$50,804 |
||||
|
FY09 |
25 |
$19,583 |
$31,125 |
$39,667 |
$44,000 |
$71,208 |
$40,223 |
$23,204 |
$36,880 |
$47,000 |
$52,135 |
$84,374 |
$47,659 |
||||
|
Most Recent Five Years |
|||||||||||||||||
|
FY14 |
25 |
$30,463 |
$37,175 |
$43,771 |
$48,000 |
$89,179 |
$45,446 |
$32,710 |
$39,918 |
$47,001 |
$51,541 |
$95,758 |
$48,799 |
||||
|
FY15 |
25 |
$31,500 |
$38,652 |
$44,125 |
$47,960 |
$83,084 |
$44,926 |
$33,784 |
$41,454 |
$47,324 |
$51,438 |
$89,108 |
$48,184 |
||||
|
FY16 |
25 |
$26,659 |
$38,806 |
$42,852 |
$46,500 |
$69,229 |
$43,881 |
$28,236 |
$41,101 |
$45,387 |
$49,250 |
$73,324 |
$46,476 |
||||
|
FY17 |
25 |
$30,900 |
$44,456 |
$50,833 |
$54,187 |
$83,325 |
$49,863 |
$32,044 |
$46,103 |
$52,716 |
$56,194 |
$86,411 |
$51,710 |
||||
|
FY18 |
25 |
$36,154 |
$41,310 |
$51,980 |
$56,500 |
$64,167 |
$49,749 |
$36,600 |
$41,819 |
$52,620 |
$57,196 |
$64,958 |
$50,362 |
||||
|
Median Pay |
FY18 Pay Distribution |
Change |
|||||||||||||||
|
|
|
FY17-FY18 FY14-FY18 FY09-FY18 FY04-FY18 FY01-FY18 |
-0.18% 11.96% 11.96% 3.28% 15.97% |
||||||||||||||
|
Dollars in figures are in thousands. |
|||||||||||||||||
Source: Report of the Secretary of the Senate, as collated by LegiStorm, various years, and CRS calculations. Percentage change in pay is based on the change in median pay (expressed in constant, March 2019 dollars) for the periods noted. In the visualizations, position pay information based on constant 2019 dollars in thousands of dollars, or change in those levels, are presented in solid blue. Detailed information about data sources is available above in "Data Tables and Visualizations." Data provided here are partial; complete data, FY2001-FY2018, are available to congressional requesters upon request.
|
Nominal, Current $ |
Constant, 2019, $ |
||||||||||||||||
|
Year |
Number |
Minimum |
25 %ile |
50 %ile Median |
75 %ile |
Maximum |
Average |
Minimum |
25 %ile |
50 %ile Median |
75 %ile |
Maximum |
Average |
||||
|
FY01 |
15 |
$25,000 |
$61,723 |
$69,875 |
$74,691 |
$93,833 |
$67,125 |
$35,884 |
$88,595 |
$100,296 |
$107,209 |
$134,684 |
$96,349 |
||||
|
FY04 |
25 |
$45,000 |
$66,952 |
$81,127 |
$91,992 |
$152,526 |
$84,890 |
$60,556 |
$90,097 |
$109,173 |
$123,793 |
$205,253 |
$114,236 |
||||
|
FY09 |
23 |
$45,000 |
$77,313 |
$89,000 |
$98,542 |
$129,788 |
$88,826 |
$53,320 |
$91,607 |
$105,455 |
$116,761 |
$153,784 |
$105,248 |
||||
|
Most Recent Five Years |
|||||||||||||||||
|
FY14 |
25 |
$53,250 |
$77,000 |
$85,100 |
$101,734 |
$153,120 |
$90,638 |
$57,179 |
$82,681 |
$91,378 |
$109,240 |
$164,417 |
$97,325 |
||||
|
FY15 |
25 |
$58,000 |
$79,417 |
$85,669 |
$113,333 |
$154,659 |
$93,777 |
$62,205 |
$85,175 |
$91,881 |
$121,551 |
$165,873 |
$100,576 |
||||
|
FY16 |
25 |
$52,500 |
$73,646 |
$87,500 |
$97,083 |
$134,932 |
$88,773 |
$55,605 |
$78,002 |
$92,675 |
$102,825 |
$142,913 |
$94,024 |
||||
|
FY17 |
25 |
$66,500 |
$84,728 |
$88,535 |
$96,169 |
$142,271 |
$93,268 |
$68,963 |
$87,866 |
$91,814 |
$99,731 |
$147,540 |
$96,722 |
||||
|
FY18 |
16 |
$55,000 |
$80,221 |
$95,172 |
$99,808 |
$114,392 |
$90,265 |
$55,678 |
$81,210 |
$96,345 |
$101,038 |
$115,802 |
$91,377 |
||||
|
Median Pay |
FY18 Pay Distribution |
Change |
|||||||||||||||
|
|
|
FY17-FY18 FY14-FY18 FY09-FY18 FY04-FY18 FY01-FY18 |
4.94% 5.44% -8.64% -11.75% -3.94% |
||||||||||||||
|
Dollars in figures are in thousands. |
|||||||||||||||||
Source: Report of the Secretary of the Senate, as collated by LegiStorm, various years, and CRS calculations. Percentage change in pay is based on the change in median pay (expressed in constant, March 2019 dollars) for the periods noted. In the visualizations, position pay information based on constant 2019 dollars in thousands of dollars, or change in those levels, are presented in solid blue. Detailed information about data sources is available above in "Data Tables and Visualizations." Data provided here are partial; complete data, FY2001-FY2018, are available to congressional requesters upon request.
|
Nominal, Current $ |
Constant, 2019, $ |
||||||||||||||||
|
Year |
Number |
Minimum |
25 %ile |
50 %ile Median |
75 %ile |
Maximum |
Average |
Minimum |
25 %ile |
50 %ile Median |
75 %ile |
Maximum |
Average |
||||
|
FY01 |
25 |
$36,000 |
$51,486 |
$60,480 |
$79,529 |
$124,583 |
$65,378 |
$51,673 |
$73,901 |
$86,810 |
$114,153 |
$178,822 |
$93,841 |
||||
|
FY04 |
25 |
$32,262 |
$60,167 |
$75,250 |
$89,299 |
$152,709 |
$76,616 |
$43,415 |
$80,967 |
$101,263 |
$120,170 |
$205,500 |
$103,102 |
||||
|
FY09 |
25 |
$42,272 |
$67,151 |
$86,817 |
$105,750 |
$167,305 |
$91,183 |
$50,087 |
$79,566 |
$102,868 |
$125,302 |
$198,237 |
$108,042 |
||||
|
Most Recent Five Years |
|||||||||||||||||
|
FY14 |
23 |
$32,750 |
$59,062 |
$79,110 |
$111,741 |
$169,459 |
$85,535 |
$35,166 |
$63,420 |
$84,947 |
$119,985 |
$181,961 |
$91,845 |
||||
|
FY15 |
21 |
$42,983 |
$55,375 |
$70,000 |
$107,544 |
$169,459 |
$84,837 |
$46,100 |
$59,390 |
$75,075 |
$115,342 |
$181,746 |
$90,988 |
||||
|
FY16 |
21 |
$33,752 |
$60,657 |
$80,559 |
$126,000 |
$169,459 |
$92,915 |
$35,749 |
$64,245 |
$85,323 |
$133,452 |
$179,481 |
$98,411 |
||||
|
FY17 |
19 |
$36,750 |
$48,099 |
$61,500 |
$100,426 |
$169,459 |
$79,059 |
$38,111 |
$49,881 |
$63,778 |
$104,146 |
$175,735 |
$81,987 |
||||
|
FY18 |
18 |
$38,250 |
$57,811 |
$67,946 |
$79,018 |
$169,459 |
$78,477 |
$38,721 |
$58,524 |
$68,783 |
$79,992 |
$171,548 |
$79,445 |
||||
|
Median Pay |
FY18 Pay Distribution |
Change |
|||||||||||||||
|
|
|
FY17-FY18 FY14-FY18 FY09-FY18 FY04-FY18 FY01-FY18 |
7.85% -19.03% -33.13% -32.08% -20.77% |
||||||||||||||
|
Dollars in figures are in thousands. |
|||||||||||||||||
Source: Report of the Secretary of the Senate, as collated by LegiStorm, various years, and CRS calculations. Percentage change in pay is based on the change in median pay (expressed in constant, March 2019 dollars) for the periods noted. In the visualizations, position pay information based on constant 2019 dollars in thousands of dollars, or change in those levels, are presented in solid blue. Detailed information about data sources is available above in "Data Tables and Visualizations." Data provided here are partial; complete data, FY2001-FY2018, are available to congressional requesters upon request.
|
Nominal, Current $ |
Constant, 2019, $ |
||||||||||||||||
|
Year |
Number |
Minimum |
25 %ile |
50 %ile Median |
75 %ile |
Maximum |
Average |
Minimum |
25 %ile |
50 %ile Median |
75 %ile |
Maximum |
Average |
||||
|
FY01 |
25 |
$20,519 |
$35,839 |
$41,337 |
$48,744 |
$70,466 |
$42,290 |
$29,452 |
$51,441 |
$59,333 |
$69,965 |
$101,144 |
$60,701 |
||||
|
FY04 |
25 |
$21,518 |
$33,793 |
$49,562 |
$54,449 |
$87,500 |
$46,831 |
$28,956 |
$45,474 |
$66,696 |
$73,272 |
$117,748 |
$63,021 |
||||
|
FY09 |
25 |
$29,495 |
$45,378 |
$53,500 |
$65,434 |
$91,750 |
$55,405 |
$34,949 |
$53,768 |
$63,391 |
$77,532 |
$108,713 |
$65,649 |
||||
|
Most Recent Five Years |
|||||||||||||||||
|
FY14 |
25 |
$34,833 |
$50,247 |
$56,458 |
$73,500 |
$93,948 |
$60,554 |
$37,403 |
$53,955 |
$60,624 |
$78,923 |
$100,880 |
$65,022 |
||||
|
FY15 |
25 |
$35,615 |
$44,500 |
$59,678 |
$73,000 |
$89,458 |
$58,997 |
$38,198 |
$47,726 |
$64,004 |
$78,293 |
$95,944 |
$63,275 |
||||
|
FY16 |
24 |
$33,476 |
$41,076 |
$47,833 |
$69,750 |
$98,125 |
$55,119 |
$35,456 |
$43,505 |
$50,662 |
$73,875 |
$103,929 |
$58,379 |
||||
|
FY17 |
25 |
$37,691 |
$48,375 |
$56,863 |
$68,437 |
$87,500 |
$58,369 |
$39,087 |
$50,167 |
$58,969 |
$70,972 |
$90,741 |
$60,531 |
||||
|
FY18 |
25 |
$38,083 |
$47,000 |
$56,000 |
$70,625 |
$93,042 |
$60,296 |
$38,553 |
$47,579 |
$56,690 |
$71,495 |
$94,188 |
$61,039 |
||||
|
Median Pay |
FY18 Pay Distribution |
Change |
|||||||||||||||
|
|
|
FY17-FY18 FY14-FY18 FY09-FY18 FY04-FY18 FY01-FY18 |
-3.86% -6.49% -10.57% -15.00% -4.45% |
||||||||||||||
|
Dollars in figures are in thousands. |
|||||||||||||||||
Source: Report of the Secretary of the Senate, as collated by LegiStorm, various years, and CRS calculations. Percentage change in pay is based on the change in median pay (expressed in constant, March 2019 dollars) for the periods noted. In the visualizations, position pay information based on constant 2019 dollars in thousands of dollars, or change in those levels, are presented in solid blue. Detailed information about data sources is available above in "Data Tables and Visualizations." Data provided here are partial; complete data, FY2001-FY2018, are available to congressional requesters upon request.
|
Nominal, Current $ |
Constant, 2019, $ |
||||||||||||||||
|
Year |
Number |
Minimum |
25 %ile |
50 %ile Median |
75 %ile |
Maximum |
Average |
Minimum |
25 %ile |
50 %ile Median |
75 %ile |
Maximum |
Average |
||||
|
FY01 |
25 |
$31,916 |
$46,440 |
$54,032 |
$65,250 |
$83,533 |
$55,641 |
$45,811 |
$66,658 |
$77,555 |
$93,657 |
$119,899 |
$79,865 |
||||
|
FY04 |
25 |
$30,203 |
$49,871 |
$58,500 |
$76,436 |
$135,000 |
$66,495 |
$40,644 |
$67,111 |
$78,723 |
$102,859 |
$181,669 |
$89,481 |
||||
|
FY09 |
25 |
$50,042 |
$57,228 |
$66,125 |
$77,500 |
$106,916 |
$69,293 |
$59,294 |
$67,809 |
$78,351 |
$91,829 |
$126,683 |
$82,104 |
||||
|
Most Recent Five Years |
|||||||||||||||||
|
FY14 |
25 |
$30,333 |
$61,667 |
$67,000 |
$73,331 |
$87,500 |
$66,806 |
$32,571 |
$66,216 |
$71,943 |
$78,741 |
$93,955 |
$71,735 |
||||
|
FY15 |
25 |
$58,755 |
$65,000 |
$67,667 |
$76,083 |
$103,375 |
$71,209 |
$63,015 |
$69,713 |
$72,573 |
$81,600 |
$110,870 |
$76,372 |
||||
|
FY16 |
25 |
$50,667 |
$60,000 |
$73,000 |
$79,619 |
$106,383 |
$71,792 |
$53,663 |
$63,548 |
$77,317 |
$84,328 |
$112,675 |
$76,038 |
||||
|
FY17 |
25 |
$44,420 |
$55,000 |
$68,667 |
$87,875 |
$120,901 |
$71,667 |
$46,066 |
$57,037 |
$71,210 |
$91,130 |
$125,379 |
$74,321 |
||||
|
FY18 |
25 |
$53,333 |
$65,500 |
$76,000 |
$84,254 |
$122,901 |
$76,770 |
$53,991 |
$66,307 |
$76,937 |
$85,292 |
$124,415 |
$77,716 |
||||
|
Median Pay |
FY18 Pay Distribution |
Change |
|||||||||||||||
|
|
|
FY17-FY18 FY14-FY18 FY09-FY18 FY04-FY18 FY01-FY18 |
8.04% 6.94% -1.80% -2.27% -0.80% |
||||||||||||||
|
Dollars in figures are in thousands. |
|||||||||||||||||
Source: Report of the Secretary of the Senate, as collated by LegiStorm, various years, and CRS calculations. Percentage change in pay is based on the change in median pay (expressed in constant, March 2019 dollars) for the periods noted. In the visualizations, position pay information based on constant 2019 dollars in thousands of dollars, or change in those levels, are presented in solid blue. Detailed information about data sources is available above in "Data Tables and Visualizations." Data provided here are partial; complete data, FY2001-FY2018, are available to congressional requesters upon request.
|
Nominal, Current $ |
Constant, 2019, $ |
||||||||||||||||
|
Year |
Number |
Minimum |
25 %ile |
50 %ile Median |
75 %ile |
Maximum |
Average |
Minimum |
25 %ile |
50 %ile Median |
75 %ile |
Maximum |
Average |
||||
|
FY01 |
25 |
$22,344 |
$27,496 |
$29,250 |
$32,500 |
$41,250 |
$30,560 |
$32,071 |
$39,467 |
$41,984 |
$46,649 |
$59,208 |
$43,865 |
||||
|
FY04 |
25 |
$25,327 |
$29,779 |
$31,994 |
$35,320 |
$56,467 |
$34,350 |
$34,083 |
$40,074 |
$43,055 |
$47,530 |
$75,987 |
$46,224 |
||||
|
FY09 |
25 |
$30,156 |
$35,381 |
$36,786 |
$40,530 |
$49,750 |
$38,093 |
$35,731 |
$41,922 |
$43,587 |
$48,024 |
$58,948 |
$45,136 |
||||
|
Most Recent Five Years |
|||||||||||||||||
|
FY14 |
25 |
$32,388 |
$35,806 |
$40,722 |
$41,904 |
$58,333 |
$40,412 |
$34,778 |
$38,448 |
$43,726 |
$44,996 |
$62,637 |
$43,393 |
||||
|
FY15 |
25 |
$33,875 |
$36,875 |
$38,668 |
$42,000 |
$52,000 |
$39,794 |
$36,331 |
$39,549 |
$41,471 |
$45,045 |
$55,770 |
$42,679 |
||||
|
FY16 |
25 |
$34,265 |
$37,348 |
$39,589 |
$43,650 |
$45,500 |
$39,947 |
$36,292 |
$39,556 |
$41,930 |
$46,231 |
$48,191 |
$42,309 |
||||
|
FY17 |
25 |
$30,000 |
$39,000 |
$42,281 |
$45,156 |
$62,250 |
$42,879 |
$31,111 |
$40,444 |
$43,847 |
$46,829 |
$64,556 |
$44,468 |
||||
|
FY18 |
25 |
$33,855 |
$38,400 |
$42,389 |
$45,687 |
$52,458 |
$42,409 |
$34,273 |
$38,873 |
$42,911 |
$46,250 |
$53,104 |
$42,931 |
||||
|
Median Pay |
FY18 Pay Distribution |
Change |
|||||||||||||||
|
|
|
FY17-FY18 FY14-FY18 FY09-FY18 FY04-FY18 FY01-FY18 |
-2.13% -1.86% -1.55% -0.33% 2.21% |
||||||||||||||
|
Dollars in figures are in thousands. |
|||||||||||||||||
Source: Report of the Secretary of the Senate, as collated by LegiStorm, various years, and CRS calculations. Percentage change in pay is based on the change in median pay (expressed in constant, March 2019 dollars) for the periods noted. In the visualizations, position pay information based on constant 2019 dollars in thousands of dollars, or change in those levels, are presented in solid blue. Detailed information about data sources is available above in "Data Tables and Visualizations." Data provided here are partial; complete data, FY2001-FY2018, are available to congressional requesters upon request.
|
Nominal, Current $ |
Constant, 2019, $ |
||||||||||||||||
|
Year |
Number |
Minimum |
25 %ile |
50 %ile Median |
75 %ile |
Maximum |
Average |
Minimum |
25 %ile |
50 %ile Median |
75 %ile |
Maximum |
Average |
||||
|
FY01 |
25 |
$70,417 |
$90,429 |
$96,988 |
$106,671 |
$138,459 |
$97,697 |
$101,073 |
$129,798 |
$139,213 |
$153,111 |
$198,738 |
$140,231 |
||||
|
FY04 |
25 |
$67,401 |
$92,751 |
$105,695 |
$124,167 |
$140,245 |
$107,803 |
$90,702 |
$124,815 |
$142,233 |
$167,090 |
$188,727 |
$145,071 |
||||
|
FY09 |
25 |
$98,743 |
$122,544 |
$134,583 |
$150,654 |
$167,305 |
$135,702 |
$116,999 |
$145,201 |
$159,466 |
$178,508 |
$198,237 |
$160,791 |
||||
|
Most Recent Five Years |
|||||||||||||||||
|
FY14 |
25 |
$100,000 |
$118,750 |
$132,000 |
$139,569 |
$155,750 |
$128,618 |
$107,378 |
$127,511 |
$141,739 |
$149,866 |
$167,241 |
$138,107 |
||||
|
FY15 |
25 |
$106,583 |
$119,135 |
$137,000 |
$141,479 |
$162,625 |
$132,473 |
$114,311 |
$127,773 |
$146,933 |
$151,737 |
$174,416 |
$142,078 |
||||
|
FY16 |
25 |
$101,375 |
$125,380 |
$138,923 |
$151,167 |
$165,647 |
$138,102 |
$107,371 |
$132,795 |
$147,140 |
$160,107 |
$175,444 |
$146,270 |
||||
|
FY17 |
25 |
$104,667 |
$125,000 |
$137,083 |
$146,007 |
$168,679 |
$136,547 |
$108,543 |
$129,630 |
$142,161 |
$151,415 |
$174,926 |
$141,605 |
||||
|
FY18 |
25 |
$97,122 |
$130,001 |
$147,188 |
$150,588 |
$169,459 |
$141,493 |
$98,319 |
$131,603 |
$149,002 |
$152,444 |
$171,548 |
$143,237 |
||||
|
Median Pay |
FY18 Pay Distribution |
Change |
|||||||||||||||
|
|
|
FY17-FY18 FY14-FY18 FY09-FY18 FY04-FY18 FY01-FY18 |
4.81% 5.12% -6.56% 4.76% 7.03% |
||||||||||||||
|
Dollars in figures are in thousands. |
|||||||||||||||||
Source: Report of the Secretary of the Senate, as collated by LegiStorm, various years, and CRS calculations. Percentage change in pay is based on the change in median pay (expressed in constant, March 2019 dollars) for the periods noted. In the visualizations, position pay information based on constant 2019 dollars in thousands of dollars, or change in those levels, are presented in solid blue. Detailed information about data sources is available above in "Data Tables and Visualizations." Data provided here are partial; complete data, FY2001-FY2018, are available to congressional requesters upon request.
|
Nominal, Current $ |
Constant, 2019, $ |
||||||||||||||||
|
Year |
Number |
Minimum |
25 %ile |
50 %ile Median |
75 %ile |
Maximum |
Average |
Minimum |
25 %ile |
50 %ile Median |
75 %ile |
Maximum |
Average |
||||
|
FY01 |
25 |
$21,120 |
$48,125 |
$66,625 |
$77,143 |
$92,242 |
$64,528 |
$30,315 |
$69,077 |
$95,631 |
$110,728 |
$132,401 |
$92,621 |
||||
|
FY04 |
25 |
$41,098 |
$51,150 |
$62,523 |
$80,917 |
$109,734 |
$67,127 |
$55,305 |
$68,832 |
$84,137 |
$108,890 |
$147,668 |
$90,333 |
||||
|
FY09 |
25 |
$38,452 |
$59,500 |
$67,453 |
$82,852 |
$131,000 |
$71,592 |
$45,561 |
$70,501 |
$79,924 |
$98,171 |
$155,220 |
$84,829 |
||||
|
Most Recent Five Years |
|||||||||||||||||
|
FY14 |
25 |
$50,333 |
$56,916 |
$62,914 |
$78,182 |
$130,000 |
$71,385 |
$54,047 |
$61,115 |
$67,556 |
$83,951 |
$139,591 |
$76,652 |
||||
|
FY15 |
25 |
$53,610 |
$62,833 |
$71,650 |
$78,802 |
$127,813 |
$73,754 |
$57,497 |
$67,389 |
$76,845 |
$84,516 |
$137,080 |
$79,102 |
||||
|
FY16 |
25 |
$53,771 |
$65,937 |
$69,375 |
$76,856 |
$132,125 |
$75,205 |
$56,951 |
$69,837 |
$73,478 |
$81,401 |
$139,939 |
$79,653 |
||||
|
FY17 |
25 |
$52,389 |
$66,000 |
$75,737 |
$88,000 |
$132,192 |
$79,425 |
$54,329 |
$68,444 |
$78,543 |
$91,259 |
$137,088 |
$82,367 |
||||
|
FY18 |
25 |
$48,093 |
$61,197 |
$69,306 |
$87,000 |
$142,404 |
$74,966 |
$48,686 |
$61,951 |
$70,160 |
$88,072 |
$144,160 |
$75,890 |
||||
|
Median Pay |
FY18 Pay Distribution |
Change |
|||||||||||||||
|
|
|
FY17-FY18 FY14-FY18 FY09-FY18 FY04-FY18 FY01-FY18 |
-10.67% 3.85% -12.22% -16.61% -26.63% |
||||||||||||||
|
Dollars in figures are in thousands. |
|||||||||||||||||
Source: Report of the Secretary of the Senate, as collated by LegiStorm, various years, and CRS calculations. Percentage change in pay is based on the change in median pay (expressed in constant, March 2019 dollars) for the periods noted. In the visualizations, position pay information based on constant 2019 dollars in thousands of dollars, or change in those levels, are presented in solid blue. Detailed information about data sources is available above in "Data Tables and Visualizations." Data provided here are partial; complete data, FY2001-FY2018, are available to congressional requesters upon request.
|
Nominal, Current $ |
Constant, 2019, $ |
||||||||||||||||
|
Year |
Number |
Minimum |
25 %ile |
50 %ile Median |
75 %ile |
Maximum |
Average |
Minimum |
25 %ile |
50 %ile Median |
75 %ile |
Maximum |
Average |
||||
|
FY01 |
25 |
$29,690 |
$42,167 |
$50,917 |
$54,670 |
$75,308 |
$50,705 |
$42,616 |
$60,524 |
$73,084 |
$78,471 |
$108,094 |
$72,780 |
||||
|
FY04 |
25 |
$39,583 |
$48,250 |
$63,167 |
$77,292 |
$120,280 |
$64,745 |
$53,267 |
$64,930 |
$85,003 |
$104,011 |
$161,860 |
$87,128 |
||||
|
FY09 |
25 |
$28,468 |
$55,653 |
$78,250 |
$87,372 |
$162,986 |
$76,762 |
$33,731 |
$65,942 |
$92,717 |
$103,526 |
$193,119 |
$90,955 |
||||
|
Most Recent Five Years |
|||||||||||||||||
|
FY14 |
25 |
$35,262 |
$58,432 |
$75,546 |
$91,500 |
$131,812 |
$77,111 |
$37,864 |
$62,743 |
$81,120 |
$98,251 |
$141,537 |
$82,800 |
||||
|
FY15 |
25 |
$42,925 |
$52,596 |
$70,708 |
$90,000 |
$134,921 |
$76,226 |
$46,038 |
$56,410 |
$75,835 |
$96,525 |
$144,703 |
$81,753 |
||||
|
FY16 |
20 |
$39,716 |
$56,775 |
$69,017 |
$88,068 |
$137,897 |
$74,235 |
$42,065 |
$60,133 |
$73,099 |
$93,276 |
$146,053 |
$78,626 |
||||
|
FY17 |
15 |
$45,335 |
$71,778 |
$89,167 |
$98,415 |
$140,632 |
$87,838 |
$47,014 |
$74,437 |
$92,469 |
$102,060 |
$145,841 |
$91,092 |
||||
|
FY18 |
20 |
$45,268 |
$67,356 |
$81,076 |
$93,322 |
$151,993 |
$84,916 |
$45,826 |
$68,186 |
$82,075 |
$94,472 |
$153,867 |
$85,963 |
||||
|
Median Pay |
FY18 Pay Distribution |
Change |
|||||||||||||||
|
|
|
FY17-FY18 FY14-FY18 FY09-FY18 FY04-FY18 FY01-FY18 |
-11.24% 1.18% -11.48% -3.44% 12.30% |
||||||||||||||
|
Dollars in figures are in thousands. |
|||||||||||||||||
Source: Report of the Secretary of the Senate, as collated by LegiStorm, various years, and CRS calculations. Percentage change in pay is based on the change in median pay (expressed in constant, March 2019 dollars) for the periods noted. In the visualizations, position pay information based on constant 2019 dollars in thousands of dollars, or change in those levels, are presented in solid blue. Detailed information about data sources is available above in "Data Tables and Visualizations." Data provided here are partial; complete data, FY2001-FY2018, are available to congressional requesters upon request.
|
Nominal, Current $ |
Constant, 2019, $ |
||||||||||||||||
|
Year |
Number |
Minimum |
25 %ile |
50 %ile Median |
75 %ile |
Maximum |
Average |
Minimum |
25 %ile |
50 %ile Median |
75 %ile |
Maximum |
Average |
||||
|
FY01 |
25 |
$22,000 |
$26,875 |
$28,985 |
$33,008 |
$51,275 |
$31,205 |
$31,578 |
$38,575 |
$41,604 |
$47,379 |
$73,598 |
$44,791 |
||||
|
FY04 |
25 |
$21,000 |
$28,792 |
$36,107 |
$44,142 |
$62,917 |
$36,668 |
$28,260 |
$38,745 |
$48,590 |
$59,402 |
$84,667 |
$49,344 |
||||
|
FY09 |
25 |
$18,683 |
$32,777 |
$35,216 |
$40,529 |
$56,500 |
$37,386 |
$22,137 |
$38,837 |
$41,727 |
$48,022 |
$66,946 |
$44,298 |
||||
|
Most Recent Five Years |
|||||||||||||||||
|
FY14 |
25 |
$28,114 |
$34,010 |
$36,551 |
$43,093 |
$75,000 |
$39,920 |
$30,188 |
$36,519 |
$39,247 |
$46,272 |
$80,533 |
$42,865 |
||||
|
FY15 |
25 |
$27,025 |
$32,375 |
$37,000 |
$40,917 |
$75,000 |
$38,956 |
$28,984 |
$34,722 |
$39,683 |
$43,883 |
$80,438 |
$41,780 |
||||
|
FY16 |
25 |
$24,401 |
$34,500 |
$36,500 |
$43,417 |
$64,083 |
$39,479 |
$25,844 |
$36,540 |
$38,659 |
$45,984 |
$67,873 |
$41,814 |
||||
|
FY17 |
25 |
$32,624 |
$34,937 |
$38,192 |
$39,578 |
$46,000 |
$37,750 |
$33,832 |
$36,231 |
$39,606 |
$41,044 |
$47,704 |
$39,148 |
||||
|
FY18 |
25 |
$30,000 |
$37,412 |
$40,953 |
$46,333 |
$87,950 |
$43,898 |
$30,370 |
$37,873 |
$41,458 |
$46,904 |
$89,034 |
$44,439 |
||||
|
Median Pay |
FY18 Pay Distribution |
Change |
|||||||||||||||
|
|
|
FY17-FY18 FY14-FY18 FY09-FY18 FY04-FY18 FY01-FY18 |
4.68% 5.63% -0.64% -14.68% -0.35% |
||||||||||||||
|
Dollars in figures are in thousands. |
|||||||||||||||||
Source: Report of the Secretary of the Senate, as collated by LegiStorm, various years, and CRS calculations. Percentage change in pay is based on the change in median pay (expressed in constant, March 2019 dollars) for the periods noted. In the visualizations, position pay information based on constant 2019 dollars in thousands of dollars, or change in those levels, are presented in solid blue. Detailed information about data sources is available above in "Data Tables and Visualizations." Data provided here are partial; complete data, FY2001-FY2018, are available to congressional requesters upon request.
|
Nominal, Current $ |
Constant, 2019, $ |
||||||||||||||||
|
Year |
Number |
Minimum |
25 %ile |
50 %ile Median |
75 %ile |
Maximum |
Average |
Minimum |
25 %ile |
50 %ile Median |
75 %ile |
Maximum |
Average |
||||
|
FY01 |
25 |
$56,000 |
$74,089 |
$79,521 |
$91,065 |
$122,533 |
$82,660 |
$80,380 |
$106,344 |
$114,141 |
$130,710 |
$175,879 |
$118,647 |
||||
|
FY04 |
25 |
$70,000 |
$83,598 |
$99,000 |
$105,396 |
$123,126 |
$96,097 |
$94,199 |
$112,498 |
$133,224 |
$141,832 |
$165,690 |
$129,318 |
||||
|
FY09 |
25 |
$81,132 |
$103,750 |
$113,975 |
$129,500 |
$167,305 |
$118,890 |
$96,132 |
$122,932 |
$135,047 |
$153,443 |
$198,237 |
$140,871 |
||||
|
Most Recent Five Years |
|||||||||||||||||
|
FY14 |
25 |
$78,833 |
$115,125 |
$127,467 |
$152,545 |
$169,459 |
$132,613 |
$84,649 |
$123,619 |
$136,871 |
$163,800 |
$181,961 |
$142,397 |
||||
|
FY15 |
25 |
$93,500 |
$111,817 |
$135,250 |
$157,094 |
$169,459 |
$134,582 |
$100,279 |
$119,924 |
$145,056 |
$168,484 |
$181,746 |
$144,340 |
||||
|
FY16 |
25 |
$77,042 |
$117,500 |
$132,563 |
$144,500 |
$169,459 |
$131,694 |
$81,598 |
$124,449 |
$140,403 |
$153,046 |
$179,481 |
$139,483 |
||||
|
FY17 |
25 |
$105,208 |
$116,883 |
$136,750 |
$148,000 |
$169,459 |
$134,059 |
$109,105 |
$121,212 |
$141,815 |
$153,482 |
$175,735 |
$139,024 |
||||
|
FY18 |
25 |
$60,750 |
$121,667 |
$139,250 |
$154,046 |
$169,459 |
$137,312 |
$61,499 |
$123,166 |
$140,966 |
$155,944 |
$171,548 |
$139,004 |
||||
|
Median Pay |
FY18 Pay Distribution |
Change |
|||||||||||||||
|
|
|
FY17-FY18 FY14-FY18 FY09-FY18 FY04-FY18 FY01-FY18 |
-0.60% 2.99% 4.38% 5.81% 23.50% |
||||||||||||||
|
Dollars in figures are in thousands. |
|||||||||||||||||
Source: Report of the Secretary of the Senate, as collated by LegiStorm, various years, and CRS calculations. Percentage change in pay is based on the change in median pay (expressed in constant, March 2019 dollars) for the periods noted. In the visualizations, position pay information based on constant 2019 dollars in thousands of dollars, or change in those levels, are presented in solid blue. Detailed information about data sources is available above in "Data Tables and Visualizations." Data provided here are partial; complete data, FY2001-FY2018, are available to congressional requesters upon request.