Introduction to LIHEAP
The Low Income Home Energy Assistance Program (LIHEAP) is a block grant program administered by the Department of Health and Human Services (HHS) under which the federal government gives annual grants to states, the District of Columbia, U.S. territories and commonwealths, and Indian tribal organizations to operate multi-component home energy assistance programs for needy households. Established in 1981 by Title XXVI of P.L. 97-35, the Omnibus Budget Reconciliation Act, LIHEAP has been reauthorized and amended a number of times, most recently in 2005, when P.L. 109-58, the Energy Policy Act, authorized annual regular LIHEAP funds at $5.1 billion per year from FY2005 through FY2007.1
The federal LIHEAP statute has very broad guidelines, with many decisions regarding the program's operation made by the states. Recipients may be helped with their heating and cooling costs, receive crisis assistance, have weatherizing expenses paid, or receive other aid designed to reduce their home energy needs. Households with incomes up to 150% of the federal poverty income guidelines or, if greater, 60% of the state median income, are federally eligible for LIHEAP benefits. States may adopt lower income limits, but no household with income below 110% of the poverty guidelines may be considered ineligible.
The LIHEAP statute provides for two types of program funding: regular funds—sometimes referred to as block grant funds—and emergency contingency funds. Regular funds are allotted to states on the basis of the LIHEAP statutory formula, which was enacted as part of the Human Services Reauthorization Act of 1984 (P.L. 98-558).2 The way in which regular funds are allocated to states depends on the amount of funds appropriated by Congress. The second type of LIHEAP funds, emergency contingency funds, last appropriated in FY2011, may be released and allotted to one or more states at the discretion of the President and the Secretary of HHS.3 The funds may be released at any point in the fiscal year to meet additional home energy assistance needs created by a natural disaster or other emergency.4
For more information on LIHEAP more generally, see CRS Report RL31865, LIHEAP: Program and Funding, by Libby Perl. The remainder of this report discusses only the history and methods of distributing regular LIHEAP funds to the states. Funds for tribes are included in each state's formula allocations and are distributed at the state level based on eligible tribal members. Territories receive funds separately as a percentage set aside of regular funds, so neither tribes nor territories are included in the formula discussion.
LIHEAP Formula Basics
The current statutory LIHEAP formula was enacted in 1984 as part of P.L. 98-558, the Human Services Reauthorization Act. The statutory formula replaced a formula from a predecessor program to LIHEAP, the Low Income Energy Assistance Program (LIEAP), which was active for one year (FY1981) prior to enactment of LIHEAP. The LIEAP formula emphasized the heating needs of cold-weather states. When Congress changed the LIHEAP formula in 1984, there were two primary differences from the previous formula: home heating needs were not emphasized to the same degree, and the law provided that HHS use the most recent data available to calculate allotments (the LIEAP formula used static data to distribute funds to the states).
For more information about both the history of energy assistance formulas from the 1970s through enactment of LIHEAP as well as the enactment of the statutory formula, see Appendix D.
What Is the "Old" LIHEAP Formula?
The term "old" LIHEAP formula refers to the way in which regular funds were distributed using the formula under LIEAP, which was then adopted by LIHEAP when it was enacted. Congress directed that LIEAP state allocations be determined using a complex combination of alternate formulas and factors that included residential energy expenditures, a measure of "coldness" called heating degree days, and household income. Further, as specified in law, the data for each factor were either from a particular year or measured a change over a particular period of time, so the data inputs did not change. See Table D-2 for LIEAP formula data.
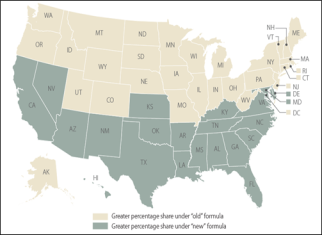
The result of the LIEAP combination of formulas was that each state was assigned a static percentage of funds that did not change from one year to the next. For example, Minnesota received approximately 4.0% of total LIHEAP funds under this formula, and Florida received not-quite 1.4% of the total. See column (a) of Table 1 for each state's share of funds under the "old" LIHEAP formula.
What is the "New" LIHEAP Formula?
The term "new" LIHEAP formula refers to the way in which funds are to be distributed via the statutory formula enacted as part of P.L. 98-558. The statute provides that each state's share of funds is to be based on low-income household expenditures on home energy in the state. See the statutory language in the text box, below.
Based on the statutory language, HHS calculates heating and cooling consumption and expenditures by low-income households in each state, with the numbers updated each year. (See "Calculating the New Formula Percentages," later in this report, for more details about how the formula rates are calculated.) Each state's share is then based on the ratio of low-income household expenditures on home energy for the state to all expenditures of low-income households in the country. For example, when formula data were updated in FY2019, Minnesota's share of funds under the "new" formula was approximately 1.9% of the total and Florida's was about 4.4%. See column (b) of Table 1 for FY2019 formula shares.
However, unlike under the "old" formula, states do not necessarily receive their "new" formula percentage share of funds. As can be seen from the Minnesota and Florida examples, the implementation of the "new" LIHEAP formula meant that some states saw their share of funding reduced, while others saw their share increased. As a result, Congress included in the statutory formula two "hold harmless" provisions to make sure that states that saw their shares of total funds decrease were prevented from dramatic drops in funding. The hold harmless provisions operate so that states that gain the most funding have their share reduced to compensate states that lose funding. See "Using the "New" Formula Percentages to Allocate Funds to the States," later in this report, for a more detailed description about how the hold-harmless provisions operate.
|
LIHEAP Formula Statutory Language
Unlike the allocation formulas under LIEAP and the other energy assistance programs that preceded LIHEAP, which dictated the use of specific variables to determine allotments to the states, the LIHEAP formula as drafted by Congress gives more general guidance to HHS.5
(A) a State's allotment percentage is the percentage which expenditures for home energy by low-income households in that State bears to such expenditures in all States, except that States which thereby receive the greatest proportional increase in allotments by reason of the application of this paragraph from the amount they received pursuant to P.L. 98-139 [the FY1984 appropriation] shall have their allotments reduced to the extent necessary to ensure that—
…
(ii) no State for fiscal year 1986 and thereafter shall receive less than the amount of funds the State would have received in fiscal year 1984 if the appropriations for this subchapter for fiscal year 1984 had been $1,975,000,000, and
(B) any State whose allotment percentage out of funds available to States from a total appropriation of $2,250,000,000 would be less than 1 percent, shall not, in any year when total appropriations equal or exceed $2,250,000,000, have its allotment percentage reduced from the percentage it would receive from a total appropriation of $2,140,000,000.
|
The LIHEAP Formula and Congressional Appropriations
In the 25 years after the enactment of the "new" LIHEAP formula, Congress, with few exceptions, did not appropriate sufficient regular funds to require use of "new" formula data. Because of the hold-harmless provisions in the statutory formula, appropriations must exceed approximately $2 billion before the "new" formula percentages are used. During these years, the "old" formula percentages (found in column (a) of Table 1) were used to distribute LIHEAP funds to the states.
Starting in FY2009, appropriations for LIHEAP regular funds have exceeded $2 billion, ranging from $3.3 billion to $4.5 billion over the last 10 years. However, the "new" formula has not operated as is provided for in the statute. Instead, Congress has directed, in appropriations language, that a portion of funds be distributed using the "new" formula, and the remainder using the "old" formula. For example, in FY2019 P.L. 115-245 provided that $716 million be distributed according to the "new" formula, and the remainder, about $2.96 billion (after deducting funds for the territories and training and technical assistance), distributed using the "old" formula percentages. For allocations to the states from FY2009-FY2019, see Appendix C.
The next section of this report ("Determining State LIHEAP Allotments Using the "New" Formula") goes into additional detail about how the "new" formula operates, while Appendix D explains more about the history of the "old" LIHEAP formula.
Determining State LIHEAP Allotments Using the "New" Formula
The LIHEAP statutory formula provides for three different methods to calculate each state's allotment of regular LIHEAP funds. The calculation method used to determine state allotments depends upon the size of the appropriation in a particular year.
- If the annual appropriation level is at or below the equivalent of a hypothetical FY1984 appropriation of $1.975 billion, then the "old "LIHEAP formula percentages apply.
- If appropriations exceed a hypothetical FY1984 appropriation of $1.975 billion, then "new" formula percentages apply and are used to calculate state allotments. To calculate the new formula percentages, HHS determines the heating and cooling costs of low-income households in each state. If the appropriation is less than $2.25 billion, the new formula percentages are used together with a hold-harmless level that prevents states from falling below the amount they would have received at the hypothetical FY1984 appropriations level.
- Finally, if appropriations equal or exceed $2.25 billion, the "new" percentages apply, as does the hold-harmless level, and, in addition, a hold-harmless rate increases the "new" formula percentage for certain states.
This section describes the steps involved in allocating LIHEAP funds to the states under each of the appropriations triggers.
Calculating the New Formula Percentages
The LIHEAP formula uses the home energy expenditures of low-income households in each state as a first step in determining the amount of total regular funds that each state will receive.6 Specifically, this means estimating the amount of money that all low-income households (as defined by the LIHEAP statute)7 in each state spend on heating and cooling from all energy sources. This method accounts for variations in heating and cooling needs of the states, the types of energy used, energy prices, and the low-income population and their heating and cooling methods. Further, as mentioned in the previous section, the "new" formula requires HHS to determine allocations "on the basis of the most recent satisfactory data available to the Secretary."8 HHS updates these data annually. The most recent data were provided to CRS in 2019.
The process for capturing the expenditures of low-income households involves the following steps:
- Total Residential Energy Consumption. The first step in calculating new formula rates is determining total residential energy consumption for each heating and cooling source in every state. Residential energy consumption is usually measured in terms of the total amount of British Thermal Units (Btus) used in private households and generally captures energy used for space and water heating, cooling, lighting, refrigeration, cooking, and the energy needed to operate appliances. The most recent data used in calculating LIHEAP formula rates come from the 2016 Energy Information Administration (EIA) State Energy Data System consumption estimates.
- Temperature Variation. The next step in determining the formula rates involves adjusting the amount of energy consumed for each fuel source by temperature variation in each state. This is done by using a ratio consisting of the 30-year average heating and cooling degree day data to each state's share of the most recent year's average heating and cooling degree days. A heating degree day measures the extent to which a day's average temperature falls below 65°F and a cooling degree day measures the extent to which a day's average temperature rises above 65°F.9 For example, a day with an average temperature of 50°F results in a measure of 15 heating degree days; a day with an average temperature of 80°F results in a measure of 15 cooling degree days. The purpose of the adjustment to fuel consumption is to account for abnormally warm or cool years, where energy usage might attain extreme values. This information is collected by the National Oceanic and Atmospheric Administration. The most recent year's average heating and cooling degree day data are from 2016, and the 30-year average was computed from 1971 to 2000.
- Heating and Cooling Consumption. As mentioned above, total residential energy consumption encompasses other uses in addition to heating and cooling (e.g., operation of appliances). So the next step in calculating LIHEAP formula rates is to derive the portion of fuel consumed specifically to heat and cool homes as opposed to other uses. The EIA, as part of the Residential Energy Consumption Survey (RECS), uses an "end use estimation methodology" to estimate the amount of fuel used for heating and cooling (among other uses). The most recent information on heating and cooling consumption comes from the 2009 RECS.10 HHS adjusts the EIA heating and cooling consumption estimates using heating degree day and cooling degree day data.
- Low-Income Household Heating and Cooling Consumption. After estimating heating and cooling consumption for all households, the next step is to calculate heating and cooling consumption in Btus for low-income households. HHS uses Census data to determine fuel sources used by low-income households. The most recent information on low-income households and the fuel sources they use comes from the American Community Survey five-year estimates for 2012-2016. In addition, low-income consumption data are adjusted to account for the fact that low-income households might use more or less of a fuel source than is used by households on average. This is done using consumption data from the 2009 RECS.
- Total Spending on Heating and Cooling. To arrive at the amount of money that low-income households spend on heating and cooling, the number of Btus used by low-income households that were estimated in the previous step are multiplied by the average fuel price for each fuel source. The total amount spent on heating and cooling by low-income households for each fuel source is then added together to arrive at total spending for each state. Regional energy price variation can be significant, and the formula takes expected expenditure differences into account. This information is collected by the EIA and published in the State Energy Data System Consumption, Price, and Expenditure Estimates.11 The most recent price data used to calculate formula rates are from 2016.
- New Formula Percentage. Finally, these expenditure data are used to estimate the amount spent by low-income households on heating and cooling in each state relative to the amount spent by low-income households on heating and cooling in all states. The calculated proportion becomes the new formula percentage for each state. Table 1 at the end of this section shows both the percentages under the "old" formula (column (a)) and the most recent "new" formula percentages (column (b)), received by CRS from HHS in 2019. To see how the formula rates for each state have changed in recent years, see Table 2.
These new formula percentages are used to allocate LIHEAP funds to the states if the annual appropriation exceeds the equivalent of a hypothetical FY1984 appropriation of $1.975 billion. However, they do not represent the exact percentage of funds that all states will receive under the new formula. The ultimate allotments are determined after application of both the hold-harmless level and hold-harmless rate, described in the next section. The new percentages are the starting point for determining how funds will be allocated to the states.
Using the "New" Formula Percentages to Allocate Funds to the States
The LIHEAP "new" formula percentages that HHS calculates using the most recent satisfactory data available do not necessarily represent the percentage of funds that states will receive. State allotments depend upon the application of the two hold-harmless provisions in the LIHEAP statute. Some states must have their share of funds ratably reduced in order to hold harmless those states that would, but for the hold-harmless provisions, lose funds. Other states see a gain in their share of funds because they benefit from the hold-harmless provisions. The application of the hold-harmless provisions depends upon the size of the appropriation for a given fiscal year. These appropriation level triggers are described below.
"Old" Formula: Appropriations at or Below $1.975 Billion
The LIHEAP statute does not contain an explicit trigger for the "new" formula rates to be used. However, the statute specifies that states must receive no less than "the amount of funds the State would have received in fiscal year 1984 if the appropriations for this subchapter for fiscal year 1984 had been $1,975,000,000." As a result, up to this appropriation level, states receive the same percentage of funds that they would have received at a given appropriation level under the "old" LIHEAP formula.12
The FY1984 appropriation of $1.975 billion referred to in the LIHEAP statute is hypothetical because this was not the amount actually appropriated in FY1984. The actual FY1984 appropriation was $2.075 billion. In addition, the current year appropriation that is "equivalent to" a hypothetical FY1984 appropriation of $1.975 billion is not exactly $1.975 billion. In FY1984, with the exception of funds provided to the territories, all LIHEAP regular funds were distributed to the states. Since then, two other funds have become part of the regular fund distribution. These are funds for training and technical assistance (TTA) and for the leveraging incentive (LI) grants (which includes REACH grants) to the states. This means that an appropriation that is equivalent to a hypothetical FY1984 appropriation of $1.975 billion must account for these new funds. For example, in FY2019, Congress appropriated $2.988 million for TTA and no funding for LI /REACH, so the equivalent of an FY1984 appropriation of $1.975 billion is approximately $1.978 billion.13
The LIHEAP formula in FY1984 distributed funds by giving states the same percentage of funds that they received in FY1981 under the predecessor program, the Low Income Energy Assistance Program (LIEAP). Table 1 shows rates under the old formula in column (a). For example, at an appropriation at or below the equivalent of a hypothetical FY1984 appropriation of $1.975 billion, Alabama would receive 0.86% of total funds, Alaska would receive 0.55% of total funds, and so on. Table A-1, column (a), reports the dollar amount of funds that each state would have received in FY1984 had the regular fund appropriation been $1.975 billion. For comparison purposes, the dollar amounts also assume that funds for the territories would be 0.5% of the total, a change made by HHS beginning with the FY2014 appropriation.14
"New" Formula with Hold-Harmless Level: Appropriations Between $1.975 Billion and $2.25 Billion
If the regular LIHEAP appropriation exceeds the equivalent of a hypothetical FY1984 appropriation of $1.975 billion for the fiscal year, all funds are to be distributed under a different methodology, using the new set of percentages described earlier. In addition, a hold-harmless level applies to ensure that certain states do not fall below the amount of funds they would have received at the equivalent of a hypothetical FY1984 appropriation of $1.975 billion.
Table 1 shows whether a state benefits from the hold-harmless level. This is indicated by a "Y" in column (c), while the dollar amount of funds those states receive by being held harmless appears in column (d). For example, Alabama is not held harmless, while Colorado is held harmless. The dollar amount of funds that Colorado receives pursuant to the hold-harmless level is $31.613 million. But for the hold-harmless level, Colorado would receive less than this dollar amount at its new formula percentage at certain appropriation levels. Eventually, when appropriations increase sufficiently, the percentage of funds under the new formula for hold-harmless states will exceed their hold harmless amounts and they will begin to receive their new percentage of funds. This appropriation level varies for each state. For example, at lower appropriation levels, the $31.613 million hold-harmless level for Colorado exceeds the state's new percentage share of 1.438% of total funds. However, by the time appropriations reach $2.25 billion, Colorado's new percentage share exceeds $31.613 million and the state begins to receive funds at the new percentage. Eventually, many states will receive the percentage of funds at their new percentage.15
The hold-harmless level is achieved by reducing the allocation of funds to states with the greatest proportional gains under the new formula percentages.16 For example, under the most recent LIHEAP formula percentages, states with the greatest proportional gains were Nevada, Arizona, and Texas. Depending on the appropriation level, these states (and others with the greatest gains) may then have their allotments reduced to hold harmless the states that would otherwise see reduced benefits. So although these states with the greatest proportional gains will see their LIHEAP allotments increase under the new formula, their allotments may not increase to reach their new formula rates (column (b) of Table 1).
Columns (b) and (c) of Table A-1 show estimated allotments to the states at hypothetical appropriations levels between $1.975 billion and $2.25 billion. Column (b) shows the estimated allotment of funds that each state would receive when the regular fund appropriation is at $2.14 billion and column (c) shows the estimated allotment of funds when the regular fund appropriation is just under $2.25 billion ($2,249,999,999).
"New" Formula with Hold-Harmless Level and Rate: Appropriations At or Above $2.25 Billion
The LIHEAP statute stipulates additional requirements in the method for distributing funds when the appropriation is at or above $2.25 billion. At this level, the hold-harmless level still applies, but, in addition, a new hold-harmless rate is applied. Specifically, for all appropriation levels at or above $2.25 billion, states that would have received less than 1% of a total $2.25 billion appropriation must be allocated the percentage they would have received at a $2.14 billion appropriation level.17 (This assumes the percentage at $2.14 billion is greater than the percentage originally calculated at the hypothetical $2.25 billion appropriation; this is not true for all states that receive less than 1% of the $2.25 billion appropriation.) Then that state will receive the percentage share of funds it would have received at $2.14 billion for all appropriation levels at or above $2.25 billion. This hold-harmless rate ensures a state specific share of the total available funds.
As with the hold-harmless level, the allocations to the states with the greatest proportional gains are then ratably reduced again until there is no funding shortfall. Column (e) of Table 1 shows which states benefit from the hold-harmless rate, indicated by a "Y," while column (f) shows the proportion of funds that those states receive. For example, Idaho benefits from the hold-harmless rate and receives 0.580% of the total appropriation when appropriations are at or above $2.25 billion.
The application of the hold-harmless rate creates another layer of discontinuity in the allocation rates. States that are ratably reduced see their allocations at $2.25 billion fall below the amount they would receive at $2.249 billion, while states that benefit from the hold-harmless rate see their funding jump up slightly. Columns (d) through (i) of Table A-1 in Appendix A show estimated allotments to states at various hypothetical appropriations levels at or above $2.25 billion.
Implementation of the "New" LIHEAP Formula
Until FY2006, appropriations for regular LIHEAP funds had only exceeded the equivalent of a hypothetical FY1984 appropriation of $1.975 billion in 1985 and 1986; thereafter, from FY1987 through FY2005, and again in FY2007, states continued to receive the same percentage of LIHEAP funds that they received under the program's predecessor, LIEAP (see column (a) of Table 1 for these percentages). In FY2006, funds were distributed under the "new" LIHEAP formula when Congress appropriated $2.48 billion in regular funds for the program. In FY2008, perhaps due to an oversight, the new formula was again used to distribute funds. The FY2008 Consolidated Appropriations Act (P.L. 110-161) failed to authorize a set-aside called leveraging incentive grants. As a result, the funds for those grants were added to the LIHEAP regular funds, triggering use of new formula data.18 In FY2009, the Consolidated Security, Disaster Assistance, and Continuing Appropriations Act (P.L. 110-329) appropriated $4.51 billion in regular funds. However, the law further specified that $840 million be distributed according to the "new" LIHEAP formula, with the remaining $3.67 billion distributed according to the percentages of the "old" formula established by LIEAP. From FY2010 through the present, Congress has continued to appropriate funds using a version of a split between the "old" and "new" formulas. See Table C-1 in Appendix C of this report for the distribution of funds to the states from FY2009 through FY2019.
Table 1. Low-Income Home Energy Program (LIHEAP): "Old" and "New" Allotment Percentages by State, FY2019
|
|
|
|
Hold-Harmless Levela
|
Hold-Harmless Rate
|
|
State
|
"Old" Allotment Percentage (%)
(a)
|
"New" Allotment Percentage (%)
(b)
|
State Held Harmless?
(c)
|
Hold-Harmless Level
($Millions) (d)
|
State Held Harmless?
(e)
|
Hold-Harmless Rate (%)
(f)
|
|
Alabama
|
0.860
|
1.719
|
N
|
—
|
N
|
—
|
|
Alaska
|
0.549
|
0.438
|
Y
|
10.828
|
Y
|
0.507
|
|
Arizona
|
0.416
|
1.543
|
N
|
—
|
N
|
—
|
|
Arkansas
|
0.656
|
0.904
|
N
|
—
|
N
|
—
|
|
California
|
4.614
|
5.991
|
N
|
—
|
N
|
—
|
|
Colorado
|
1.609
|
1.438
|
Y
|
31.729
|
N
|
—
|
|
Connecticut
|
2.099
|
2.069
|
Y
|
41.392
|
N
|
—
|
|
Delaware
|
0.279
|
0.383
|
N
|
—
|
N
|
—
|
|
District of Columbia
|
0.326
|
0.193
|
Y
|
6.428
|
Y
|
0.301
|
|
Florida
|
1.361
|
4.372
|
N
|
—
|
N
|
—
|
|
Georgia
|
1.076
|
3.312
|
N
|
—
|
N
|
—
|
|
Hawaii
|
0.108
|
0.148
|
N
|
—
|
N
|
—
|
|
Idaho
|
0.628
|
0.362
|
Y
|
12.376
|
Y
|
0.580
|
|
Illinois
|
5.809
|
4.361
|
Y
|
114.565
|
N
|
—
|
|
Indiana
|
2.630
|
1.786
|
Y
|
51.872
|
N
|
—
|
|
Iowa
|
1.864
|
0.978
|
Y
|
36.762
|
N
|
—
|
|
Kansas
|
0.856
|
1.053
|
N
|
—
|
N
|
—
|
|
Kentucky
|
1.369
|
1.546
|
N
|
—
|
N
|
—
|
|
Louisiana
|
0.879
|
1.587
|
N
|
—
|
N
|
—
|
|
Maine
|
1.360
|
0.936
|
Y
|
26.815
|
N
|
—
|
|
Maryland
|
1.607
|
2.371
|
N
|
—
|
N
|
—
|
|
Massachusetts
|
4.198
|
3.606
|
Y
|
82.797
|
N
|
—
|
|
Michigan
|
5.515
|
4.249
|
Y
|
108.770
|
N
|
—
|
|
Minnesota
|
3.973
|
1.855
|
Y
|
78.363
|
N
|
—
|
|
Mississippi
|
0.737
|
0.938
|
N
|
—
|
N
|
—
|
|
Missouri
|
2.320
|
2.173
|
Y
|
45.762
|
N
|
—
|
|
Montana
|
0.736
|
0.342
|
Y
|
14.517
|
Y
|
0.680
|
|
Nebraska
|
0.922
|
0.504
|
Y
|
18.180
|
Y
|
0.852
|
|
Nevada
|
0.195
|
0.726
|
N
|
—
|
N
|
—
|
|
New Hampshire
|
0.795
|
0.731
|
Y
|
15.672
|
Y
|
0.734
|
|
New Jersey
|
3.897
|
3.247
|
Y
|
76.865
|
N
|
—
|
|
New Mexico
|
0.521
|
0.595
|
N
|
—
|
N
|
—
|
|
New York
|
12.725
|
8.539
|
Y
|
250.974
|
N
|
—
|
|
North Carolina
|
1.896
|
3.000
|
N
|
—
|
N
|
—
|
|
North Dakota
|
0.800
|
0.242
|
Y
|
15.770
|
Y
|
0.739
|
|
Ohio
|
5.139
|
3.957
|
Y
|
101.350
|
N
|
—
|
|
Oklahoma
|
0.791
|
1.338
|
N
|
—
|
N
|
—
|
|
Oregon
|
1.247
|
0.843
|
Y
|
24.591
|
N
|
—
|
|
Pennsylvania
|
6.835
|
5.278
|
Y
|
134.810
|
N
|
—
|
|
Rhode Island
|
0.691
|
0.628
|
Y
|
13.629
|
Y
|
0.639
|
|
South Carolina
|
0.683
|
1.458
|
N
|
—
|
N
|
—
|
|
South Dakota
|
0.649
|
0.237
|
Y
|
12.808
|
Y
|
0.600
|
|
Tennessee
|
1.386
|
1.952
|
N
|
—
|
N
|
—
|
|
Texas
|
2.264
|
7.831
|
N
|
—
|
N
|
—
|
|
Utah
|
0.748
|
0.588
|
Y
|
14.745
|
Y
|
0.691
|
|
Vermont
|
0.596
|
0.461
|
Y
|
11.747
|
Y
|
0.550
|
|
Virginia
|
1.957
|
2.703
|
N
|
—
|
N
|
—
|
|
Washington
|
2.051
|
1.513
|
Y
|
40.450
|
N
|
—
|
|
West Virginia
|
0.906
|
0.793
|
Y
|
17.864
|
Y
|
0.837
|
|
Wisconsin
|
3.576
|
1.991
|
Y
|
70.538
|
N
|
—
|
|
Wyoming
|
0.299
|
0.194
|
Y
|
5.903
|
Y
|
0.277
|
Source: New allotment percentages were provided to CRS by HHS in 2019. Information in columns (c) through (f) are based on CRS calculations using the new allotment percentages. The calculations for the hold-harmless level assume that no funds would be allocated for training and technical assistance and that the territorial allotments are the same percentage they were in FY1984. However, in calculating whether the hold-harmless rate applies, it is assumed that approximately $3 million would be provided for training and technical assistance, and 0.5% of funds for the territories.
Notes: The actual percentage of total regular funds each state receives at funding levels above $1.975 billion may differ from the new formula percentages due to the hold-harmless provisions and the ratable reductions of some states to cover shortfall from these hold-harmless provisions.
a. The states that benefit from the hold-harmless level vary depending on the amount appropriated for LIHEAP regular funds. The states listed here benefit from the hold-harmless level when appropriations just exceed the equivalent of an FY1984 appropriation of $1.975 billion.
Table 2. Recent State Allotment Percentages Under the "New" LIHEAP Formula
(Fiscal years indicate when new formula rates were used to distribute funds to states)
|
|
|
"New" Formula Percentages
|
|
States
|
"Old" Formula Percentages
|
FY2012
|
FY2013
|
FY2014
|
FY2015
|
FY2016
|
FY2017
|
FY2018
|
FY2019
|
|
Alabama
|
0.860%
|
1.583%
|
1.716%
|
1.686%
|
1.488%
|
1.521%
|
1.509%
|
1.628
|
1.719
|
|
Alaska
|
0.549
|
0.398
|
0.522
|
0.563
|
0.491
|
0.432
|
0.430
|
0.439
|
0.438
|
|
Arizona
|
0.416
|
1.132
|
1.326
|
1.379
|
1.424
|
1.440
|
1.314
|
1.419
|
1.543
|
|
Arkansas
|
0.656
|
0.899
|
0.876
|
0.876
|
0.846
|
0.891
|
0.844
|
0.931
|
0.904
|
|
California
|
4.614
|
4.452
|
4.433
|
4.536
|
5.371
|
5.504
|
5.231
|
5.522
|
5.991
|
|
Colorado
|
1.609
|
1.267
|
1.264
|
1.270
|
1.391
|
1.413
|
1.484
|
1.422
|
1.438
|
|
Connecticut
|
2.099
|
2.398
|
2.416
|
2.371
|
2.711
|
2.508
|
2.411
|
2.265
|
2.069
|
|
Delaware
|
0.279
|
0.375
|
0.421
|
0.427
|
0.407
|
0.409
|
0.385
|
0.412
|
0.383
|
|
District of Columbia
|
0.326
|
0.194
|
0.184
|
0.149
|
0.173
|
0.189
|
0.207
|
0.259
|
0.193
|
|
Florida
|
1.361
|
4.593
|
5.475
|
5.201
|
4.057
|
3.936
|
3.944
|
4.226
|
4.372
|
|
Georgia
|
1.076
|
2.742
|
3.137
|
3.166
|
3.068
|
2.924
|
2.911
|
3.120
|
3.312
|
|
Hawaii
|
0.108
|
0.205
|
0.185
|
0.230
|
0.219
|
0.196
|
0.168
|
0.149
|
0.148
|
|
Idaho
|
0.628
|
0.335
|
0.339
|
0.371
|
0.364
|
0.387
|
0.351
|
0.343
|
0.362
|
|
Illinois
|
5.809
|
5.243
|
4.655
|
4.510
|
4.075
|
4.245
|
4.466
|
4.128
|
4.361
|
|
Indiana
|
2.630
|
2.209
|
1.814
|
1.934
|
1.712
|
1.792
|
1.795
|
1.790
|
1.786
|
|
Iowa
|
1.864
|
1.080
|
1.001
|
1.065
|
1.005
|
1.054
|
1.111
|
1.003
|
0.978
|
|
Kansas
|
0.856
|
0.967
|
1.002
|
0.945
|
0.932
|
0.982
|
1.045
|
1.048
|
1.053
|
|
Kentucky
|
1.369
|
1.344
|
1.329
|
1.457
|
1.318
|
1.395
|
1.462
|
1.512
|
1.546
|
|
Louisiana
|
0.879
|
1.414
|
1.378
|
1.387
|
1.236
|
1.394
|
1.397
|
1.490
|
1.587
|
|
Maine
|
1.360
|
1.010
|
0.927
|
1.041
|
1.052
|
1.066
|
1.062
|
1.025
|
0.936
|
|
Maryland
|
1.607
|
2.197
|
2.344
|
2.193
|
2.206
|
2.347
|
2.408
|
2.486
|
2.371
|
|
Massachusetts
|
4.198
|
3.730
|
4.032
|
4.138
|
4.395
|
4.501
|
4.407
|
4.050
|
3.606
|
|
Michigan
|
5.515
|
4.863
|
4.966
|
4.681
|
4.535
|
4.357
|
4.148
|
4.013
|
4.249
|
|
Minnesota
|
3.973
|
2.047
|
1.849
|
1.921
|
1.827
|
1.869
|
2.044
|
1.887
|
1.855
|
|
Mississippi
|
0.737
|
0.990
|
0.955
|
0.953
|
0.825
|
0.910
|
0.932
|
0.956
|
0.938
|
|
Missouri
|
2.320
|
1.829
|
1.963
|
2.021
|
2.140
|
2.145
|
2.140
|
2.216
|
2.173
|
|
Montana
|
0.736
|
0.328
|
0.280
|
0.314
|
0.347
|
0.358
|
0.367
|
0.351
|
0.342
|
|
Nebraska
|
0.922
|
0.591
|
0.555
|
0.561
|
0.483
|
0.531
|
0.549
|
0.534
|
0.504
|
|
Nevada
|
0.195
|
0.498
|
0.563
|
0.537
|
0.722
|
0.718
|
0.713
|
0.750
|
0.726
|
|
New Hampshire
|
0.795
|
0.742
|
0.623
|
0.731
|
0.753
|
0.788
|
0.862
|
0.768
|
0.731
|
|
New Jersey
|
3.897
|
4.010
|
3.812
|
3.620
|
3.703
|
3.766
|
3.452
|
3.391
|
3.247
|
|
New Mexico
|
0.521
|
0.430
|
0.407
|
0.394
|
0.533
|
0.571
|
0.560
|
0.552
|
0.595
|
|
New York
|
12.725
|
10.227
|
9.445
|
9.318
|
10.792
|
9.477
|
9.572
|
9.149
|
8.539
|
|
North Carolina
|
1.896
|
2.619
|
2.954
|
2.891
|
2.817
|
2.828
|
2.779
|
2.974
|
3.000
|
|
North Dakota
|
0.800
|
0.302
|
0.215
|
0.254
|
0.251
|
0.275
|
0.317
|
0.284
|
0.242
|
|
Ohio
|
5.139
|
4.687
|
4.243
|
4.368
|
3.836
|
3.850
|
3.932
|
3.944
|
3.957
|
|
Oklahoma
|
0.791
|
1.152
|
1.207
|
1.219
|
1.186
|
1.207
|
1.228
|
1.288
|
1.338
|
|
Oregon
|
1.247
|
0.664
|
0.712
|
0.781
|
0.885
|
0.860
|
0.817
|
0.822
|
0.843
|
|
Pennsylvania
|
6.835
|
5.807
|
5.571
|
5.720
|
5.856
|
5.810
|
5.989
|
5.619
|
5.278
|
|
Rhode Island
|
0.691
|
0.670
|
0.753
|
0.712
|
0.857
|
0.803
|
0.770
|
0.758
|
0.628
|
|
South Carolina
|
0.683
|
1.201
|
1.394
|
1.403
|
1.288
|
1.323
|
1.307
|
1.374
|
1.458
|
|
South Dakota
|
0.649
|
0.272
|
0.233
|
0.240
|
0.242
|
0.257
|
0.264
|
0.251
|
0.237
|
|
Tennessee
|
1.386
|
1.700
|
1.865
|
1.848
|
1.730
|
1.771
|
1.864
|
1.899
|
1.952
|
|
Texas
|
2.264
|
7.135
|
7.183
|
6.942
|
6.529
|
6.870
|
6.945
|
7.487
|
7.831
|
|
Utah
|
0.748
|
0.413
|
0.452
|
0.494
|
0.568
|
0.526
|
0.509
|
0.534
|
0.588
|
|
Vermont
|
0.596
|
0.396
|
0.417
|
0.425
|
0.490
|
0.503
|
0.526
|
0.449
|
0.461
|
|
Virginia
|
1.957
|
2.490
|
2.581
|
2.607
|
2.588
|
2.692
|
2.663
|
2.735
|
2.703
|
|
Washington
|
2.051
|
1.145
|
1.244
|
1.305
|
1.443
|
1.434
|
1.331
|
1.422
|
1.513
|
|
West Virginia
|
0.906
|
0.638
|
0.625
|
0.631
|
0.661
|
0.707
|
0.680
|
0.743
|
0.793
|
|
Wisconsin
|
3.576
|
2.230
|
2.010
|
2.054
|
2.000
|
2.100
|
2.219
|
2.018
|
1.991
|
|
Wyoming
|
0.299
|
0.154
|
0.146
|
0.160
|
0.173
|
0.169
|
0.180
|
0.162
|
0.194
|
Source: State allotment percentage data were provided to CRS by HHS.
Appendix A.
Estimated Allotments to the States Under Various Hypothetical Appropriations Levels
Table A-1, below, shows estimated allocations to the states at various hypothetical appropriations levels. In column (a) are allotments at the equivalent of a hypothetical FY1984 appropriation of $1.975 billion—under recent LIHEAP practice where funds are set aside for training and technical assistance, the equivalent appropriation level is approximately $1.978 billion. The remaining columns show estimated allotments at appropriations of $2.14 billion, just under $2.25 billion, $2.25 billion, $3.0 billion, $3.69 billion (the amount appropriated in FY2019), $4.0 billion, and $5.1 billion, the amount at which the LIHEAP program was last authorized in P.L. 109-58. In each case, the estimates assume that 0.5% would be set aside for the territories, the amount set aside by HHS starting in FY2014.
Table A-1. LIHEAP Estimated State Allotments for Regular Funds at Various Hypothetical Appropriation Levels
($ in millions)
|
|
"Old" Formula
|
"New" Formula, Hold-Harmless Level Only
|
"New" Formula, Hold-Harmless Level and Rate
|
|
State
|
Hypothetical $1.975 Billion in FY1984
(a)
|
$2.14 Billion
(b)
|
Just Under
$2.25 Billion
(c)
|
$2.25 Billion
(d)
|
$2.5 Billion
(e)
|
$3.0 Billion
(f)
|
$3.69 Billion
(g)
|
$4.0 Billion
(h)
|
$5.1 Billion
(i)
|
|
Alabama
|
16.963
|
22.387
|
26.851
|
26.423
|
40.879
|
51.260
|
63.067
|
68.364
|
87.178
|
|
Alaska
|
10.828
|
10.828
|
10.828
|
11.344
|
12.606
|
15.130
|
18.615
|
20.178
|
25.731
|
|
Arizona
|
8.203
|
10.827
|
12.985
|
12.779
|
19.770
|
32.932
|
43.669
|
47.929
|
61.578
|
|
Arkansas
|
12.943
|
17.082
|
20.214
|
20.162
|
22.463
|
26.961
|
33.171
|
35.957
|
45.853
|
|
California
|
91.001
|
120.099
|
133.942
|
133.942
|
148.844
|
178.649
|
219.797
|
238.258
|
303.828
|
|
Colorado
|
31.729
|
31.729
|
32.152
|
32.152
|
35.729
|
42.884
|
52.761
|
57.193
|
72.933
|
|
Connecticut
|
41.392
|
43.994
|
46.258
|
46.258
|
51.405
|
61.698
|
75.909
|
82.285
|
104.930
|
|
Delaware
|
5.494
|
7.251
|
8.570
|
8.558
|
9.523
|
11.430
|
14.062
|
15.244
|
19.439
|
|
District of Columbia
|
6.428
|
6.428
|
6.428
|
6.734
|
7.484
|
8.982
|
11.051
|
11.979
|
15.276
|
|
Florida
|
26.840
|
35.423
|
42.486
|
41.809
|
64.683
|
107.747
|
142.878
|
156.814
|
201.472
|
|
Georgia
|
21.221
|
28.007
|
33.592
|
33.057
|
51.142
|
85.191
|
112.967
|
123.986
|
159.295
|
|
Hawaii
|
2.137
|
2.820
|
3.309
|
3.309
|
3.678
|
4.414
|
5.431
|
5.887
|
7.507
|
|
Idaho
|
12.376
|
12.376
|
12.376
|
12.966
|
14.409
|
17.294
|
21.277
|
23.064
|
29.412
|
|
Illinois
|
114.565
|
114.565
|
114.565
|
114.565
|
114.565
|
130.049
|
160.004
|
173.442
|
221.175
|
|
Indiana
|
51.872
|
51.872
|
51.872
|
51.872
|
51.872
|
53.273
|
65.543
|
71.048
|
90.601
|
|
Iowa
|
36.762
|
36.762
|
36.762
|
36.762
|
36.762
|
36.762
|
36.762
|
38.876
|
49.575
|
|
Kansas
|
16.883
|
22.281
|
23.553
|
23.553
|
26.174
|
31.415
|
38.651
|
41.897
|
53.427
|
|
Kentucky
|
26.994
|
32.883
|
34.576
|
34.576
|
38.422
|
46.116
|
56.738
|
61.503
|
78.430
|
|
Louisiana
|
17.342
|
22.887
|
27.451
|
27.014
|
39.438
|
47.335
|
58.238
|
63.129
|
80.503
|
|
Maine
|
26.815
|
26.815
|
26.815
|
26.815
|
26.815
|
27.900
|
34.327
|
37.210
|
47.450
|
|
Maryland
|
31.693
|
41.827
|
50.168
|
49.369
|
58.906
|
70.702
|
86.987
|
94.293
|
120.243
|
|
Massachusetts
|
82.797
|
82.797
|
82.797
|
82.797
|
89.590
|
107.529
|
132.296
|
143.408
|
182.874
|
|
Michigan
|
108.770
|
108.770
|
108.770
|
108.770
|
108.770
|
126.693
|
155.875
|
168.966
|
215.467
|
|
Minnesota
|
78.363
|
78.363
|
78.363
|
78.363
|
78.363
|
78.363
|
78.363
|
78.363
|
94.066
|
|
Mississippi
|
14.543
|
19.193
|
20.979
|
20.979
|
23.313
|
27.981
|
34.426
|
37.318
|
47.588
|
|
Missouri
|
45.762
|
46.213
|
48.592
|
48.592
|
53.999
|
64.811
|
79.739
|
86.436
|
110.224
|
|
Montana
|
14.517
|
14.517
|
14.517
|
15.208
|
16.900
|
20.285
|
24.957
|
27.053
|
34.498
|
|
Nebraska
|
18.180
|
18.180
|
18.180
|
19.046
|
21.166
|
25.404
|
31.255
|
33.880
|
43.204
|
|
Nevada
|
3.853
|
5.085
|
6.099
|
6.002
|
9.285
|
15.467
|
20.510
|
22.511
|
28.921
|
|
New Hampshire
|
15.672
|
15.672
|
16.352
|
16.418
|
18.245
|
21.898
|
26.942
|
29.205
|
37.243
|
|
New Jersey
|
76.865
|
76.865
|
76.865
|
76.865
|
80.661
|
96.813
|
119.112
|
129.116
|
164.649
|
|
New Mexico
|
10.270
|
12.657
|
13.308
|
13.308
|
14.789
|
17.750
|
21.838
|
23.673
|
30.187
|
|
New York
|
250.974
|
250.974
|
250.974
|
250.974
|
250.974
|
254.637
|
313.288
|
339.601
|
433.060
|
|
North Carolina
|
37.403
|
49.363
|
59.205
|
58.263
|
74.528
|
89.452
|
110.055
|
119.299
|
152.130
|
|
North Dakota
|
15.770
|
15.770
|
15.770
|
16.521
|
18.359
|
22.035
|
27.111
|
29.388
|
37.475
|
|
Ohio
|
101.350
|
101.350
|
101.350
|
101.350
|
101.350
|
117.991
|
145.169
|
157.361
|
200.668
|
|
Oklahoma
|
15.592
|
20.578
|
24.681
|
24.288
|
33.248
|
39.906
|
49.098
|
53.221
|
67.868
|
|
Oregon
|
24.591
|
24.591
|
24.591
|
24.591
|
24.591
|
25.139
|
30.930
|
33.528
|
42.755
|
|
Pennsylvania
|
134.810
|
134.810
|
134.810
|
134.810
|
134.810
|
157.378
|
193.627
|
209.890
|
267.653
|
|
Rhode Island
|
13.629
|
13.629
|
14.032
|
14.278
|
15.867
|
19.044
|
23.430
|
25.398
|
32.388
|
|
South Carolina
|
13.472
|
17.780
|
21.325
|
20.985
|
32.466
|
43.474
|
53.487
|
57.980
|
73.936
|
|
South Dakota
|
12.808
|
12.808
|
12.808
|
13.418
|
14.911
|
17.896
|
22.019
|
23.868
|
30.436
|
|
Tennessee
|
27.344
|
36.088
|
43.284
|
42.595
|
48.496
|
58.207
|
71.614
|
77.629
|
98.992
|
|
Texas
|
44.653
|
58.932
|
70.683
|
69.557
|
107.611
|
179.256
|
237.702
|
260.887
|
335.183
|
|
Utah
|
14.745
|
14.745
|
14.745
|
15.447
|
17.166
|
20.603
|
25.348
|
27.477
|
35.039
|
|
Vermont
|
11.747
|
11.747
|
11.747
|
12.306
|
13.675
|
16.414
|
20.194
|
21.890
|
27.915
|
|
Virginia
|
38.606
|
50.950
|
60.441
|
60.137
|
67.165
|
80.614
|
99.182
|
107.512
|
137.101
|
|
Washington
|
40.450
|
40.450
|
40.450
|
40.450
|
40.450
|
45.114
|
55.505
|
60.167
|
76.725
|
|
West Virginia
|
17.864
|
17.864
|
17.864
|
18.715
|
20.797
|
24.962
|
30.711
|
33.290
|
42.452
|
|
Wisconsin
|
70.538
|
70.538
|
70.538
|
70.538
|
70.538
|
70.538
|
73.042
|
79.177
|
100.967
|
|
Wyoming
|
5.903
|
5.903
|
5.903
|
6.185
|
6.873
|
8.249
|
10.149
|
11.001
|
14.029
|
|
Total
|
1,972.33
|
2,126.327
|
2,235.777
|
2,235.777
|
2,484.527
|
2,982.027
|
3,668.879
|
3,977.027
|
5,071.527
|
Source: Congressional Research Service (CRS) calculations based on factors provided by the Department of Health and Human Services (HHS) in 2019.
Notes: These estimates use recent appropriations practice in which Congress has allocated $2.988 million for training and technical assistance, but no funds for leveraging incentive and REACH grants. With the exception of column (a), it also factors in HHS practice since FY2014 to set aside 0.50% of regular funds for the territories. Differing allocations for these purposes could change state allotments. Column (a) assumes that funds for the territories would be the same percentage distributed that year – approximately 0.135%.
Appendix B.
Further Depiction of How State Allotments Depend Upon Appropriation Levels
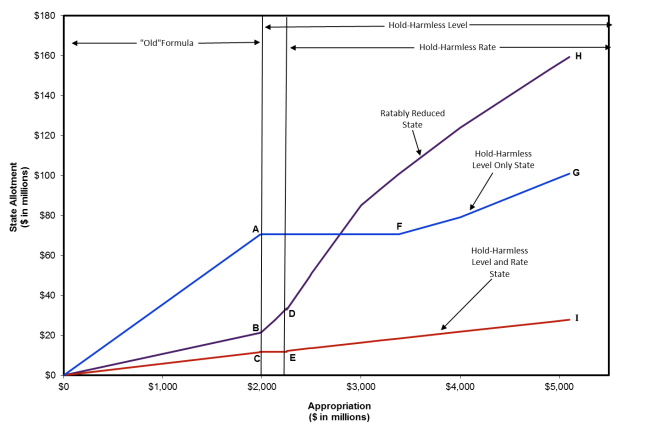
Figure B-1 graphically illustrates the interplay of the hold harmless provisions in state allotments for three types of states over a range of appropriations from $0 to $5.1 billion.
Represented are (1) a hold-harmless level state, (2) a state whose increased allocations are ratably reduced in order to maintain allocations for the hold-harmless level and rate states, and (3) a hold-harmless level and rate state. These three states are not representative of all states in the three categories; see Table A-1 for the range of individual state allocations.
In the figure, there are three vertical areas. These areas separate the three levels of appropriations that are triggers under current law and were explained previously in this report. The figure also graphs the three types of states. These three types of states are as follows.
- Hold-Harmless Level Only State. This state is depicted with a blue line running from $0 to point G. States with "new" formula percentages that start out lower than their "old" formula percentages are subject to only the hold-harmless level provision. They do not qualify for the hold-harmless rate because each state's share of the regular funds at $2.25 billion is greater than 1%. The hold-harmless level is evident from point A to point F. Here, despite increases in the appropriations level, the state allotment remains fixed. In Table 1, these are the states that have a "Y" in column (c) and an "N" in column (e).
- Ratable Reduction State. This state is depicted with a purple line running from $0 to point H. States with "new" formula percentages that are higher than their "old" formula percentages are subject to a ratable reduction. Their new formula percentage is greater than their old (FY1984) percentage. There is a small decrease in state allotments at point D that is attributable to the increased shortfall on the distribution of funds that the hold-harmless rate imposes. In Table 1, these are the states that have an "N" in both column (c) and column (e).
- Hold-Harmless Level and Rate State. This state is depicted with a red line running from $0 to point I. States have lower new formula percentages and are subject to both the hold-harmless level and the hold harmless rate provisions. The hold-harmless level is evident by the fixed state allotment from point C to point E. However, the (subtle) jump at exactly $2.25 billion (point E) signals that this state is subject to the hold-harmless rate provision. After the allotment jump at $2.25 billion, the state's allotment continues to increase (at a rate lower than the old rate, but higher than the new rate). In Table 1, these are the states that have a "Y" in column (c) and a "Y" in the column (e).
|
Figure B-1. Estimated LIHEAP Allocations at Various Hypothetical Appropriations Levels for Three Types of States
|
 |
|
Source: Figure created by CRS using formula rates provided by HHS in 2019.
|
Appendix C.
LIHEAP Formula Fund Allocations to the States, FY2010-FY2019
Since FY2009, Congress, through appropriations language, has directed that a portion of the regular funds appropriated be distributed to the states via the "new" LIHEAP formula, and the remainder using the "old" formula percentages. The portion of funds distributed via the new formula has ranged from 14% to nearly 20% of regular funds appropriated, depending on the year.
Table C-1, below, shows actual LIHEAP regular fund allocations to the states from FY2009 through FY2019. In each year, funds for the territories, training and technical assistance (TTA), and leveraging incentive grants (if appropriated) are first subtracted from the total appropriation. The remainder of funding is distributed to the states via formula as directed in appropriations language. For example, in FY2019 Congress directed that $716 million be distributed via the "new" LIHEAP formula, and the remainder via the "old" LIHEAP formula percentages.
The column header in Table C-1 for each year shows the total regular funds appropriated for LIHEAP (including funds that were not distributed via the formula such as rescissions and transfers). Total funding distributed to the states via formula is in the final row of the table for each year. The table notes describe the division between "new" and "old" formulas, and any other relevant information.
Table C-1. LIHEAP Actual State Regular Fund Allocations for
FY2009 through FY2019
($ in millions)
|
|
|
Actual Allocations, FY2009-FY2019
|
|
State
|
FY2009: $4.51
Billiona
|
FY2010:
$4.51 Billionb
|
FY2011:
$4.50 Billionc
|
FY2012:
$3.47 Billiond
|
FY2013:
$3.26
Billione
|
FY2014:
$3.39
Billionf
|
FY2015:
$3.39
Billiong
|
FY2016:
$3.37
Billionh
|
FY2017:
$3.39
Billioni
|
FY2018:
$3.64
Billionj
|
FY2019:
$3.69
Billionk
|
|
Alabama
|
60.063
|
58.799
|
59.419
|
47.408
|
48.269
|
48.885
|
44.387
|
43.551
|
44.941
|
51.554
|
54.195
|
|
Alaska
|
23.568
|
25.308
|
23.667
|
18.002
|
17.171
|
18.841
|
17.482
|
17.496
|
17.488
|
18.779
|
18.847
|
|
Arizona
|
29.047
|
33.729
|
32.922
|
23.852
|
23.343
|
23.641
|
21.581
|
21.062
|
21.734
|
27.972
|
29.579
|
|
Arkansas
|
36.497
|
35.773
|
34.985
|
28.537
|
26.746
|
27.505
|
26.777
|
27.858
|
26.819
|
31.134
|
30.551
|
|
California
|
225.894
|
202.749
|
202.843
|
154.574
|
145.410
|
153.592
|
174.086
|
177.168
|
171.344
|
191.855
|
205.097
|
|
Colorado
|
63.474
|
64.257
|
62.139
|
47.308
|
44.270
|
46.378
|
48.889
|
49.002
|
51.041
|
53.175
|
53.793
|
|
Connecticut
|
95.783
|
96.942
|
98.254
|
79.532
|
76.014
|
77.413
|
85.764
|
80.690
|
78.713
|
80.738
|
75.291
|
|
Delaware
|
17.384
|
15.189
|
15.172
|
11.957
|
12.573
|
13.016
|
12.547
|
12.574
|
12.036
|
13.653
|
12.955
|
|
District of Columbia
|
14.653
|
13.992
|
14.051
|
10.687
|
9.976
|
10.474
|
10.379
|
10.387
|
10.382
|
11.149
|
11.189
|
|
Florida
|
95.037
|
110.354
|
107.714
|
78.040
|
76.376
|
77.351
|
70.611
|
68.911
|
71.111
|
91.520
|
96.776
|
|
Georgia
|
75.141
|
87.252
|
85.164
|
61.702
|
60.387
|
61.158
|
55.829
|
54.485
|
56.224
|
72.360
|
76.517
|
|
Hawaii
|
4.652
|
6.023
|
6.027
|
6.107
|
5.416
|
6.159
|
5.622
|
5.487
|
5.143
|
5.004
|
5.011
|
|
Idaho
|
26.939
|
26.939
|
27.052
|
20.576
|
19.207
|
20.166
|
19.982
|
19.999
|
19.989
|
21.465
|
21.543
|
|
Illinois
|
237.236
|
232.865
|
238.712
|
185.684
|
160.191
|
167.458
|
167.396
|
166.270
|
167.396
|
171.008
|
172.195
|
|
Indiana
|
103.609
|
104.151
|
102.749
|
80.006
|
72.374
|
75.820
|
75.792
|
75.282
|
75.792
|
77.428
|
76.977
|
|
Iowa
|
67.803
|
67.803
|
68.137
|
54.813
|
51.292
|
53.735
|
53.715
|
53.354
|
53.715
|
54.874
|
54.554
|
|
Kansas
|
45.349
|
41.757
|
42.327
|
32.160
|
31.397
|
31.019
|
30.717
|
31.921
|
33.606
|
36.217
|
36.514
|
|
Kentucky
|
68.353
|
57.742
|
58.335
|
46.423
|
43.483
|
48.288
|
44.896
|
46.713
|
48.634
|
53.572
|
54.725
|
|
Louisiana
|
57.196
|
51.870
|
53.164
|
43.422
|
40.864
|
42.062
|
38.390
|
42.234
|
42.462
|
48.120
|
50.899
|
|
Maine
|
49.457
|
54.309
|
53.539
|
39.982
|
37.414
|
39.195
|
39.181
|
38.917
|
39.181
|
40.265
|
39.793
|
|
Maryland
|
101.296
|
82.002
|
85.523
|
69.790
|
70.390
|
68.513
|
68.854
|
72.255
|
74.051
|
81.680
|
78.971
|
|
Massachusetts
|
162.981
|
175.524
|
175.178
|
132.731
|
132.256
|
140.014
|
146.328
|
148.768
|
147.242
|
147.723
|
136.484
|
|
Michigan
|
222.412
|
233.524
|
228.294
|
173.450
|
165.582
|
165.444
|
161.827
|
157.859
|
158.928
|
162.357
|
166.349
|
|
Minnesota
|
144.528
|
144.528
|
145.241
|
116.839
|
109.335
|
114.541
|
114.498
|
113.728
|
114.498
|
116.969
|
116.288
|
|
Mississippi
|
39.011
|
39.661
|
38.834
|
31.591
|
29.313
|
30.120
|
26.996
|
29.051
|
29.746
|
32.594
|
32.271
|
|
Missouri
|
103.541
|
95.257
|
95.596
|
68.231
|
66.553
|
70.882
|
73.772
|
73.295
|
73.618
|
81.052
|
80.217
|
|
Montana
|
31.598
|
31.598
|
31.730
|
24.135
|
22.529
|
23.654
|
23.438
|
23.457
|
23.446
|
25.177
|
25.268
|
|
Nebraska
|
39.573
|
39.573
|
39.738
|
30.226
|
28.214
|
29.623
|
29.353
|
29.377
|
29.363
|
31.531
|
31.645
|
|
Nevada
|
13.643
|
15.841
|
15.462
|
11.203
|
10.964
|
11.104
|
10.136
|
9.892
|
10.208
|
13.138
|
13.892
|
|
New Hampshire
|
34.112
|
34.112
|
34.255
|
26.055
|
24.321
|
25.536
|
25.750
|
26.399
|
28.546
|
27.994
|
27.279
|
|
New Jersey
|
166.690
|
177.196
|
180.991
|
136.746
|
124.480
|
124.570
|
126.586
|
127.094
|
120.142
|
127.410
|
124.027
|
|
New Mexico
|
24.901
|
22.355
|
22.448
|
17.074
|
15.938
|
16.734
|
17.844
|
18.766
|
18.600
|
19.778
|
21.003
|
|
New York
|
475.935
|
479.526
|
495.801
|
375.710
|
350.169
|
366.843
|
381.440
|
364.242
|
366.707
|
374.621
|
372.438
|
|
North Carolina
|
123.243
|
109.339
|
111.263
|
83.011
|
87.702
|
88.271
|
86.504
|
86.702
|
85.848
|
97.447
|
98.542
|
|
North Dakota
|
34.325
|
34.325
|
34.469
|
26.218
|
24.473
|
25.695
|
25.460
|
25.482
|
25.469
|
27.350
|
27.449
|
|
Ohio
|
220.588
|
223.108
|
225.398
|
165.463
|
144.794
|
154.314
|
148.087
|
147.091
|
148.087
|
154.051
|
154.948
|
|
Oklahoma
|
49.007
|
47.902
|
47.717
|
36.094
|
35.955
|
37.147
|
36.338
|
36.844
|
37.498
|
41.886
|
43.405
|
|
Oregon
|
45.355
|
45.355
|
45.579
|
36.666
|
34.311
|
35.945
|
35.931
|
35.690
|
35.931
|
36.707
|
36.493
|
|
Pennsylvania
|
274.925
|
282.279
|
280.478
|
209.548
|
190.810
|
203.071
|
206.356
|
203.405
|
209.107
|
214.781
|
206.488
|
|
Rhode Island
|
30.209
|
29.666
|
29.790
|
23.241
|
23.976
|
23.813
|
27.361
|
26.002
|
25.333
|
26.904
|
23.723
|
|
South Carolina
|
47.702
|
47.311
|
46.909
|
36.270
|
38.335
|
38.825
|
35.442
|
34.588
|
35.693
|
43.107
|
45.498
|
|
South Dakota
|
27.878
|
27.878
|
27.995
|
21.293
|
19.877
|
20.869
|
20.678
|
20.696
|
20.686
|
22.213
|
22.293
|
|
Tennessee
|
73.723
|
72.092
|
71.595
|
55.405
|
56.856
|
58.040
|
55.161
|
56.101
|
58.666
|
63.972
|
65.651
|
|
Texas
|
158.110
|
183.593
|
179.200
|
129.832
|
127.064
|
128.686
|
117.473
|
114.645
|
118.304
|
152.258
|
161.004
|
|
Utah
|
32.094
|
32.094
|
32.228
|
24.513
|
22.882
|
24.025
|
23.806
|
23.825
|
23.814
|
25.572
|
25.665
|
|
Vermont
|
25.568
|
25.568
|
25.675
|
19.529
|
18.230
|
19.140
|
18.965
|
18.981
|
18.972
|
20.373
|
20.446
|
|
Virginia
|
118.084
|
100.856
|
102.839
|
80.436
|
78.971
|
81.877
|
81.432
|
83.926
|
83.571
|
91.754
|
91.298
|
|
Washington
|
74.603
|
74.603
|
74.971
|
60.310
|
56.437
|
59.124
|
59.102
|
58.705
|
59.102
|
60.378
|
60.083
|
|
West Virginia
|
40.584
|
38.884
|
39.047
|
29.700
|
27.723
|
29.108
|
28.842
|
28.866
|
28.852
|
30.982
|
31.094
|
|
Wisconsin
|
130.096
|
130.096
|
130.738
|
105.172
|
98.417
|
103.103
|
103.065
|
102.372
|
103.065
|
105.289
|
104.676
|
|
Wyoming
|
12.850
|
12.850
|
12.904
|
9.815
|
9.162
|
9.619
|
9.531
|
9.539
|
9.535
|
10.239
|
10.276
|
|
Total
|
4,476.302
|
4,476.302
|
4,494.258
|
3,437.068
|
3,248.193
|
3,370.409
|
3,370.379
|
3,351.004
|
3,370.379
|
3,619.129
|
3,632.161
|
Source: The Department of Health and Human Services (HHS) provided data on final regular fund allocations for FY2009 through FY2019. Allocations to the states include tribal allotments.
a. Congress appropriated approximately $4.51 billion for LIHEAP as part of a continuing resolution (P.L. 110-329). Of this amount, $4.48 billion was distributed to states and tribes, with $840 million allocated under the "new" LIHEAP formula and the remainder allocated according to the proportions of the "old" LIHEAP formula.
b. In FY2010, Congress appropriated the same amount for LIHEAP regular funds as it had in FY2009—approximately $4.51 billion—with the same division of funds between "old" and "new" formulas (P.L. 111-117).
c. The FY2011 Department of Defense and Full-Year Continuing Appropriations Act (P.L. 112-10) included an across-the-board rescission of 0.2% for discretionary accounts. This reduced the LIHEAP regular fund appropriation from approximately $4.51 billion to $4.50 billion. The total distributed via formula to states and tribes was $4.49 billion, of which $840 million was distributed via the "new" formula and the remainder according to the "old" formula percentages.
d. The FY2012 LIHEAP appropriation (P.L. 112-74) included an across-the-board rescission of 0.189% that reduced the total available to $3.47 billion. Of the amount available for formula funds, $497 million was distributed according to the "new" LIHEAP formula and the remainder according to the proportions of the "old" LIHEAP formula.
e. In FY2013, Congress enacted a full-year continuing resolution funding LIHEAP (and most other federal programs) at FY2012 levels (P.L. 113-6). While LIHEAP was funded at $3.47 billion in FY2012, funding in FY2013 was reduced by an across-the-board rescission of 0.2%, by sequestration, and by a transfer of funds within HHS, resulting in just under $3.26 billion for the program. Of that amount, $3.25 billion was distributed to states and tribes, with $497 distributed via the "new" formula and the remainder via the "old" formula.
f. The FY2014 regular fund appropriation for LIHEAP (P.L. 113-76) was reduced by 1% ($34.245 million) due to a transfer of funds within HHS, bringing the amount available to $3.39 billion. Of the amount distributed to states and tribes by formula ($3.37 billion), $491 million was distributed according to the "new" formula and the remainder according to the proportions of the "old" formula.
g. In FY2015, Congress appropriated $3.39 billion for LIHEAP regular funds (P.L. 113-235). Of the funds distributed to the states and tribes by formula, $491 million was distributed according to the "new" formula, and the remainder, approximately $2.9 billion, according to the proportions of the "old" formula.
h. The FY2016 LIHEAP appropriation of $3.39 billion (P.L. 114-113) was reduced by approximately $19 million due to a transfer of funds within HHS, bringing the amount available to $3.37 billion. Of the amount distributed to the states and tribes, $491 million was distributed according to the "new" formula, and the remainder according to the "old" formula percentages.
i. In FY2017 Congress appropriated $3.39 billion for LIHEAP (P.L. 115-31). Of the amount appropriated for formula funds, $491 million was distributed according to the "new" formula and the remainder according to the "old" formula percentages.
j. LIHEAP appropriations increased in FY2018 to $3.64 billion (P.L. 115-141). The total available to the states and tribes was approximately $3.62 billion. Of that amount, nearly $679 million was distributed according to the "new" LIHEAP formula, and the remainder according to the "old" formula percentages.
k. LIHEAP appropriations increased again in FY2019 to $3.69 billion (P.L. 115-245). As of the date of this report, all but 1% of the appropriation had been distributed via the formula to states and tribes. Of the amount appropriated, $716 million was distributed according to the "new" LIHEAP formula, and the remainder according to the "old" formula percentages.
Appendix D.
History of the LIHEAP Formula
Predecessor Programs to LIHEAP
The mid- to late-1970s, a time marked by rapidly rising fuel prices, also marked the beginning of federal energy assistance funding for low-income households. The first national program to help low-income households was created in early 1975 to assist families with energy conservation primarily through home weatherization. This assistance was provided through a new Emergency Energy Conservation Program (EECP), enacted as part of the Headstart, Economic Opportunity, and Community Partnership Act of 1974 (P.L. 93-644). The funds were administered by the Community Services Administration (CSA), the successor agency to the Office of Economic Opportunity, which was responsible for many of the programs created as part of the 1964 war on poverty. Beginning in 1977, funds were also made available through the CSA to help families directly pay for fuel (as opposed to weatherization expenses) via a variety of programs. Each of these programs had in common a focus on the need for heating assistance (versus cooling assistance).
Congress continued to appropriate funds for energy assistance programs through FY1980, at which point a new program, the Low Income Energy Assistance Program (LIEAP), was enacted as part of the Crude Oil Windfall Profits Tax Act of 1980 (P.L. 96-223). LIEAP, which was administered by the Department of Health and Human Services (HHS), was funded for one year, FY1981, before the creation of LIHEAP. Like the CSA programs, LIEAP emphasized heating over cooling needs. This preference was reflected in both the CSA program formulas and the LIEAP set of formulas, which used variables that benefitted cold-weather states to determine how funds would be distributed. The LIEAP set of formulas continues to have relevance for the way in which LIHEAP funds are distributed. This section of the report describes these predecessor programs to LIHEAP and their distribution formulas.
Community Services Administration Energy Assistance Programs
On January 4, 1975, President Ford signed into law the Headstart, Economic Opportunity, and Community Partnership Act of 1974 (P.L. 93-644), which contained funds for a new program, called the Emergency Energy Conservation Program (EECP). The program was to be administered by the Community Services Administration (CSA), and its purpose was
to enable low-income individuals and families, including the elderly and the near poor, to participate in energy conservation programs designed to lessen the impact of the high cost of energy ... and to reduce ... energy consumption.
The law governing EECP listed a number of eligible activities in which states could participate, including energy conservation and education programs; weatherization assistance; loans and grants for the purchase of energy conservation technologies; alternative fuel supplies; and fuel voucher and stamp programs. Despite the variety of activities that could be funded through the program, the first CSA funding notice regarding the program limited eligible activities to "winterizing" homes and to giving emergency assistance "to prevent hardship or danger to health due to utility shutoff or lack of fuel."19 During the four years the EECP was funded, the majority of funds were used for weatherization expenses.20
EECP funds were distributed to states via a formula that benefitted those states with high heating costs. One formula variable in particular, a measure of "coldness" called heating degree days, benefitted cold-weather states. Heating degree days measure the extent to which a day's average temperature falls below 65° Fahrenheit. For example, a day with an average temperature of 50° results in a measure of 15 heating degree days. Because heating degree days are higher in cold-weather states, including the heating degree day variable in a formula favors states with greater heating needs. Squaring the heating degree days magnifies this effect.21 The EECP formula took the number of population-weighted heating degree days in each state, squared them, and multiplied the result by the number of households in poverty that owned their homes to determine how funds would be allocated.22 The CSA acknowledged the emphasis on heating needs in its formula, stating that the FY1975 allocation "was heavily weighted to the coldest areas."23 In the three fiscal years that followed the first appropriation for the EECP, from FY1976 through FY1978, the CSA changed somewhat the way in which it allocated funds to the states; however, the factors continued to favor cold-weather states through use of either heating degree days or heating degree days squared.24
The first year that Congress specifically appropriated funds for direct assistance to help low-income households (those at or below 125% of poverty) pay their energy costs (instead of funds that went primarily for weatherization and conservation activities) was FY1977. The FY1977 Supplemental Appropriations Act (P.L. 95-26) provided $200 million for a Special Crisis Intervention Program to be administered by CSA. States could use funds to make direct payments to fuel providers on behalf of low-income families lacking the financial resources to pay their energy bills. The CSA directed states to target households where utilities had been shut off (or were threatened with shut off) or who could prove "dire financial need" as the result of paying large energy bills.25 Although the law did not reserve funds exclusively for heating costs, the way in which funds were allocated to the states emphasized heating need. Funds were distributed to the states based on a formula that used (1) heating degree days squared, (2) the number of households in poverty, (3) the number of persons above age 65 with incomes below 125% of poverty, and (4) the relative cost of fuel in the region.26 Congress again appropriated $200 million for crisis intervention in both FY1978 and FY1979.27 In FY1978, funds were available to households with the need for assistance as the result of an energy-related emergency such as lack of fuel, a natural disaster, fuel shortages, and widespread unemployment.28 In FY1979, funds were made available to assist families facing "substantially increased energy costs and/or life- or health-threatening situations caused by winter-related energy emergencies."29
In FY1980, Congress appropriated a total of $1.6 billion for energy assistance. Of this amount, $400 million was appropriated for the Energy Crisis Assistance Program (ECAP, a CSA program similar to the Special Crisis Intervention Program) through two separate appropriations.30 The remainder, $1.2 billion, was appropriated as part of the FY1980 Department of the Interior Appropriations Act (P.L. 96-126) to the Department of Health, Education, and Welfare (HEW, the predecessor to HHS) for cash assistance and crisis intervention due to high energy costs. This appropriation to HEW is sometimes referred to as Low Income Supplemental Energy Allowances. Of this $1.2 billion, $400 million was to be distributed specifically to recipients of Supplemental Security Income (SSI). The rest of the funds appropriated to HEW, approximately $800 million, as well as the ECAP funds, were distributed to states on the basis of three factors: heating degree days squared, the number of households below 125% of poverty, and the difference in home heating energy expenditures between 1978 and 1979. The formula used to distribute the $400 million for SSI recipients used these same factors but also included the number of SSI recipients in each state relative to the national total.
Table D-1. Factors Used in Select Energy Assistance Formulas, FY1975-FY1980
|
Emergency Energy Conservation Program:a
FY1975
(P.L. 93-644)
|
Special Crisis
Intervention Program:b
FY1977
(P.L. 95-26)
|
Low Income Supplemental Energy Allowances:c
FY1980
(P.L. 96-126)
|
|
(Heating degree days)2
|
(Heating degree days)2
|
(Heating degree days)2
|
|
Number of homeowners in poverty
|
Number of households in poverty
|
Number of households below 125% of poverty
|
|
|
Number of persons over age 65 with income less than 125% of poverty
|
Difference in home heating expenditures between 1978 and 1979
|
|
|
Relative cost of fuel
|
|
Sources: For the formula under P.L. 93-644, see Community Services Administration, "Emergency Energy Conservation Program: Submission of Funding Plans," Federal Register, vol. 41, no. 208, October 27, 1976, p. 47096. For the formula under P.L. 95-26, see Senate Appropriations Committee, report to accompany H.R. 4877, the FY1977 Supplemental Appropriations Act, 95th Congress, 1st session, S.Rept. 95-64, March 24, 1977. The formula for P.L. 96-126 is contained within the law.
a. Of the funds appropriated for the Emergency Energy Conservation Program, 90% were distributed via the formula, while the remaining 10% were divided among the 12 coldest states as measured by heating degree days. The formula involved multiplying heating degree days squared by the number of homeowners in poverty to arrive at the percentage share for each state.
b. The Special Crisis Intervention Program did not specify a weight for each of the four variables used to determine allocations.
c. The Low Income Supplemental Energy Allowances arrived at states' shares of funds through the formula ½ (heating degree days2 * number of households below 125% of poverty) + ½ (difference in home heating expenditures between 1978 and 1980). Of the $1.6 billion appropriated for energy assistance in FY1980, $400 million was set aside for SSI recipients. The formula to distribute those funds was ⅓ (heating degree days2 * number of households below 125% of poverty) + ⅓ (difference in home heating expenditures between 1978 and 1979) + ⅓ (SSI recipients in each state relative to the national total).
The Low Income Energy Assistance Program (LIEAP) Formula
In April 1980, Congress replaced the patchwork energy assistance programs of the late 1970s with one program, the Low Income Energy Assistance Program (LIEAP). LIEAP, the direct predecessor program to LIHEAP, was established as part of the Crude Oil Windfall Profits Tax Act of 1980 (P.L. 96-223). The program was introduced in the Senate as the Home Energy Assistance Act (S. 1724) and was incorporated into H.R. 3919, the bill that would become the Crude Oil Windfall Profits Tax Act, on the Senate floor.31 Like the energy assistance programs of the late 1970s such as the Special Crisis Intervention Program and the Low Income Supplemental Energy Allowances, LIEAP allocated funds to states in order to help low-income households pay their home energy costs. Also like these predecessor programs, LIEAP allocated funds to states using a method that put more emphasis on the heating needs of cold-weather states than it did on cooling needs.
The formula developed under LIEAP continues to be relevant in several ways: (1) it has been used to distribute LIHEAP funds as recently as FY2007, (2) the percentage shares of funds that states received continue to be the benchmark for the way in which states are held harmless under the current LIHEAP formula, and (3) from FY2009 through the present, Congress has distributed the bulk of LIHEAP funds using the LIEAP formula percentages (for more information, see Appendix C). As a result, the variables used are important in understanding the current formula and the way in which it is used to distribute funds.
Ultimately, Congress developed the LIEAP formula through two different laws: P.L. 96-223, the law that authorized LIEAP, and P.L. 96-369, a continuing resolution enacted six months later. The following two subsections describe the elements of the formula developed through each.
Formula Under P.L. 96-223
The formula developed as part of S. 1724, and subsequently incorporated into P.L. 96-223, reflected, in part, the concern that the problem of rising energy costs were "most critical in areas with high home heating costs."32 The formula for LIEAP arose from a Senate compromise over three different proposals. The debate centered around the degree to which heating should be emphasized over energy expenditures generally. Some Members wanted a formula that accounted for all energy uses and was not based solely on geographic location,33 while others saw the program's purpose as solely to provide heating assistance.34 The debate on the Senate floor was, at times, contentious, with Senator Edmund Muskie (Maine) resolved to filibuster in order to support the heating needs of northern states.35 Primarily at issue was the measure of heating degree days, particularly the extent to which they would be weighted and whether they would be squared.
Under the final compromise LIEAP formula in P.L. 96-223, states received funds under one of four different alternatives used to measure home energy need, depending on which one benefitted a state the most. Three of the four options contained different combinations of several formula factors: residential energy expenditures; heating degree days or heating degree days squared; and the number of low-income households in the state.
- Under the first formula alternative, 50% of the allocation was based on residential energy expenditures and 50% on heating degree days squared multiplied by the number of households at or below the Bureau of Labor Statistics (BLS) lower living standard.36
- Under the second formula alternative, 25% of the allocation was based on residential energy expenditures and 75% based on heating degree days squared multiplied by the number of households at or below the BLS lower living standard.
- Under the third formula alternative, 50% of the allocation was based on residential energy expenditures and 50% based on heating degree days (not squared) multiplied by the number of households with incomes at or below the BLS lower living standard.
- The fourth option guaranteed states a minimum benefit of $120 for each household that received Aid to Families with Dependent Children (AFDC), SSI, or Food Stamp benefits. The option was added to S. 1724 at the Finance Committee level in recognition of the fact that (in general) funds were not being provided for cooling costs.37
(See Table D-2 for a breakdown of these formulas.)
While the focus of the formula was on heating assistance, the LIEAP law did allow states to provide for cooling when households could demonstrate medical necessity.38 Congress authorized LIEAP for one year, FY1981, at $3 billion, but funds were not appropriated as part of P.L. 96-223.
Formula Under P.L. 96-369
Before the formula in P.L. 96-223 could be used to allocate funds, Congress introduced an alternative method for computing the state distribution rates. It did so when it appropriated $1.85 billion in LIEAP funds for FY1981 in a continuing resolution (P.L. 96-369), in October of 1980, six months after enactment of the Crude Oil Windfall Profits Tax Act. The new allocation method was not described in P.L. 96-369, however. Instead, the continuing resolution referred to a House Appropriations Committee report (H. Rept. 96-1244) accompanying another bill—the FY1981 Departments of Labor, Health and Human Services and Education Appropriations Act. It was in this committee report that the additional formula components for LIEAP were laid out.39 The additional formula components appeared to be intended to act as a counter to the formula developed in P.L. 96-223, which some argued benefitted warmer weather states more than was necessary.40
The first step in the new set of formulas was to determine each state's share of funds using two calculations set out in H. Rept. 96-1244 and assign states the greater of the two amounts.
- Under the first formula alternative, 50% of the allocation was based on the increase in home heating expenditures, and 50% was based on the number of heating degree days squared times the population with income less than or equal to 125% of poverty. This was the same formula used for the Low-Income Supplemental Energy Allowances Program.
- Under the second formula alternative, 25% of the allocation was based on total residential energy expenditures, and 75% was based on heating degree days squared multiplied by the number of low-income households in the state.
The greater of the two percentages calculated using the formula in H. Rept. 96-1244 was then assigned to each state. After adjusting state allotments proportionately so that the total allocation reached 100% of funds available, the second step in the amended formula was to compare these state allotments to 75% of the amount each state would receive under the formula in P.L. 96-223. States would then receive the greater of these two amounts. To see the percentage of funds that each state received under the LIEAP formula, see Table 1, column (a).
Although the alternative formulas under H.Rept. 96-1244 used factors similar to those in P.L. 96-223, the original set of formulas was somewhat more favorable to warm-weather states. For example, the BLS lower living standard, used in all of the P.L. 96-223 formulas but only one of those in H.Rept. 96-1244, was higher than 125% of poverty for most household sizes, which benefitted the South, where the low-income population was higher.41 The original set of formulas in P.L. 96-223 also provided for a minimum benefit to states on the basis of the number of AFDC, SSI, and Food Stamp recipient households, unconditioned on their household heating expenditures. In addition, the inclusion of the increase in home heating expenditures in H. Rept. 96-1244 benefitted Northeastern states, where heating oil prices had increased substantially.42
Table D-2. Distribution of Funds Under LIEAP
|
P.L. 96-223
|
P.L. 96-369
|
|
Assign each state the option under which they receive the greatest proportion of funds. If Options 2 and 3 both result in a greater proportion than Option 1, assign the state the lesser of Option 2 or 3.
|
Each state receives the greater of 75% of the amount under P.L. 96-223 or Option 1 or Option 2 under P.L. 96-369.
|
|
Option 1:
|
½
|
Residential energy expenditures
|
Option 1:
|
½
|
Increase in home heating expenditures from 1978-1980a
|
|
|
½
|
(Heating degree days)2 * Households with income ≤ BLS lower living standard
|
|
½
|
(Heating degree days)2 * Population with income ≤ 125% of poverty
|
|
Option 2:
|
¼
|
Residential energy expenditures
|
Option 2:
|
¼
|
Total residential energy expenditures 1980
|
|
|
¾
|
(Heating degree days)2 * Households with income ≤ BLS lower living standard
|
|
¾
|
(Heating degree days)2 * Households with income ≤ BLS lower living standard
|
|
Option 3:
|
½
|
Residential energy expenditures
|
|
|
|
|
|
½
|
Heating degree days * Households with income ≤ BLS lower living standard
|
|
|
|
|
Option 4:
|
|
Funds sufficient for a minimum benefit of $120 per AFDC, SSI, and Food Stamp- recipient household
|
|
|
|
Source: The Crude Oil Windfall Profits Tax Act (P.L. 96-223) and the House Appropriations Committee Report to Accompany H.R. 7998, the FY1981 Departments of Labor, Health and Human Services, and Education Appropriations Bill, H.Rept. 96-1244, August 21, 1980.
Notes: * Multiplied by.
≤ Less than or equal to.
a. H.Rept. 96-1244 did not specify which years would be used to determine residential energy expenditures; 1978 and 1980 were the years used by HHS.
Enactment of LIHEAP
In August 1981, the Omnibus Budget Reconciliation Act, P.L. 97-35, created LIHEAP, replacing its predecessor, LIEAP. The new program was not substantially different from the previous program. Some of the changes to the program included less restrictive federal rules and more state flexibility in determining how to operate their LIHEAP programs. The program was authorized at $1.85 billion for FY1982-FY1984. In FY1982, Congress appropriated $1.875 billion for LIHEAP; in FY1983, it appropriated $1.975 billion; and in FY1984, $2.075 billion.
Continued Use of the LIEAP Formula
When the formula for LIEAP was initially created in 1980 under the Crude Oil Windfall Profits Tax Act (P.L. 96-223), it brought about a good deal of debate on the floor of the Senate, where the formula provisions were added to the legislation.43 Discussion over the formula also occurred leading up to the enactment of P.L. 96-369, the FY1981 continuing resolution that funded LIEAP and amended the formula.44 Despite these earlier disagreements over formula allocations, the process to enact LIHEAP in 1981 did not engender the same level of debate or result in a different formula. Instead, the law creating LIHEAP provided that the allotment percentages for each state would remain the same as they had been in FY1981 under the LIEAP formula as amended by P.L. 96-369. From FY1982 through FY1984, then, states continued to receive the same percentage of funds that they received under the LIEAP formula.
The 1984 LIHEAP Reauthorization: A New Formula
Formula Discussions
When Congress began to consider reauthorizing LIHEAP in 1983, two aspects of the formula were debated. First, some legislators recognized that the multi-step LIEAP formula benefitted cold-weather states relative to warm-weather states.45 The second debated aspect of the formula centered on the appropriateness and timeliness of the data used in formula calculations. In 1983, the energy information used to calculate state allotments was not the most current data available.46 For example, the most recent data the formula used were the change in the cost of energy between 1978 and 1980, or the cost of energy in 1980, depending on the sub-formula one chose to apply. No aspect of the formula took account of increased costs after 1980.47
Legislative sentiment in favor of changing the formula was evident, when, in September 1983, the House adopted an amendment to the Emergency Immigration Education Act (H.R. 3520) that would have adjusted the LIHEAP formula and resulted in a change in allocations to the states. The amendment's formula took into account the energy expenditures of poor families, which, according to the amendment's sponsor, Representative Carlos Moorhead (California), would result in lower percentage allocations for 23 states, mostly in the Northeast and Midwest, gains for 27, primarily in the South, and the same allocation for one state.48 The amendment was eventually dropped from H.R. 3520 in conference with the Senate.
Introduction of a Hold-Harmless Level
Efforts to reauthorize LIHEAP began in April 1983 with the introduction of the Low-Income Home Energy Assistance Amendments of 1984 (H.R. 2439). The bill was referred to two committees: Education and Labor and Energy and Commerce. Within the Energy and Commerce committee, two subcommittees held markups: Fossil and Synthetic Fuels and Energy Conservation and Power.
As introduced, H.R. 2439 did not contain changes to the LIHEAP formula. The Subcommittees on Fossil and Synthetic Fuels and Energy Conservation and Power worked together to arrive at a formula change, which had the effect of shifting funds from states in the Northeast to the South and West. Unlike the previous set of formulas developed under LIEAP, the new formula directed the Department of Health and Human Services to determine states' allotments "using data relating to the most recent year for which data is available." Because the cost of heating oil remained steady between 1981 and 1983, and the price of natural gas rose 33%, this meant that states in the Northeast—where heating oil was the primary source of energy—would lose LIHEAP dollars, while states in the South and the Midwest would gain under this provision.49 In addition, population growth in the South (as well as its higher poverty rates) meant that southern states would benefit from the use of more recent population data.
To offset the losses to certain states resulting from the use of current data, H.R. 2439 also included a hold-harmless provision, or hold-harmless level; this provision ensured that if appropriations were less than or equal to $1.875 billion, states would receive no less than their allotment would have been under the old formula at this appropriations level. The bill additionally increased the LIHEAP authorization level to $2.075 billion for FY1984, $2.26 billion for FY1985, $2.5 billion in FY1986, $2.625 billion for FY1987, and $2.8 billion for FY1988.
Introduction of a Hold-Harmless Rate
After the House Energy and Commerce Committee reported H.R. 2439 to the House floor—but before the full House could act on the bill—the Senate passed its version of LIHEAP reauthorization as part of the Human Services Reauthorization Act (S. 2565) on October 4, 1984.50 The Senate bill contained language very similar to H.R. 2439, but made several changes and additions to the formula.
- S. 2565 specified that states' shares of LIHEAP funds would be based on the home energy expenditures of low-income households, not on expenditures of all households.
- The hold-harmless level was altered. S. 2565 directed that no state in FY1985 would receive less funding than it received in FY1984, and for FY1986 and thereafter, no state would receive less than the amount they would have received in FY1984 if the appropriations level had been $1.975 billion.
- A second hold-harmless provision, or hold-harmless rate, was created. The provision maintained the percentage allocated rather than a total funding level allocated to each affected state.
The hold-harmless rate provision guaranteed that certain states would receive increased allotments when appropriations reached $2.25 billion. States would qualify for this increase if their total allotment percentage at an appropriation of $2.25 billion were less than 1%. These states would instead receive the allotment rate they would have received at an appropriation of $2.14 billion if that allotment rate were higher than the rate at $2.25 billion. In their debate about S. 2565, Senators referred to the hold-harmless rate as the "small States hold harmless," as the intent was to protect the small (population) states' shares of LIHEAP funds.51 Otherwise, the concern was that appropriations might have to increase significantly before small state allotments would increase above their hold-harmless levels, with the states' percentage shares of funds declining even as total appropriations increased.
The Senate bill also included different authorization amounts for LIHEAP, $2.14 billion for FY1985 and $2.275 billion for FY1986. After S. 2565 passed the Senate, the House debated and passed the bill on October 9, 1984, retaining all the provisions included in the Senate version. The bill became P.L. 98-558, the Human Services Reauthorization Act, on October 30, 1984.