Introduction
This report provides responses to frequently asked questions about the Temporary Assistance for Needy Families (TANF) block grant. It is intended to serve as a quick reference to provide easy access to information and data. Appendix B presents a series of tables with state-level data. This report does not provide information on TANF program rules (for a discussion of TANF rules, see CRS Report RL32748, The Temporary Assistance for Needy Families (TANF) Block Grant: A Primer on TANF Financing and Federal Requirements, by Gene Falk).
Funding and Expenditures
What Is TANF's Funding Status?
On January 24, 2019, the President signed legislation (P.L. 116-4) that funds TANF and related programs through June 30, 2019. The legislation permits states to receive their quarterly TANF grants for the 2nd quarter (January through March) and 3rd quarter (April through June) of FY2019. Additional legislation would be required to pay TANF grants in the final quarter (July through September) of FY2019.
How Are State TANF Programs Funded?
TANF programs are funded through a combination of federal and state funds. In FY2018, TANF has two federal grants to states. The bulk of the TANF funding is in a basic block grant to the states, totaling $16.5 billion for the 50 states, the District of Columbia, Puerto Rico, Guam, the Virgin Islands, and American Indian tribes. There is also a contingency fund available that provides extra federal funds to states that meet certain conditions.
Additionally, states are required to expend a minimum amount of their own funds for TANF and TANF-related activities under what is known as the maintenance of effort (MOE) requirement. States are required to spend at least 75% of what they spent in FY1994 on TANF's predecessor programs. The minimum MOE amount, in total, is $10.3 billion per year for the 50 states, the District of Columbia, and the territories.
How Much Has the Value of the TANF Basic Block Grant Changed Over Time?
TANF was created in the 1996 welfare reform law, the Personal Responsibility and Work Opportunity Reconciliation Act of 1996 (PRWORA, P.L. 104-193). A TANF basic block grant amount—both nationally and for each state—was established in the 1996 welfare reform law. The amount established in that law for the 50 states, District of Columbia, territories, and tribes was $16.6 billion in total. From FY1997 through FY2016, that amount remained the same. It was not adjusted for changes that occur over time, such as inflation, the size of the TANF assistance caseload, or changes in the poverty population. During this period, the real (inflation-adjusted) value of the block grant declined by one-third (33.1%). Beginning with FY2017, the state family assistance grant was reduced by 0.33% from its historical levels to finance TANF-related research and technical assistance. The reduced block grant amount is $16.5 billion.
Table 1 shows the state family assistance grant, in both nominal (actual) and real (inflation-adjusted) dollars for each year, FY1997 through FY2018. In real (inflation-adjusted) terms, the FY2018 block grant was 36% below its value in FY1997.
|
Fiscal Year |
State Family Assistance Grant: 50 States, DC, Tribes, and Territories |
State Family Assistance Grant Constant 1997 Dollars |
Cumulative Percentage Change |
|
1997 |
$16.567 |
$16.567 |
|
|
1998 |
16.567 |
16.306 |
-1.6% |
|
1999 |
16.567 |
15.991 |
-3.5 |
|
2000 |
16.567 |
15.498 |
-6.5 |
|
2001 |
16.567 |
15.020 |
-9.3 |
|
2002 |
16.567 |
14.792 |
-10.7 |
|
2003 |
16.567 |
14.456 |
-12.7 |
|
2004 |
16.567 |
14.124 |
-14.7 |
|
2005 |
16.567 |
13.680 |
-17.4 |
|
2006 |
16.567 |
13.190 |
-20.4 |
|
2007 |
16.567 |
12.893 |
-22.2 |
|
2008 |
16.567 |
12.345 |
-25.5 |
|
2009 |
16.567 |
12.382 |
-25.3 |
|
2010 |
16.567 |
12.182 |
-26.5 |
|
2011 |
16.567 |
11.859 |
-28.4 |
|
2012 |
16.567 |
11.585 |
-30.1 |
|
2013 |
16.567 |
11.394 |
-31.2 |
|
2014 |
16.567 |
11.217 |
-32.3 |
|
2015 |
16.567 |
11.179 |
-32.5 |
|
2016 |
16.567 |
11.082 |
-33.1 |
|
2017 |
16.512 |
10.820 |
-34.7 |
|
2018 |
16.512 |
10.564 |
-36.2 |
Source: Congressional Research Service (CRS) based on data from the U.S. Department of Health and Human Services (HHS), and the U.S. Department of Labor, Bureau of Labor Statistics (BLS).
Notes: Constant dollars were computed using the Consumer Price Index for all Urban Consumers (CPI-U).
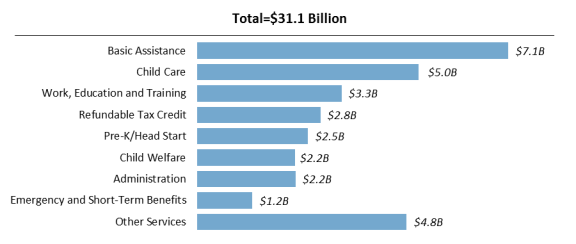
How Have States Used TANF Funds?
Figure 1 shows the uses of federal TANF grants to states and state MOE funds in FY2017. In FY2017, a total of $31.1 billion of both federal TANF and state MOE expenditures were either expended or transferred to other block grant programs. Basic assistance—ongoing benefits to families to meet basic needs—represented 23% ($7.1 billion) of total FY2017 TANF and MOE dollars.
TANF is a major contributor of child care funding. In FY2017, $5 billion (16% of all TANF and MOE funds) were either expended on child care or transferred to the child care block grant (the Child Care and Development Fund, or CCDF). TANF work-related activities (including education and training) were the third-largest TANF and MOE spending category at $3.3 billion, or 11% of total TANF and MOE funds. TANF also helps low-wage parents by helping to finance state refundable tax credits, such as state add-ons to the Earned Income Tax Credit (EITC). TANF and MOE expenditures on refundable tax credits in FY2017 totaled $2.8 billion, or 9% of total TANF and MOE spending.
TANF is also a major contributor to the child welfare system, which provides foster care, adoption assistance, and services to families with children who either have experienced or are at risk of experiencing child abuse or neglect, spending about $2.2 billion on such activities. TANF and MOE funds also help fund state prekindergarten (pre-K) programs, with total FY2017 expenditures for that category also at $2.5 billion. TANF and MOE funds are also used for short-term and emergency benefits and a wide range of other social services.
For state-specific information on the use of TANF funds, see Table B-1 and Table B-2.
How Much of the TANF Grant Has Gone Unspent?
TANF law permits states to "reserve" unused funds without time limit. This permits flexibility in timing of the use of TANF funds, including the ability to "save" funds for unexpected occurrences that might increase costs (such as recessions or natural disasters).
At the end of FY2017 (September 30, 2017, the most recent data currently available), a total of $5.1 billion of federal TANF funding remained neither transferred nor spent. However, some of these unspent funds represent monies that states had already committed to spend later. At the end of FY2017, states had made such commitments to spend—that is, had obligated—a total of $1.8 billion. At the end of FY2017, states had $3.3 billion of "unobligated balances." These funds are available to states to make new spending commitments. Table B-3 shows unspent TANF funds by state.
The Caseload
How Many Families Receive TANF- or MOE-Funded Benefits and Services?
This number is not known. Federal TANF reporting requirements focus on families receiving only ongoing assistance. There is no complete reporting on families receiving other TANF benefits and services.
Assistance is defined as benefits provided to families to meet ongoing, basic needs.1 It is most often paid in cash. However, some states use TANF or MOE funds to provide an "earnings supplement" to working parents added to monthly Supplemental Nutrition Assistance Program (SNAP) allotments. These "earnings supplements" are paid separately from the regular TANF cash assistance program. Additionally, TANF MOE dollars are used to fund food assistance for immigrants barred from regular SNAP benefits in certain states. These forms of nutrition aid meet an ongoing need, and thus are considered TANF assistance.
As discussed in a previous section of this report, TANF basic assistance accounts for about 24% of all TANF expenditures. Therefore, the federal reporting requirements that pertain to families receiving "assistance" are likely to undercount the number of families receiving any TANF-funded benefit or service.
How Many Families and People Currently Receive TANF- or MOE-Funded "Assistance"?
Table 2 provides assistance caseload information. A total of 1.2 million families, composed of 3.1 million recipients, received TANF- or MOE-funded assistance in September 2018. The bulk of the "recipients" were children—2.3 million in that month. For state-by-state assistance caseloads, see Table B-4.
|
Families |
1,175,335 |
|
Recipients |
3,104,094 |
|
Child Recipients |
2,280,173 |
|
Adult Recipients |
823,921 |
Source: Congressional Research Service (CRS) based on data from the U.S. Department of Health and Human Services (HHS).
Notes: TANF cash assistance caseload includes families receiving assistance in state-funded programs counted toward the TANF maintenance of effort (MOE) requirement.
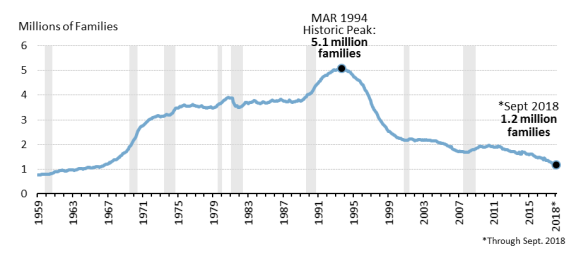
How Does the Current Assistance Caseload Level Compare with Historical Levels?
Figure 2 provides a long-term historical perspective on the number of families receiving assistance from TANF or its predecessor program, from July 1959 to September 2017. The shaded areas of the figure represent months when the national economy was in recession. Though the health of the national economy has affected the trend in the cash assistance caseload, the long-term trend in receipt of cash assistance does not follow a classic countercyclical pattern. Such a pattern would have the caseload rise during economic slumps, and then fall again during periods of economic growth. Factors other than the health of the economy (demographic trends, policy changes) also have influenced the caseload trend.
The figure shows two periods of sustained caseload increases: the period from the mid-1960s to the mid-1970s and a second period from 1988 to 1994. The number of families receiving assistance peaked in March 1994 at 5.1 million families. The assistance caseload fell rapidly in the late 1990s (after the 1996 welfare reform law) before leveling off in 2001. In 2004, the caseload began another decline, albeit at a slower pace than in the late 1990s. During the recent 2007-2009 recession and its aftermath, the caseload began to rise from 1.7 million families in August 2008, peaking in December 2010 at close to 2.0 million families. By September 2018, the assistance caseload had declined to 1.2 million families.
|
Figure 2. Number of Families Receiving Cash Assistance, July 1959-September 2018 |
 |
|
Source: Congressional Research Service (CRS) with data from the U.S. Department of Health and Human Services (HHS). Notes: Shaded areas denote months when the national economy was in recession. Information represents families receiving cash assistance from Aid to Dependent Children (ADC), Aid to Families with Dependent Children (AFDC), and TANF. For October 1999 through September 2018, includes families receiving assistance from Separate State Programs (SSPs) with expenditures countable toward the TANF maintenance of effort requirement. See Table A-1 for average annual data on families, recipients, adult recipients, and child recipients of ADC, AFDC, and TANF cash assistance for 1961 to 2017. |
Table B-5 shows recent trends in the number of cash assistance families by state.
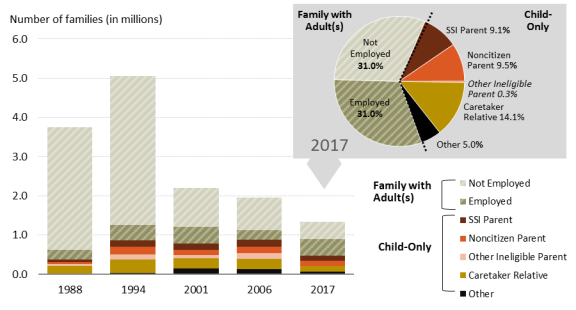
What Are the Characteristics of Families Receiving TANF Assistance?
Before PRWORA, the "typical" family receiving assistance has been headed by a single parent (usually the mother) with one or two children. That single parent has also typically been unemployed. However, over the past 20 years the assistance caseload decline has occurred together with a major shift in the composition of the rolls. Figure 3 shows the change in the size and composition of the assistance caseload under both AFDC (1988 and 1994) and TANF. In FY1988, an estimated 84% of AFDC families were headed by an unemployed adult recipient. In FY2016, families with an unemployed adult recipient represented 32% of all cash assistance families. This decline occurred, in large part, as the number of families headed by unemployed adult recipients declined more rapidly than other components of the assistance caseload. In FY1994, a monthly average of 3.8 million families per month who received AFDC cash assistance had adult recipients who were not working. In FY2016, a monthly average of 485,000 families per month had adult recipients or work-eligible individuals, with no adult recipient or work-eligible individual working.
With the decline in families headed by unemployed adults, the share of the caseload represented by families with employed adults and "child only" families has increased. In FY2017, families with all adult recipients unemployed and families with employed adult recipients each represented 31% of all assistance families. The latter category includes families in "earnings supplement" programs separate from the regular TANF cash assistance program. "Child-only" families are those where no adult recipient receives benefits in their own right; the family receives benefits on behalf of its children. The share of the caseload that was child-only in FY2017 was 38%. In FY2017, families with a nonrecipient, nonparent relative (grandparents, aunts, uncles) represented 14% of all assistance families. Families with ineligible, noncitizen adults or adults who have not reported their citizenship status made up 9% of the assistance caseload in that year. Families where the parent received Supplemental Security Income (SSI) and the children received TANF made up 9% of all assistance families in FY2017.
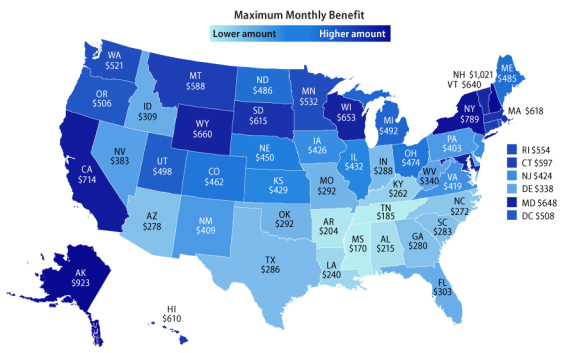
TANF Cash Benefits: How Much Does a Family Receive in TANF Cash Per Month?
There are no federal rules that help determine the amount of TANF cash benefits paid to a family. (There are also no federal rules that require states to use TANF to pay cash benefits, though all states do so.) Benefit amounts are determined solely by the states.
Most states base TANF cash benefit amounts on family size, paying larger cash benefits to larger families on the presumption that they have greater financial needs. The maximum monthly cash benefit is usually paid to a family that receives no other income (e.g., no earned or unearned income) and complies with program rules. Families with income other than TANF often are paid a reduced benefit. Moreover, some families are financially sanctioned for not meeting a program requirement (e.g., a work requirement), and are also paid a lower benefit.
Figure 4 shows the maximum monthly TANF cash benefit by state for a single mother caring for two children (family of three) in July 2016.2 The benefit amounts shown are those for a single-parent family with two children.3 For a family of three, the maximum TANF benefit paid in July 2017 varied from $170 per month in Mississippi to $1,201 per month in New Hampshire. The map shows a regional pattern to the maximum monthly benefit paid, with lower benefit amounts in the South than in other regions. Only New Hampshire (at 60% of the federal poverty guidelines) had a maximum TANF cash assistance amount for this sized family in excess of 50% of poverty-level income.4
TANF Work Participation Standards
TANF's main federal work requirement is actually a performance measure that applies to the states, rather than individual recipients. States determine the work rules that apply to individual recipients.
What Is the TANF Work Participation Standard States Must Meet?
The TANF statute requires states to have 50% of their caseload meet standards of participation in work or activities—that is, a family member must be in specified activities for a minimum number of hours.5 There is a separate participation standard that applies to the two-parent portion of a state's caseload, requiring 90% of the state's two-parent caseload to meet participation standards.
However, the statutory work participation standards are reduced by a "caseload reduction credit." The caseload reduction credit reduces the participation standard one percentage point for each percentage point decline in a state's caseload. Additionally, under a regulatory provision, a state may get "extra" credit for caseload reduction if it spends more than required under the TANF MOE. Therefore, the effective standards states face are often less than the 50% and 90% targets, and vary by state and by year.
States that do not meet the TANF work participation standard are at risk of being penalized through a reduction in their block grant. However, penalties can be forgiven if a state claims, and the Secretary of HHS finds, that it had "reasonable cause" for not meeting the standard. Penalties can also be forgiven for states that enter into "corrective compliance plans," and subsequently meet the work standard.
Have There Been Changes in the Work Participation Rules Enacted Since the 1996 Welfare Reform Law?
The 50% and 90% target standards that states face, as well as the caseload reduction credit, date back to the 1996 welfare reform law. However, the Deficit Reduction Act of 2005 (DRA, P.L. 109-171) made several changes to the work participation rules effective in FY2007
- The caseload reduction credit was changed to measure caseload reduction from FY2005, rather than the original law's FY1995.
- The work participation standards were broadened to include families receiving cash aid in "separate state programs." Separate state programs are programs run with state funds, distinct from a state's "TANF program," but with expenditures countable toward the TANF MOE.
- HHS was instructed to provide definition to the allowable TANF work activities listed in law. HHS was also required to define what is meant by a "work-eligible" individual, expanding the number of families that are included in the work participation calculation.
- States were required to develop plans and procedures to verify work activities.
The American Recovery and Reinvestment Act of 2009 (ARRA, P.L. 111-5), a law enacted in response to the sharp economic downturn of 2007-2009, held states "harmless" for caseload increases affecting the work participation standards for FY2009 through FY2011. It did so by allowing states to "freeze" caseload reduction credits at pre-recession levels through the FY2011 standards.
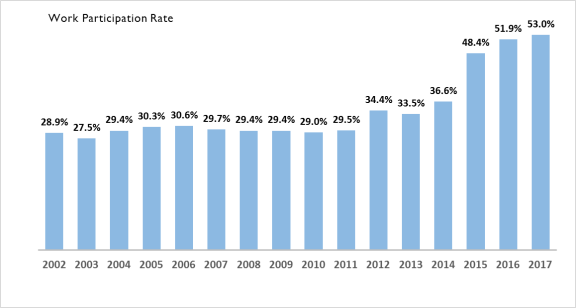
What Work Participation Rates Have the States Achieved?
HHS computes two work participation rates for each state that are then compared with the effective (after-credit) standard to determine if it has met the TANF work standard. An "all-families" work participation rate is computed and compared with the all-families effective standard (50% minus the state's caseload reduction credit). HHS also computes a two-parent work participation rate that is compared with the two-parent effective standard (90% minus the state's caseload reduction credit).
Figure 5 shows the national average all-families work participation rate for FY2002 through FY2017. For the period FY2002 through FY2011, states achieved an average all-families work participation rate hovering around 30%. The work participation rate increased since then. In FY2016, it exceeded 50% for the first time since TANF was established. However, it is important to note that the increase in the work participation rate has not come from an increase in the number of recipients in regular TANF assistance programs who are either working or in job preparation activities. This increase stems mostly from states creating new "earnings supplement" programs that use TANF funds to aid working parents in the Supplemental Nutrition Assistance Program (SNAP, formerly food stamps) or who have left the regular TANF assistance programs for work.6
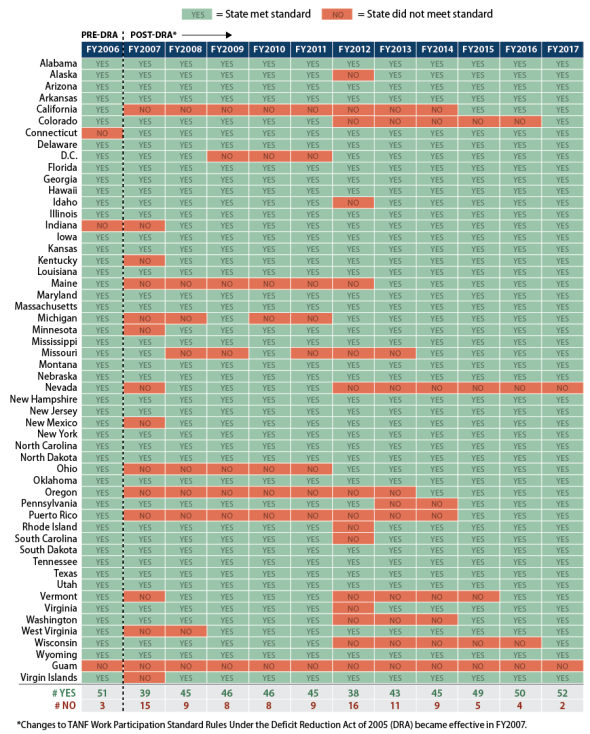
How Many Jurisdictions Did Not Meet the All-Families Standard?
Figure 6 shows which states did not meet the TANF all-families work participation standards from FY2006 through FY2017. Before FY2007, the first year that DRA was effective, only a few jurisdictions did not meet TANF all-families work participation standards. However, in FY2007, 15 jurisdictions did not meet the all-families standard. This number declined to 9 in FY2008 and 8 in FY2009.
In FY2012, despite the uptick in the national average work participation rate, 16 states did not meet the all-family standard, the largest number of states that did not meet their participation standards in any one year since the enactment of TANF. FY2012 was the year that ARRA's "freeze" of the caseload reduction credit expired, and states were generally required to meet higher standards than in previous years.
The number of jurisdictions that did not meet the all-families standard declined over the FY2012 to FY2017 period. In FY2017, two jurisdictions did not meet the all-family participation standard: Nevada and Guam.
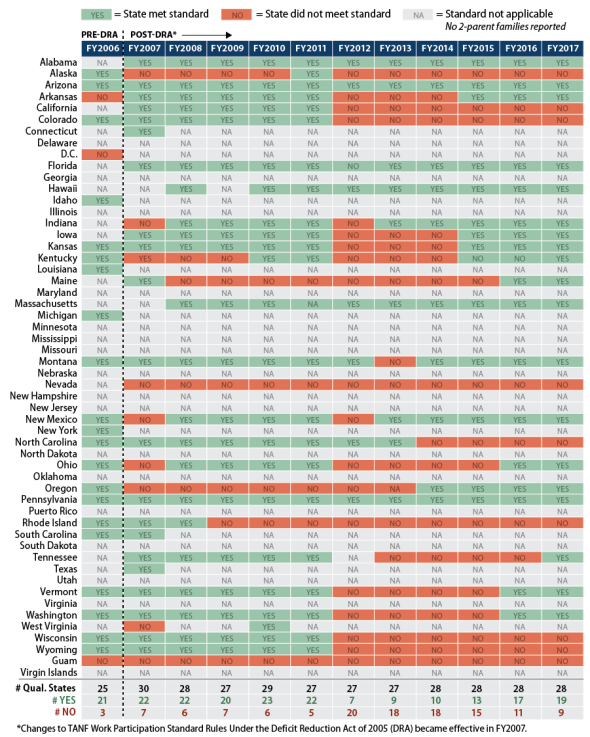
Have States Met the Two-Parent Work Participation Standard?
In addition to meeting a work standard for all families, TANF also imposes a second standard—90%—for the two-parent portion of its cash assistance caseload. This standard can also be lowered by caseload reduction.
Figure 7 shows whether each state met its two-parent work participation standard for FY2006 through FY2017. However, the display on the table is more complex than that for reporting whether a state met or did not meet its "all family" rate.
A substantial number of states have reported no two-parent families subject to the work participation standard. These states are denoted on the table with an "NA," indicating that the two-parent standard was not applicable to the state in that year. Before the changes made by the DRA were effective, a number of states had their two-parent families in separate state programs that were not included in the work participation calculation. When DRA brought families receiving assistance in separate state programs into the work participation rate calculations, a number of states moved these families into solely state-funded programs. These are state-funded programs with expenditures not countable toward the TANF maintenance of effort requirement, and hence are outside of TANF's rules.
For states with two-parent families in their caseloads, the table reports "Yes" for states that met the two-parent standard, and "No" for states that did not meet the two-parent standard. Of the 28 jurisdictions that had two-parent families in their FY2017 TANF work participation calculation, 19 met the standard and 9 did not.
Appendix A. Supplementary Tables
|
TANF Child Recipients |
||||||||
|
Year |
Families (millions) |
Recipients (millions) |
Adults (millions) |
Children (millions) |
As a Percentage of All Children |
As a Percentage of All Poor Children |
||
|
1961 |
0.873 |
3.363 |
0.765 |
2.598 |
3.7% |
14.3% |
||
|
1962 |
0.939 |
3.704 |
0.860 |
2.844 |
4.0 |
15.7 |
||
|
1963 |
0.963 |
3.945 |
0.988 |
2.957 |
4.1 |
17.4 |
||
|
1964 |
1.010 |
4.195 |
1.050 |
3.145 |
4.3 |
18.6 |
||
|
1965 |
1.060 |
4.422 |
1.101 |
3.321 |
4.5 |
21.5 |
||
|
1966 |
1.096 |
4.546 |
1.112 |
3.434 |
4.7 |
26.5 |
||
|
1967 |
1.220 |
5.014 |
1.243 |
3.771 |
5.2 |
31.2 |
||
|
1968 |
1.410 |
5.702 |
1.429 |
4.274 |
5.9 |
37.8 |
||
|
1969 |
1.696 |
6.689 |
1.716 |
4.973 |
6.9 |
49.7 |
||
|
1970 |
2.207 |
8.462 |
2.250 |
6.212 |
8.6 |
57.7 |
||
|
1971 |
2.763 |
10.242 |
2.808 |
7.435 |
10.4 |
68.5 |
||
|
1972 |
3.048 |
10.944 |
3.039 |
7.905 |
11.1 |
74.9 |
||
|
1973 |
3.148 |
10.949 |
3.046 |
7.903 |
11.2 |
79.9 |
||
|
1974 |
3.219 |
10.847 |
3.041 |
7.805 |
11.2 |
75.0 |
||
|
1975 |
3.481 |
11.319 |
3.248 |
8.071 |
11.8 |
71.2 |
||
|
1976 |
3.565 |
11.284 |
3.302 |
7.982 |
11.8 |
76.2 |
||
|
1977 |
3.568 |
11.015 |
3.273 |
7.743 |
11.6 |
73.9 |
||
|
1978 |
3.517 |
10.551 |
3.188 |
7.363 |
11.2 |
72.8 |
||
|
1979 |
3.509 |
10.312 |
3.130 |
7.181 |
11.0 |
68.0 |
||
|
1980 |
3.712 |
10.774 |
3.355 |
7.419 |
11.5 |
63.2 |
||
|
1981 |
3.835 |
11.079 |
3.552 |
7.527 |
11.7 |
59.2 |
||
|
1982 |
3.542 |
10.358 |
3.455 |
6.903 |
10.8 |
49.6 |
||
|
1983 |
3.686 |
10.761 |
3.663 |
7.098 |
11.1 |
50.1 |
||
|
1984 |
3.714 |
10.831 |
3.687 |
7.144 |
11.2 |
52.3 |
||
|
1985 |
3.701 |
10.855 |
3.658 |
7.198 |
11.3 |
54.4 |
||
|
1986 |
3.763 |
11.038 |
3.704 |
7.334 |
11.5 |
56.0 |
||
|
1987 |
3.776 |
11.027 |
3.661 |
7.366 |
11.5 |
56.4 |
||
|
1988 |
3.749 |
10.915 |
3.586 |
7.329 |
11.4 |
57.8 |
||
|
1989 |
3.798 |
10.992 |
3.573 |
7.419 |
11.5 |
57.9 |
||
|
1990 |
4.057 |
11.695 |
3.784 |
7.911 |
12.1 |
57.9 |
||
|
1991 |
4.497 |
12.930 |
4.216 |
8.715 |
13.2 |
59.8 |
||
|
1992 |
4.829 |
13.773 |
4.470 |
9.303 |
13.9 |
59.9 |
||
|
1993 |
5.012 |
14.205 |
4.631 |
9.574 |
14.1 |
60.0 |
||
|
1994 |
5.033 |
14.161 |
4.593 |
9.568 |
13.9 |
61.7 |
||
|
1995 |
4.791 |
13.418 |
4.284 |
9.135 |
13.1 |
61.5 |
||
|
1996 |
4.434 |
12.321 |
3.928 |
8.600 |
12.3 |
58.7 |
||
|
1997 |
3.740 |
10.376 |
NA |
NA |
10.0 |
50.1 |
||
|
1998 |
3.050 |
8.347 |
NA |
NA |
8.1 |
42.9 |
||
|
1999 |
2.578 |
6.924 |
NA |
NA |
6.7 |
39.4 |
||
|
2000 |
2.303 |
6.143 |
1.655 |
4.479 |
6.1 |
38.1 |
||
|
2001 |
2.192 |
5.717 |
1.514 |
4.195 |
5.7 |
35.3 |
||
|
2002 |
2.187 |
5.609 |
1.479 |
4.119 |
5.6 |
33.6 |
||
|
2003 |
2.180 |
5.490 |
1.416 |
4.063 |
5.5 |
31.3 |
||
|
2004 |
2.153 |
5.342 |
1.362 |
3.969 |
5.4 |
30.2 |
||
|
2005 |
2.061 |
5.028 |
1.261 |
3.756 |
5.1 |
28.9 |
||
|
2006 |
1.906 |
4.582 |
1.120 |
3.453 |
4.6 |
26.7 |
||
|
2007 |
1.730 |
4.075 |
0.956 |
3.119 |
4.2 |
23.2 |
||
|
2008 |
1.701 |
4.005 |
0.946 |
3.059 |
4.1 |
21.6 |
||
|
2009 |
1.838 |
4.371 |
1.074 |
3.296 |
4.4 |
21.2 |
||
|
2010 |
1.919 |
4.598 |
1.163 |
3.435 |
4.6 |
20.9 |
||
|
2011 |
1.907 |
4.557 |
1.149 |
3.408 |
4.6 |
20.9 |
||
|
2012 |
1.852 |
4.402 |
1.104 |
3.298 |
4.4 |
20.3 |
||
|
2013 |
1.726 |
4.042 |
0.993 |
3.050 |
4.1 |
19.1 |
||
|
2014 |
1.650 |
3.957 |
1.007 |
2.950 |
4.0 |
18.9 |
||
|
2015 |
1.609 |
4.126 |
1.155 |
2.971 |
4.0 |
20.4 |
||
|
2016 |
1.479 |
3.780 |
1.037 |
2.743 |
3.7 |
20.7 |
||
|
2017 |
1.358 |
3.516 |
0,930 |
|
3.5 |
20.1 |
||
Source: Congressional Research Service (CRS), based on data from the U.S. Department of Health and Human Services (HHS) and the U.S. Census Bureau.
Notes: NA denotes not available. During transition reporting from AFDC to TANF, caseload statistics on adult and child recipients were not collected. For those years, TANF children as a percent of all children and percent of all poor children were estimated by HHS and published in Welfare Indicators and Risk Factors, Annual Report to Congress, Table TANF 2, p. A-7. See http://aspe.hhs.gov/hsp/14/indicators/rpt_indicators.pdf.
Table A-2. Families Receiving AFDC/TANF Assistance by Family Category, Selected Years, FY1988-FY2017
|
AFDC |
TANF |
||||
|
|
1988 |
1994 |
2001 |
2006 |
2017 |
|
Number of Families Receiving Assistance |
|||||
|
Adult Recipient or Work-Eligible Parent/Not Working |
3,136,566 |
3,798,997 |
992,445 |
825,490 |
434,602 |
|
Adult Recipient or Work-Eligible Parent/Working |
243,573 |
378,620 |
420,794 |
259,001 |
435,259 |
|
Child-Only/SSI Parent |
59,988 |
171,391 |
171,951 |
176,670 |
126,483 |
|
Child-Only/Noncitizen Parent |
47,566 |
184,397 |
125,900 |
153,445 |
133,173 |
|
Child-Only/Other Ineligible Parent |
51,764 |
146,227 |
91,447 |
158,113 |
4,370 |
|
Child-Only/Caretaker Relative |
188,598 |
328,290 |
255,984 |
261,944 |
198,103 |
|
Child-Only/Unknown |
19,897 |
38,341 |
143,834 |
122,738 |
70,882 |
|
Totals |
3,747,952 |
5,046,263 |
2,202,356 |
1,957,402 |
1,402,871 |
|
Percentage of All Families Receiving Assistance |
|||||
|
Adult Recipient or Work-Eligible Parent/Not Working |
83.7% |
75.3% |
45.1% |
42.2% |
31.0% |
|
Adult Recipient or Work-Eligible Parent/Working |
6.5 |
7.5 |
19.1 |
13.2 |
31.0 |
|
Child-Only/SSI Parent |
1.6 |
3.4 |
7.8 |
9.0 |
9.0 |
|
Child-Only/Noncitizen Parent |
1.3 |
3.7 |
5.7 |
7.8 |
9.5 |
|
Child-Only/Other Ineligible Parent |
1.4 |
2.9 |
4.2 |
8.1 |
0.3 |
|
Child-Only/Caretaker Relative |
5.0 |
6.5 |
11.6 |
13.4 |
14.1 |
|
Child-Only/Unknown |
0.5 |
0.8 |
6.5 |
6.3 |
5.1 |
|
Totals |
100.0 |
100.0 |
100.0 |
100.0 |
100.0 |
Source: Congressional Research Service (CRS) tabulations of the FY1988 and FY1994 AFDC Quality Control (QC) data files and the FY2001, FY2006, and FY2017 TANF National Data Files.
Notes: FY2001 through FY2017 data include families receiving assistance from separate state programs (SSPs) with expenditures countable toward the TANF maintenance of effort (MOE) requirement. For FY2016, TANF families with an adult recipient include those families with "work-eligible" nonrecipient parents. These include nonrecipient parents who have been time-limited or sanctioned off the rolls, but the family continues to receive a reduced benefit. For FY2001 and FY2006, such families cannot be identified and are classified as "child-only" families.
|
State |
Basic Assistance |
Administrative Costs |
Work, Education, and Training |
Child Care |
Refundable Tax Credit |
Emergency and Short-Term Benefits |
Child Welfare |
Pre-K/Head Start |
Other |
Totals |
|
Alabama |
$22.318 |
$26.710 |
$5.349 |
$5.679 |
$0.000 |
$36.833 |
$32.240 |
$41.648 |
$40.208 |
$210.984 |
|
Alaska |
58.114 |
6.024 |
8.397 |
8.879 |
0.000 |
0.000 |
0.000 |
0.000 |
4.985 |
86.399 |
|
Arizona |
37.732 |
43.656 |
1.443 |
0.000 |
0.000 |
10.369 |
147.105 |
0.000 |
119.624 |
359.929 |
|
Arkansas |
5.948 |
18.829 |
13.920 |
8.032 |
0.000 |
5.368 |
0.231 |
105.196 |
4.811 |
162.335 |
|
California |
2539.250 |
573.786 |
1620.135 |
615.700 |
0.000 |
237.887 |
0.000 |
0.000 |
1010.169 |
6596.928 |
|
Colorado |
89.927 |
23.474 |
10.687 |
11.929 |
77.489 |
31.389 |
46.532 |
74.851 |
43.716 |
409.995 |
|
Connecticut |
52.352 |
46.885 |
12.037 |
41.764 |
0.000 |
18.646 |
61.273 |
83.561 |
171.132 |
487.651 |
|
Delaware |
17.421 |
4.736 |
7.063 |
67.490 |
0.000 |
2.724 |
0.000 |
0.000 |
15.160 |
114.595 |
|
District of Columbia |
121.650 |
8.398 |
37.991 |
59.532 |
28.928 |
51.110 |
0.000 |
0.000 |
9.299 |
316.909 |
|
Florida |
163.180 |
83.371 |
46.314 |
318.206 |
0.000 |
0.934 |
242.113 |
0.000 |
80.542 |
934.661 |
|
Georgia |
86.540 |
20.570 |
11.265 |
22.183 |
0.000 |
0.085 |
257.554 |
0.000 |
90.828 |
489.024 |
|
Hawaii |
39.957 |
16.540 |
52.170 |
4.972 |
0.000 |
0.425 |
1.294 |
0.000 |
84.876 |
200.233 |
|
Idaho |
7.871 |
7.519 |
2.549 |
15.025 |
0.000 |
11.750 |
1.327 |
1.475 |
1.713 |
49.229 |
|
Illinois |
43.419 |
0.184 |
18.685 |
596.459 |
47.254 |
0.916 |
221.080 |
58.586 |
79.217 |
1065.801 |
|
Indiana |
16.714 |
23.452 |
182.300 |
112.404 |
28.904 |
0.546 |
15.520 |
0.000 |
131.405 |
511.244 |
|
Iowa |
37.166 |
8.206 |
11.799 |
58.254 |
26.505 |
0.253 |
62.264 |
0.000 |
22.299 |
226.746 |
|
Kansas |
13.920 |
14.568 |
1.594 |
6.673 |
48.347 |
0.071 |
22.980 |
14.437 |
50.495 |
173.086 |
|
Kentucky |
170.762 |
14.601 |
29.380 |
38.815 |
0.000 |
0.000 |
0.000 |
0.000 |
15.474 |
269.032 |
|
Louisiana |
19.191 |
18.079 |
26.153 |
10.214 |
14.671 |
9.471 |
33.144 |
45.991 |
35.029 |
211.945 |
|
Maine |
25.693 |
3.138 |
0.310 |
14.888 |
7.561 |
4.162 |
7.683 |
0.415 |
28.130 |
91.980 |
|
Maryland |
115.787 |
31.019 |
31.450 |
8.397 |
152.582 |
26.370 |
20.035 |
55.962 |
55.808 |
497.410 |
|
Massachusetts |
207.063 |
36.557 |
174.674 |
327.404 |
174.125 |
103.873 |
8.311 |
0.000 |
66.263 |
1,098.270 |
|
Michigan |
133.132 |
53.908 |
5.417 |
26.586 |
45.440 |
66.929 |
81.665 |
186.193 |
649.995 |
1,249.266 |
|
Minnesota |
98.144 |
46.341 |
57.751 |
173.904 |
160.076 |
27.478 |
0.000 |
5.700 |
19.524 |
588.918 |
|
Mississippi |
8.585 |
4.572 |
33.655 |
27.660 |
0.000 |
0.000 |
12.859 |
0.000 |
43.971 |
131.302 |
|
Missouri |
42.341 |
7.317 |
19.813 |
64.380 |
0.000 |
59.191 |
102.816 |
0.000 |
60.586 |
356.444 |
|
Montana |
26.080 |
7.451 |
6.282 |
10.495 |
0.000 |
2.195 |
3.187 |
0.000 |
9.708 |
65.397 |
|
Nebraska |
26.603 |
5.383 |
14.079 |
23.489 |
35.062 |
0.000 |
2.836 |
0.000 |
0.290 |
107.742 |
|
Nevada |
39.108 |
9.559 |
1.362 |
17.887 |
0.000 |
0.000 |
0.000 |
0.000 |
34.465 |
102.382 |
|
New Hampshire |
18.987 |
11.041 |
5.403 |
15.118 |
0.000 |
2.213 |
3.662 |
0.000 |
17.081 |
73.505 |
|
New Jersey |
99.529 |
52.403 |
77.142 |
159.671 |
354.819 |
16.630 |
0.000 |
560.009 |
58.912 |
1,379.114 |
|
New Mexico |
55.422 |
5.073 |
18.259 |
30.528 |
74.623 |
0.000 |
0.895 |
17.600 |
84.412 |
286.811 |
|
New York |
1,455.625 |
389.219 |
147.068 |
355.940 |
1,410.980 |
219.797 |
290.559 |
467.685 |
361.475 |
5,098.348 |
|
North Carolina |
41.570 |
43.356 |
4.785 |
194.900 |
0.000 |
5.077 |
125.782 |
115.709 |
44.926 |
576.104 |
|
North Dakota |
4.070 |
4.422 |
4.070 |
1.102 |
0.000 |
0.019 |
17.270 |
0.000 |
1.274 |
32.226 |
|
Ohio |
246.989 |
117.873 |
87.008 |
424.009 |
0.000 |
53.852 |
11.099 |
0.000 |
191.421 |
1,132.250 |
|
Oklahoma |
42.603 |
11.274 |
10.776 |
48.668 |
0.000 |
3.536 |
15.999 |
12.079 |
29.282 |
174.217 |
|
Oregon |
89.263 |
39.235 |
16.558 |
12.911 |
1.467 |
32.130 |
12.811 |
12.001 |
87.605 |
303.981 |
|
Pennsylvania |
186.912 |
79.850 |
98.385 |
488.909 |
0.000 |
15.459 |
0.000 |
154.677 |
169.790 |
1,193.982 |
|
Rhode Island |
24.435 |
5.434 |
10.869 |
41.679 |
19.129 |
26.237 |
27.334 |
0.800 |
10.171 |
166.088 |
|
South Carolina |
38.231 |
24.983 |
14.782 |
4.085 |
0.000 |
0.000 |
0.000 |
26.794 |
54.010 |
162.886 |
|
South Dakota |
13.813 |
2.581 |
3.866 |
0.803 |
0.000 |
3.174 |
1.958 |
0.000 |
3.057 |
29.254 |
|
Tennessee |
62.597 |
22.152 |
9.618 |
18.976 |
0.000 |
0.000 |
0.000 |
61.668 |
1.377 |
176.387 |
|
Texas |
50.837 |
77.601 |
82.284 |
0.000 |
0.000 |
32.166 |
284.108 |
342.674 |
59.966 |
929.636 |
|
Utah |
25.289 |
8.863 |
26.555 |
21.438 |
0.000 |
4.419 |
3.676 |
5.501 |
33.702 |
129.443 |
|
Vermont |
15.230 |
6.631 |
2.696 |
30.996 |
19.013 |
1.360 |
5.508 |
0.000 |
15.842 |
97.276 |
|
Virginia |
68.485 |
31.387 |
38.944 |
32.558 |
0.371 |
5.269 |
0.000 |
0.000 |
84.885 |
261.900 |
|
Washington |
143.608 |
88.021 |
145.004 |
222.086 |
0.000 |
56.731 |
0.000 |
61.125 |
315.382 |
1,031.957 |
|
West Virginia |
26.753 |
15.010 |
0.461 |
15.321 |
0.000 |
19.584 |
35.656 |
0.000 |
26.644 |
139.428 |
|
Wisconsin |
85.911 |
24.187 |
27.486 |
208.262 |
69.700 |
38.553 |
4.484 |
0.000 |
122.860 |
581.443 |
|
Wyoming |
6.706 |
6.481 |
3.508 |
1.554 |
0.000 |
3.399 |
0.000 |
1.016 |
4.952 |
27.615 |
|
Totals |
7,068.836 |
2,231.910 |
3,279.551 |
5,026.817 |
2,797.046 |
1,248.578 |
2,224.848 |
2,513.354 |
4,758.747 |
31,149.686 |
Source: Congressional Research Service (CRS), based on data from the U.S. Department of Health and Human Services (HHS).
Table B-2. Use of FY2017 TANF and MOE Funds by Category as a Percentage of Total Federal TANF and State MOE Funding
|
Basic Assistance |
Administrative Costs |
Work, Education, and Training |
Child Care |
Refundable Tax Credit |
Emergency and Short-Term Benefits |
Child Welfare |
Pre-K/Head Start |
Other |
Totals |
||
|
Alabama |
10.6% |
12.7% |
2.5% |
2.7% |
0.0% |
17.5% |
15.3% |
19.7% |
19.1% |
100.0% |
|
|
Alaska |
67.3 |
7.0 |
9.7 |
10.3 |
0.0 |
0.0 |
0.0 |
0.0 |
5.8 |
100.0 |
|
|
Arizona |
10.5 |
12.1 |
0.4 |
0.0 |
0.0 |
2.9 |
40.9 |
0.0 |
33.2 |
100.0 |
|
|
Arkansas |
3.7 |
11.6 |
8.6 |
4.9 |
0.0 |
3.3 |
0.1 |
64.8 |
3.0 |
100.0 |
|
|
California |
38.5 |
8.7 |
24.6 |
9.3 |
0.0 |
3.6 |
0.0 |
0.0 |
15.3 |
100.0 |
|
|
Colorado |
21.9 |
5.7 |
2.6 |
2.9 |
18.9 |
7.7 |
11.3 |
18.3 |
10.7 |
100.0 |
|
|
Connecticut |
10.7 |
9.6 |
2.5 |
8.6 |
0.0 |
3.8 |
12.6 |
17.1 |
35.1 |
100.0 |
|
|
Delaware |
15.2 |
4.1 |
6.2 |
58.9 |
0.0 |
2.4 |
0.0 |
0.0 |
13.2 |
100.0 |
|
|
District of Columbia |
38.4 |
2.6 |
12.0 |
18.8 |
9.1 |
16.1 |
0.0 |
0.0 |
2.9 |
100.0 |
|
|
Florida |
17.5 |
8.9 |
5.0 |
34.0 |
0.0 |
0.1 |
25.9 |
0.0 |
8.6 |
100.0 |
|
|
Georgia |
17.7 |
4.2 |
2.3 |
4.5 |
0.0 |
0.0 |
52.7 |
0.0 |
18.6 |
100.0 |
|
|
Hawaii |
20.0 |
8.3 |
26.1 |
2.5 |
0.0 |
0.2 |
0.6 |
0.0 |
42.4 |
100.0 |
|
|
Idaho |
16.0 |
15.3 |
5.2 |
30.5 |
0.0 |
23.9 |
2.7 |
3.0 |
3.5 |
100.0 |
|
|
Illinois |
4.1 |
0.0 |
1.8 |
56.0 |
4.4 |
0.1 |
20.7 |
5.5 |
7.4 |
100.0 |
|
|
Indiana |
3.3 |
4.6 |
35.7 |
22.0 |
5.7 |
0.1 |
3.0 |
0.0 |
25.7 |
100.0 |
|
|
Iowa |
16.4 |
3.6 |
5.2 |
25.7 |
11.7 |
0.1 |
27.5 |
0.0 |
9.8 |
100.0 |
|
|
Kansas |
8.0 |
8.4 |
0.9 |
3.9 |
27.9 |
0.0 |
13.3 |
8.3 |
29.2 |
100.0 |
|
|
Kentucky |
63.5 |
5.4 |
10.9 |
14.4 |
0.0 |
0.0 |
0.0 |
0.0 |
5.8 |
100.0 |
|
|
Louisiana |
9.1 |
8.5 |
12.3 |
4.8 |
6.9 |
4.5 |
15.6 |
21.7 |
16.5 |
100.0 |
|
|
Maine |
27.9 |
3.4 |
0.3 |
16.2 |
8.2 |
4.5 |
8.4 |
0.5 |
30.6 |
100.0 |
|
|
Maryland |
23.3 |
6.2 |
6.3 |
1.7 |
30.7 |
5.3 |
4.0 |
11.3 |
11.2 |
100.0 |
|
|
Massachusetts |
18.9 |
3.3 |
15.9 |
29.8 |
15.9 |
9.5 |
0.8 |
0.0 |
6.0 |
100.0 |
|
|
Michigan |
10.7 |
4.3 |
0.4 |
2.1 |
3.6 |
5.4 |
6.5 |
14.9 |
52.0 |
100.0 |
|
|
Minnesota |
16.7 |
7.9 |
9.8 |
29.5 |
27.2 |
4.7 |
0.0 |
1.0 |
3.3 |
100.0 |
|
|
Mississippi |
6.5 |
3.5 |
25.6 |
21.1 |
0.0 |
0.0 |
9.8 |
0.0 |
33.5 |
100.0 |
|
|
Missouri |
11.9 |
2.1 |
5.6 |
18.1 |
0.0 |
16.6 |
28.8 |
0.0 |
17.0 |
100.0 |
|
|
Montana |
39.9 |
11.4 |
9.6 |
16.0 |
0.0 |
3.4 |
4.9 |
0.0 |
14.8 |
100.0 |
|
|
Nebraska |
24.7 |
5.0 |
13.1 |
21.8 |
32.5 |
0.0 |
2.6 |
0.0 |
0.3 |
100.0 |
|
|
Nevada |
38.2 |
9.3 |
1.3 |
17.5 |
0.0 |
0.0 |
0.0 |
0.0 |
33.7 |
100.0 |
|
|
New Hampshire |
25.8 |
15.0 |
7.4 |
20.6 |
0.0 |
3.0 |
5.0 |
0.0 |
23.2 |
100.0 |
|
|
New Jersey |
7.2 |
3.8 |
5.6 |
11.6 |
25.7 |
1.2 |
0.0 |
40.6 |
4.3 |
100.0 |
|
|
New Mexico |
19.3 |
1.8 |
6.4 |
10.6 |
26.0 |
0.0 |
0.3 |
6.1 |
29.4 |
100.0 |
|
|
New York |
28.6 |
7.6 |
2.9 |
7.0 |
27.7 |
4.3 |
5.7 |
9.2 |
7.1 |
100.0 |
|
|
North Carolina |
7.2 |
7.5 |
0.8 |
33.8 |
0.0 |
0.9 |
21.8 |
20.1 |
7.8 |
100.0 |
|
|
North Dakota |
12.6 |
13.7 |
12.6 |
3.4 |
0.0 |
0.1 |
53.6 |
0.0 |
4.0 |
100.0 |
|
|
Ohio |
21.8 |
10.4 |
7.7 |
37.4 |
0.0 |
4.8 |
1.0 |
0.0 |
16.9 |
100.0 |
|
|
Oklahoma |
24.5 |
6.5 |
6.2 |
27.9 |
0.0 |
2.0 |
9.2 |
6.9 |
16.8 |
100.0 |
|
|
Oregon |
29.4 |
12.9 |
5.4 |
4.2 |
0.5 |
10.6 |
4.2 |
3.9 |
28.8 |
100.0 |
|
|
Pennsylvania |
15.7 |
6.7 |
8.2 |
40.9 |
0.0 |
1.3 |
0.0 |
13.0 |
14.2 |
100.0 |
|
|
Rhode Island |
14.7 |
3.3 |
6.5 |
25.1 |
11.5 |
15.8 |
16.5 |
0.5 |
6.1 |
100.0 |
|
|
South Carolina |
23.5 |
15.3 |
9.1 |
2.5 |
0.0 |
0.0 |
0.0 |
16.4 |
33.2 |
100.0 |
|
|
South Dakota |
47.2 |
8.8 |
13.2 |
2.7 |
0.0 |
10.9 |
6.7 |
0.0 |
10.5 |
100.0 |
|
|
Tennessee |
35.5 |
12.6 |
5.5 |
10.8 |
0.0 |
0.0 |
0.0 |
35.0 |
0.8 |
100.0 |
|
|
Texas |
5.5 |
8.3 |
8.9 |
0.0 |
0.0 |
3.5 |
30.6 |
36.9 |
6.5 |
100.0 |
|
|
Utah |
19.5 |
6.8 |
20.5 |
16.6 |
0.0 |
3.4 |
2.8 |
4.3 |
26.0 |
100.0 |
|
|
Vermont |
15.7 |
6.8 |
2.8 |
31.9 |
19.5 |
1.4 |
5.7 |
0.0 |
16.3 |
100.0 |
|
|
Virginia |
26.1 |
12.0 |
14.9 |
12.4 |
0.1 |
2.0 |
0.0 |
0.0 |
32.4 |
100.0 |
|
|
Washington |
13.9 |
8.5 |
14.1 |
21.5 |
0.0 |
5.5 |
0.0 |
5.9 |
30.6 |
100.0 |
|
|
West Virginia |
19.2 |
10.8 |
0.3 |
11.0 |
0.0 |
14.0 |
25.6 |
0.0 |
19.1 |
100.0 |
|
|
Wisconsin |
14.8 |
4.2 |
4.7 |
35.8 |
12.0 |
6.6 |
0.8 |
0.0 |
21.1 |
100.0 |
|
|
Wyoming |
24.3 |
23.5 |
12.7 |
5.6 |
0.0 |
12.3 |
0.0 |
3.7 |
17.9 |
100.0 |
|
|
Totals |
22.7 |
7.2 |
10.5 |
16.1 |
9.0 |
4.0 |
7.1 |
8.1 |
15.3 |
100.0 |
|
Source: Congressional Research Service (CRS), based on data from the U.S. Department of Health and Human Services (HHS).
Notes: Detail may not add to totals because of rounding.
|
State |
Obligated but Not Spent |
Unobligated Balances |
|
Alabama |
$19.0 |
$55.2 |
|
Alaska |
48.1 |
0.0 |
|
Arizona |
0.0 |
30.7 |
|
Arkansas |
32.7 |
31.0 |
|
California |
307.2 |
0.0 |
|
Colorado |
0.0 |
96.4 |
|
Connecticut |
0.0 |
0.8 |
|
Delaware |
0.6 |
7.8 |
|
District of Columbia |
0.2 |
32.8 |
|
Florida |
17.1 |
0.0 |
|
Georgia |
23.8 |
40.9 |
|
Hawaii |
15.6 |
225.8 |
|
Idaho |
0.0 |
20.0 |
|
Illinois |
0.0 |
0.0 |
|
Indiana |
46.3 |
109.5 |
|
Iowa |
3.8 |
0.5 |
|
Kansas |
0.4 |
67.9 |
|
Kentucky |
0.0 |
66.5 |
|
Louisiana |
7.9 |
0.0 |
|
Maine |
5.6 |
141.1 |
|
Maryland |
0.0 |
0.0 |
|
Massachusetts |
0.0 |
0.0 |
|
Michigan |
0.0 |
116.8 |
|
Minnesota |
0.0 |
59.3 |
|
Mississippi |
0.0 |
23.6 |
|
Missouri |
0.0 |
0.3 |
|
Montana |
10.3 |
13.1 |
|
Nebraska |
0.0 |
64.2 |
|
Nevada |
23.7 |
0.0 |
|
New Hampshire |
0.0 |
57.5 |
|
New Jersey |
22.7 |
35.0 |
|
New Mexico |
52.9 |
38.3 |
|
New York |
121.4 |
519.5 |
|
North Carolina |
41.7 |
0.0 |
|
North Dakota |
0.0 |
9.7 |
|
Ohio |
462.7 |
29.4 |
|
Oklahoma |
76.3 |
0.0 |
|
Oregon |
0.0 |
50.3 |
|
Pennsylvania |
63.3 |
427.0 |
|
Rhode Island |
0.0 |
11.1 |
|
South Carolina |
0.0 |
0.0 |
|
South Dakota |
0.0 |
22.5 |
|
Tennessee |
0.0 |
517.8 |
|
Texas |
190.0 |
1.3 |
|
Utah |
0.0 |
79.2 |
|
Vermont |
0.0 |
0.0 |
|
Virginia |
8.0 |
122.0 |
|
Washington |
0.0 |
65.1 |
|
West Virginia |
0.0 |
57.4 |
|
Wisconsin |
167.1 |
33.2 |
|
Wyoming |
2.6 |
22.8 |
|
Total |
1,771.0 |
3,303.1 |
Source: Congressional Research Service (CRS), based on data from the U.S. Department of Health and Human Services (HHS).
Table B-4. Number of Families, Recipients, Children, and Adults Receiving TANF Assistance by State, September 2018
|
State |
Families |
Recipients |
Children |
Adults |
|
Alabama |
8,182 |
18,425 |
15,032 |
3,393 |
|
Alaska |
2,571 |
6,815 |
4,732 |
2,083 |
|
Arizona |
7,372 |
15,106 |
12,084 |
3,022 |
|
Arkansas |
2,859 |
6,357 |
4,767 |
1,590 |
|
California |
409,043 |
1,331,457 |
940,730 |
390,727 |
|
Colorado |
12,502 |
32,692 |
22,727 |
9,965 |
|
Connecticut |
8,964 |
18,713 |
13,545 |
5,168 |
|
Delaware |
3,761 |
10,450 |
6,272 |
4,178 |
|
District of Columbia |
5,840 |
16,632 |
12,546 |
4,086 |
|
Florida |
41,469 |
65,627 |
56,117 |
9,510 |
|
Georgia |
10,484 |
20,246 |
18,353 |
1,893 |
|
Guam |
491 |
1,083 |
929 |
154 |
|
Hawaii |
4,274 |
11,653 |
8,294 |
3,359 |
|
Idaho |
2,046 |
2,996 |
2,912 |
84 |
|
Illinois |
11,048 |
21,810 |
19,689 |
2,121 |
|
Indiana |
6,048 |
12,053 |
10,982 |
1,071 |
|
Iowa |
9,650 |
23,295 |
17,746 |
5,549 |
|
Kansas |
4,360 |
4,359 |
2,619 |
1,740 |
|
Kentucky |
18,774 |
37,748 |
32,695 |
5,053 |
|
Louisiana |
5,402 |
13,292 |
11,007 |
2,285 |
|
Maine |
17,367 |
57,543 |
35,301 |
22,242 |
|
Maryland |
17,352 |
42,996 |
32,025 |
10,971 |
|
Massachusetts |
50,270 |
124,630 |
85,801 |
38,829 |
|
Michigan |
12,338 |
30,453 |
24,978 |
5,475 |
|
Minnesota |
16,973 |
40,370 |
31,246 |
9,124 |
|
Mississippi |
4,040 |
7,907 |
6,399 |
1,508 |
|
Missouri |
10,761 |
24,687 |
19,063 |
5,624 |
|
Montana |
3,691 |
9,156 |
7,010 |
2,146 |
|
Nebraska |
4,832 |
11,945 |
9,954 |
1,991 |
|
Nevada |
9,023 |
22,836 |
17,191 |
5,645 |
|
New Hampshire |
5,257 |
12,575 |
9,081 |
3,494 |
|
New Jersey |
10,326 |
23,089 |
18,000 |
5,089 |
|
New Mexico |
10,632 |
26,529 |
20,122 |
6,407 |
|
New York |
122,363 |
313,143 |
221,544 |
91,599 |
|
North Carolina |
14,574 |
25,263 |
22,791 |
2,472 |
|
North Dakota |
984 |
2,453 |
2,072 |
381 |
|
Ohio |
42,549 |
75,664 |
69,415 |
6,249 |
|
Oklahoma |
6,176 |
13,696 |
11,958 |
1,738 |
|
Oregon |
40,932 |
120,311 |
77,812 |
42,499 |
|
Pennsylvania |
45,022 |
111,572 |
83,045 |
28,527 |
|
Puerto Rico |
4,992 |
13,559 |
8,411 |
5,148 |
|
Rhode Island |
4,197 |
9,954 |
7,274 |
2,680 |
|
South Carolina |
8,314 |
18,326 |
15,449 |
2,877 |
|
South Dakota |
2,952 |
5,944 |
5,489 |
455 |
|
Tennessee |
20,951 |
45,131 |
36,178 |
8,953 |
|
Texas |
26,109 |
56,501 |
49,307 |
7,194 |
|
Utah |
3,546 |
8,438 |
6,290 |
2,148 |
|
Vermont |
2,918 |
6,599 |
4,703 |
1,896 |
|
Virgin Islands |
160 |
496 |
334 |
162 |
|
Virginia |
20,513 |
35,157 |
27,510 |
7,647 |
|
Washington |
37,270 |
88,286 |
60,717 |
27,569 |
|
West Virginia |
6,572 |
12,845 |
10,768 |
2,077 |
|
Wisconsin |
15,740 |
34,089 |
28,275 |
5,814 |
|
Wyoming |
499 |
1,142 |
882 |
260 |
|
Totals |
1,175,335 |
3,104,094 |
2,280,173 |
823,921 |
Source: Congressional Research Service (CRS), based on data from the U.S. Department of Health and Human Services (HHS).
Notes: TANF cash assistance caseload includes families receiving assistance in state-funded programs counted toward the TANF maintenance of effort (MOE) requirement.
Table B-5. Number of Needy Families with Children Receiving Assistance by State, September of Selected Years
|
Percentage Change to 2018 from |
|||||||
|
State |
1994 |
2010 |
2017 |
2018 |
1994 |
2010 |
2017 |
|
Alabama |
48,752 |
23,052 |
9,326 |
8,182 |
-83.2 |
-64.5 |
-12.3 |
|
Alaska |
12,450 |
3,507 |
3,093 |
2,571 |
-79.3 |
-26.7 |
-16.9 |
|
Arizona |
72,728 |
18,774 |
8,222 |
7,372 |
-89.9 |
-60.7 |
-10.3 |
|
Arkansas |
25,298 |
8,469 |
3,072 |
2,859 |
-88.7 |
-66.2 |
-6.9 |
|
California |
916,795 |
590,121 |
511,311 |
409,043 |
-55.4 |
-30.7 |
-20.0 |
|
Colorado |
40,544 |
11,707 |
16,646 |
12,502 |
-69.2 |
6.8 |
-24.9 |
|
Connecticut |
60,336 |
16,848 |
9,798 |
8,964 |
-85.1 |
-46.8 |
-8.5 |
|
Delaware |
11,408 |
5,508 |
3,873 |
3,761 |
-67.0 |
-31.7 |
-2.9 |
|
District of Columbia |
27,320 |
8,547 |
3,124 |
5,840 |
-78.6 |
-31.7 |
86.9 |
|
Florida |
239,702 |
57,742 |
45,027 |
41,469 |
-82.7 |
-28.2 |
-7.9 |
|
Georgia |
141,596 |
20,133 |
10,399 |
10,484 |
-92.6 |
-47.9 |
0.8 |
|
Guam |
2,089 |
1,276 |
541 |
491 |
-76.5 |
-61.5 |
-9.2 |
|
Hawaii |
21,312 |
9,953 |
4,937 |
4,274 |
-79.9 |
-57.1 |
-13.4 |
|
Idaho |
8,635 |
1,820 |
1,928 |
2,046 |
-76.3 |
12.4 |
6.1 |
|
Illinois |
241,290 |
24,337 |
12,613 |
11,048 |
-95.4 |
-54.6 |
-12.4 |
|
Indiana |
72,654 |
36,062 |
6,962 |
6,048 |
-91.7 |
-83.2 |
-13.1 |
|
Iowa |
39,137 |
21,548 |
10,694 |
9,650 |
-75.3 |
-55.2 |
-9.8 |
|
Kansas |
29,524 |
15,554 |
4,462 |
4,360 |
-85.2 |
-72.0 |
-2.3 |
|
Kentucky |
78,720 |
30,875 |
20,785 |
18,774 |
-76.2 |
-39.2 |
-9.7 |
|
Louisiana |
84,162 |
10,849 |
5,521 |
5,402 |
-93.6 |
-50.2 |
-2.2 |
|
Maine |
22,322 |
15,377 |
18,452 |
17,367 |
-22.2 |
12.9 |
-5.9 |
|
Maryland |
80,266 |
25,110 |
18,611 |
17,352 |
-78.4 |
-30.9 |
-6.8 |
|
Massachusetts |
108,985 |
49,836 |
51,196 |
50,270 |
-53.9 |
0.9 |
-1.8 |
|
Michigan |
215,873 |
67,241 |
13,846 |
12,338 |
-94.3 |
-81.7 |
-10.9 |
|
Minnesota |
59,987 |
24,574 |
18,519 |
16,973 |
-71.7 |
-30.9 |
-8.3 |
|
Mississippi |
55,232 |
11,895 |
4,891 |
4,040 |
-92.7 |
-66.0 |
-17.4 |
|
Missouri |
91,875 |
39,262 |
12,452 |
10,761 |
-88.3 |
-72.6 |
-13.6 |
|
Montana |
11,416 |
3,686 |
4,517 |
3,691 |
-67.7 |
0.1 |
-18.3 |
|
Nebraska |
15,435 |
8,702 |
5,262 |
4,832 |
-68.7 |
-44.5 |
-8.2 |
|
Nevada |
14,620 |
10,612 |
9,828 |
9,023 |
-38.3 |
-15.0 |
-8.2 |
|
New Hampshire |
11,398 |
6,175 |
4,884 |
5,257 |
-53.9 |
-14.9 |
7.6 |
|
New Jersey |
122,376 |
34,516 |
12,640 |
10,326 |
-91.6 |
-70.1 |
-18.3 |
|
New Mexico |
34,535 |
21,223 |
11,066 |
10,632 |
-69.2 |
-49.9 |
-3.9 |
|
New York |
461,751 |
154,936 |
132,675 |
122,363 |
-73.5 |
-21.0 |
-7.8 |
|
North Carolina |
129,258 |
23,705 |
16,108 |
14,574 |
-88.7 |
-38.5 |
-9.5 |
|
North Dakota |
5,410 |
1,996 |
1,105 |
984 |
-81.8 |
-50.7 |
-11.0 |
|
Ohio |
244,099 |
105,140 |
54,161 |
42,549 |
-82.6 |
-59.5 |
-21.4 |
|
Oklahoma |
46,572 |
9,388 |
6,797 |
6,176 |
-86.7 |
-34.2 |
-9.1 |
|
Oregon |
40,504 |
31,751 |
43,754 |
40,932 |
1.1 |
28.9 |
-6.4 |
|
Pennsylvania |
212,457 |
53,274 |
50,615 |
45,022 |
-78.8 |
-15.5 |
-11.1 |
|
Puerto Rico |
57,337 |
13,371 |
7,000 |
4,992 |
-91.3 |
-62.7 |
-28.7 |
|
Rhode Island |
22,776 |
6,758 |
4,466 |
4,197 |
-81.6 |
-37.9 |
-6.0 |
|
South Carolina |
50,430 |
19,347 |
8,672 |
8,314 |
-83.5 |
-57.0 |
-4.1 |
|
South Dakota |
6,601 |
3,291 |
3,030 |
2,952 |
-55.3 |
-10.3 |
-2.6 |
|
Tennessee |
109,678 |
62,714 |
24,562 |
20,951 |
-80.9 |
-66.6 |
-14.7 |
|
Texas |
284,973 |
51,931 |
28,839 |
26,109 |
-90.8 |
-49.7 |
-9.5 |
|
Utah |
17,505 |
6,646 |
4,013 |
3,546 |
-79.7 |
-46.6 |
-11.6 |
|
Vermont |
9,761 |
3,256 |
3,371 |
2,918 |
-70.1 |
-10.4 |
-13.4 |
|
Virgin Islands |
1,146 |
537 |
197 |
160 |
-86.0 |
-70.2 |
-18.8 |
|
Virginia |
74,257 |
37,448 |
22,232 |
20,513 |
-72.4 |
-45.2 |
-7.7 |
|
Washington |
101,542 |
70,200 |
35,284 |
37,270 |
-63.3 |
-46.9 |
5.6 |
|
West Virginia |
40,279 |
10,496 |
7,113 |
6,572 |
-83.7 |
-37.4 |
-7.6 |
|
Wisconsin |
75,086 |
24,746 |
16,318 |
15,740 |
-79.0 |
-36.4 |
-3.5 |
|
Wyoming |
5,351 |
318 |
513 |
499 |
-90.7 |
56.9 |
-2.7 |
|
Totals |
5,015,545 |
1,926,140 |
1,349,323 |
1,175,335 |
-76.6 |
-39.0 |
-12.9 |
|
Percentage of Total Families |
||||||||
|
State |
Single Parent |
Two Parent |
No Parent |
Total Fami-lies |
Single Parent |
Two Parent |
No Parent |
Total Families |
|
Alabama |
3,272 |
42 |
4,868 |
8,182 |
40.0% |
0.5% |
59.5% |
100.0% |
|
Alaska |
1,510 |
252 |
809 |
2,571 |
58.7 |
9.8 |
31.5 |
100.0 |
|
Arizona |
2,718 |
114 |
4,540 |
7,372 |
36.9 |
1.5 |
61.6 |
100.0 |
|
Arkansas |
1,462 |
59 |
1,338 |
2,859 |
51.1 |
2.1 |
46.8 |
100.0 |
|
California |
251,231 |
27,704 |
130,108 |
409,043 |
61.4 |
6.8 |
31.8 |
100.0 |
|
Colorado |
9,331 |
0 |
3,171 |
12,502 |
74.6 |
0.0 |
25.4 |
100.0 |
|
Connecticut |
2,942 |
0 |
6,022 |
8,964 |
32.8 |
0.0 |
67.2 |
100.0 |
|
Delaware |
994 |
9 |
2,758 |
3,761 |
26.4 |
0.2 |
73.3 |
100.0 |
|
District of Columbia |
4,086 |
0 |
1,754 |
5,840 |
70.0 |
0.0 |
30.0 |
100.0 |
|
Florida |
5,287 |
215 |
35,967 |
41,469 |
12.7 |
0.5 |
86.7 |
100.0 |
|
Georgia |
1,982 |
0 |
8,502 |
10,484 |
18.9 |
0.0 |
81.1 |
100.0 |
|
Guam |
86 |
27 |
378 |
491 |
17.5 |
5.5 |
77.0 |
100.0 |
|
Hawaii |
2,577 |
611 |
1,086 |
4,274 |
60.3 |
14.3 |
25.4 |
100.0 |
|
Idaho |
84 |
0 |
1,962 |
2,046 |
4.1 |
0.0 |
95.9 |
100.0 |
|
Illinois |
2,199 |
0 |
8,849 |
11,048 |
19.9 |
0.0 |
80.1 |
100.0 |
|
Indiana |
1,366 |
40 |
4,642 |
6,048 |
22.6 |
0.7 |
76.8 |
100.0 |
|
Iowa |
4,682 |
390 |
4,578 |
9,650 |
48.5 |
4.0 |
47.4 |
100.0 |
|
Kansas |
1,806 |
206 |
2,348 |
4,360 |
41.4 |
4.7 |
53.9 |
100.0 |
|
Kentucky |
4,308 |
382 |
14,084 |
18,774 |
22.9 |
2.0 |
75.0 |
100.0 |
|
Louisiana |
2,268 |
0 |
3,134 |
5,402 |
42.0 |
0.0 |
58.0 |
100.0 |
|
Maine |
9,178 |
6,529 |
1,660 |
17,367 |
52.8 |
37.6 |
9.6 |
100.0 |
|
Maryland |
10,651 |
281 |
6,420 |
17,352 |
61.4 |
1.6 |
37.0 |
100.0 |
|
Massachusetts |
34,435 |
3,029 |
12,806 |
50,270 |
68.5 |
6.0 |
25.5 |
100.0 |
|
Michigan |
4,646 |
0 |
7,692 |
12,338 |
37.7 |
0.0 |
62.3 |
100.0 |
|
Minnesota |
9,185 |
0 |
7,788 |
16,973 |
54.1 |
0.0 |
45.9 |
100.0 |
|
Mississippi |
1,481 |
0 |
2,559 |
4,040 |
36.7 |
0.0 |
63.3 |
100.0 |
|
Missouri |
6,301 |
0 |
4,460 |
10,761 |
58.6 |
0.0 |
41.4 |
100.0 |
|
Montana |
1,792 |
282 |
1,617 |
3,691 |
48.6 |
7.6 |
43.8 |
100.0 |
|
Nebraska |
1,984 |
0 |
2,848 |
4,832 |
41.1 |
0.0 |
58.9 |
100.0 |
|
Nevada |
4,161 |
680 |
4,182 |
9,023 |
46.1 |
7.5 |
46.3 |
100.0 |
|
New Hampshire |
3,304 |
37 |
1,916 |
5,257 |
62.8 |
0.7 |
36.4 |
100.0 |
|
New Jersey |
5,745 |
59 |
4,522 |
10,326 |
55.6 |
0.6 |
43.8 |
100.0 |
|
New Mexico |
5,057 |
675 |
4,900 |
10,632 |
47.6 |
6.3 |
46.1 |
100.0 |
|
New York |
77,545 |
2,508 |
42,310 |
122,363 |
63.4 |
2.0 |
34.6 |
100.0 |
|
North Carolina |
1,772 |
24 |
12,778 |
14,574 |
12.2 |
0.2 |
87.7 |
100.0 |
|
North Dakota |
381 |
0 |
603 |
984 |
38.7 |
0.0 |
61.3 |
100.0 |
|
Ohio |
5,322 |
345 |
36,882 |
42,549 |
12.5 |
0.8 |
86.7 |
100.0 |
|
Oklahoma |
1,738 |
0 |
4,438 |
6,176 |
28.1 |
0.0 |
71.9 |
100.0 |
|
Oregon |
27,855 |
6,521 |
6,556 |
40,932 |
68.1 |
15.9 |
16.0 |
100.0 |
|
Pennsylvania |
27,889 |
471 |
16,662 |
45,022 |
61.9 |
1.0 |
37.0 |
100.0 |
|
Puerto Rico |
4,490 |
251 |
251 |
4,992 |
89.9 |
5.0 |
5.0 |
100.0 |
|
Rhode Island |
2,959 |
164 |
1,074 |
4,197 |
70.5 |
3.9 |
25.6 |
100.0 |
|
South Carolina |
2,877 |
0 |
5,437 |
8,314 |
34.6 |
0.0 |
65.4 |
100.0 |
|
South Dakota |
455 |
0 |
2,497 |
2,952 |
15.4 |
0.0 |
84.6 |
100.0 |
|
Tennessee |
8,052 |
224 |
12,675 |
20,951 |
38.4 |
1.1 |
60.5 |
100.0 |
|
Texas |
7,194 |
0 |
18,915 |
26,109 |
27.6 |
0.0 |
72.4 |
100.0 |
|
Utah |
1,564 |
0 |
1,982 |
3,546 |
44.1 |
0.0 |
55.9 |
100.0 |
|
Vermont |
1,322 |
277 |
1,319 |
2,918 |
45.3 |
9.5 |
45.2 |
100.0 |
|
Virgin Islands |
131 |
0 |
29 |
160 |
81.9 |
0.0 |
18.1 |
100.0 |
|
Virginia |
11,114 |
0 |
9,399 |
20,513 |
54.2 |
0.0 |
45.8 |
100.0 |
|
Washington |
17,561 |
7,313 |
12,396 |
37,270 |
47.1 |
19.6 |
33.3 |
100.0 |
|
West Virginia |
1,572 |
0 |
5,000 |
6,572 |
23.9 |
0.0 |
76.1 |
100.0 |
|
Wisconsin |
4,956 |
192 |
10,592 |
15,740 |
31.5 |
1.2 |
67.3 |
100.0 |
|
Wyoming |
223 |
19 |
257 |
499 |
44.7 |
3.8 |
51.5 |
100.0 |
|
Totals |
609,083 |
59,932 |
506,320 |
1,175,335 |
51.8 |
5.1 |
43.1 |
100.0 |