Following a period of suspension, the statutory debt limit was reinstated on March 2, 2019, at $21.988 trillion, precisely accommodating the federal borrowing undertaken up to that date. Following the debt limit's reinstatement Treasury Secretary Mnuchin began implementing "extraordinary measures" to delay a binding debt limit. Secretary Mnuchin had informed Congress of his intention to implement these measures in a February 21, 2019, letter to Congress. Extraordinary measures were last implemented from March 2017 through September 2017 and from December 2017 through February 2018, until passage of the Bipartisan Budget Act of 2018 (BBA 2018; P.L. 115-123, February 9, 2018) suspended the statutory debt limit through March 1, 2019. This Insight briefly examines the use of extraordinary measures and its subsequent effects on federal debt activity.
What Is the Debt Limit?
As part of its "power of the purse," Congress uses the statutory debt limit (codified in 31 U.S.C. §3101) as a means of restricting federal debt. Debt subject to the limit is more than 99% of total federal debt, and includes debt held by the public (which is used to finance budget deficits) and debt issued to federal government accounts (which is used to meet federal obligations). The debt limit acts as a congressional check on recent revenue and expenditure trends, though decisions affecting debt levels may have been agreed to by Congress and the Administration well in advance of debt limit deliberations. Some past debt limit legislation has linked debt limit increases with other fiscal policy proposals.
What Are Extraordinary Measures?
Extraordinary measures represent a series of actions that postpone when Congress must act on debt limit legislation. The authority for using extraordinary measures rests with the Treasury Secretary (codified in 5 U.S.C. §8348 and 5 U.S.C. §8909). Invoking extraordinary measures has delayed required action on the debt limit by periods ranging from a few weeks to several months, depending on when such measures were enacted (see the "How Long Do Extraordinary Measures Last?" section). Accounts and members of the public that are affected by extraordinary measures must be compensated for the delay in payment that resulted from such actions when the debt limit is subsequently modified.
Before or during a period when extraordinary measures are implemented, Treasury typically provides a description of the extraordinary measures available and estimates of their effect on federal borrowing capacity (or how much "headroom" they will add). The most recent description of such measures was provided by Treasury in March 2019. Table 1 provides a description of the currently available extraordinary measures and the amount of headroom added when those measures were implemented from March 2017 through September 2017 and from December 2017 through February 2018.
Table 1. Use of Extraordinary Measures, 2017-2018
|
Measure
|
Headroom Added from March 2017-September 2017
|
Headroom Added from December 2017-February 2018
|
Headroom Available on March 5, 2019
|
|
Suspension of reinvestment in Government Securities Investment Fund (G Fund) of the Federal Retirement System
|
$225 billion
|
$208 billion
|
$230 billion
|
|
Suspension of invested balance in Exchange Stabilization Fund
|
$22 billion
|
$22 billion
|
$22 billion
|
|
Declaration of a Debt Issuance Suspension Period
|
$87 billion one-time and $7.3 billion per month
|
$12.7 billion one-time and $7.3 billion per month
|
$86 billion one-time and $7.3 billion per month
|
|
Suspension of State and Local Government Securities
|
$0 (prevents further increases in debt by $3-$13 billion per month)
|
$0 (prevents further increases in debt by $3-$13 billion per month)
|
$0 (prevents further increases in debt by approximately $4 billion per month)
|
Sources: U.S. Department of the Treasury, "Description of the Extraordinary Measures," March 5, 2019, available at https://home.treasury.gov/system/files/136/Description-of-Extraordinary-Measures-03_05_19.pdf; U.S. Department of the Treasury, "Description of the Extraordinary Measures," December 12, 2017, available at https://www.treasury.gov/initiatives/Documents/Description-of-Extraordinary-Measures-2017_12_12_Final.pdf; "Description of Extraordinary Measures," March 16, 2017, available at https://www.treasury.gov/initiatives/Documents/Description_of_Extraordinary_Measures_2017_03_16.pdf.
Notes: In a February 2019 report, the Congressional Budget Office estimated that an additional $4.7 billion of headroom is available through the Federal Financing Bank. This table only includes available measures reported by Treasury.
How Long Do Extraordinary Measures Last?
Short-term fluctuations in federal debt levels provide for substantial uncertainty in how long extraordinary measures can last. Federal balances fluctuate on a day-to-day basis in response to a number of factors, including the timing of payments for Social Security, military benefits, and other programs; interest payments on debt obligations; and the timing of certain receipts. Prior to enactment of BBA 2018, CBO and Treasury projected that extraordinary measures would have been exhausted in March 2018.
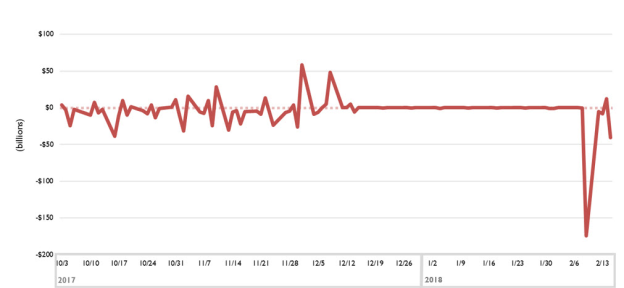
Figure 1 shows federal daily balances when extraordinary measures were implemented from December 2017 through February 2018. The reduced variation in daily balances starting in December 2017 reflects the implementation of extraordinary measures to exactly match outlays and receipts. The decline in the daily balance on February 9, 2018, reflects the compensation of intragovernmental creditors whose payments were delayed by the implementation of extraordinary measures.
|
Figure 1. Changes in the Daily Federal Balances, October 3, 2017-February 15, 2018
|
 |
|
Source: U.S. Department of the Treasury, Daily Treasury Statement (various).
Note: Positive numbers indicate daily surpluses, while negative numbers indicate daily deficits.
|
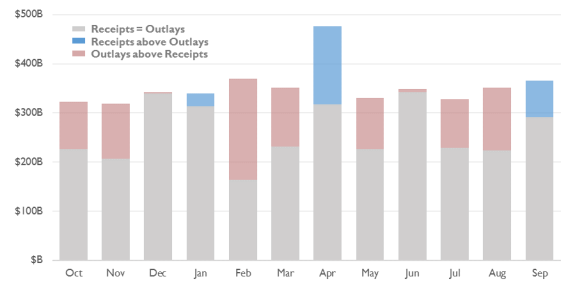
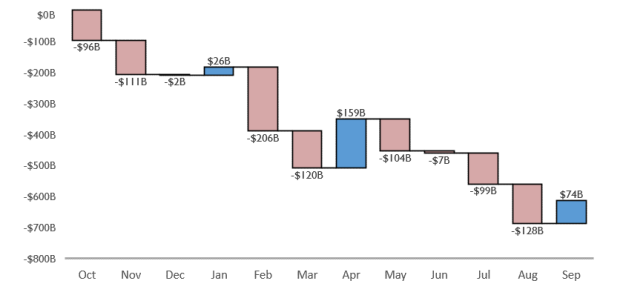
Monthly budget outcomes can also fluctuate with the timing of various activities. The federal government tends to record higher net budget surpluses in April (when many individual tax returns are filed) and September (as certain payments are due at the end of the fiscal year) while recording lower balances in other months. Figure 2 presents the average federal monthly account balances from the previous five fiscal years. The gray regions represent the amount to which average monthly receipts are equal to average monthly outlays. The red regions represent outlays greater than receipts (indicating an average monthly deficit), and the blue regions represent receipts greater than outlays (indicating an average monthly surplus). Figure 3 then shows how monthly fluctuations in federal receipts affect year-to-date annual federal balances over the FY2014-FY2018 period.
|
Figure 2. Average Federal Monthly Account Balance, FY2014-FY2018
|
 |
|
Source: U.S. Department of the Treasury, Monthly Treasury Statement (various). CRS calculations.
|
|
Figure 3. Average Change in Year-to-Date Federal Budget by Month, FY2014-FY2018
(In constant January 2019 dollars)
|
 |
|
Source: U.S. Department of the Treasury, Monthly Treasury Statement (various). CRS calculations.
|


