Introduction
Under the Appointments Clause of the Constitution,1 the President and the Senate share responsibility for making appointments to the Supreme Court, as well as to various lower courts of the federal judiciary. While the President nominates persons to fill federal judgeships, the appointment of each nominee also requires Senate confirmation.2
Historically, the vast majority of appointments to federal judgeships (other than to the Supreme Court) have typically not involved much public disagreement between the President and the Senate or between the parties within the Senate.3 Debate in the Senate over particular lower court nominees, or over the lower court appointment process itself, was uncommon. Typically, such nominations were both reported out of the Judiciary Committee and confirmed by the Senate without any recorded opposition.
In recent decades, however, appointments to two kinds of lower federal courts—the U.S. circuit courts of appeals4 and the U.S. district courts—have often been the focus of heightened Senate interest and debate, as has the process itself for appointing judges to these courts.5
Given congressional interest in the subject, this report provides statistics and analysis related to the nomination and confirmation of U.S. circuit and district court judges from 1977 (the beginning of the Carter presidency) through 2018 (the second year of the Trump presidency).6
The report's exclusive focus are the U.S. circuit courts of appeals and U.S. district courts. Excluded from the scope of the report are the U.S. Supreme Court; the U.S. Court of International Trade; the U.S. Court of Federal Claims; and territorial district courts (e.g., the District Court of Guam).
Overview of the U.S. Courts of Appeals and U.S. District Courts
U.S. Circuit Courts
The U.S. courts of appeals, or circuit courts, take appeals from federal district court decisions and are also empowered to review the decisions of many administrative agencies. Cases presented to the courts of appeals are generally considered by judges sitting in three-member panels. Courts within the courts of appeals system are often called "circuit courts" (e.g., the First Circuit Court of Appeals is also referred to as the "First Circuit"), because the nation is divided into 12 geographic circuits, each with a U.S. court of appeals. One additional nationwide circuit, the U.S. Court of Appeals for the Federal Circuit, has specialized subject matter jurisdiction.
Altogether, 179 judgeships for these 13 courts of appeals are currently authorized by law (167 for the 12 regional U.S. courts of appeals and 12 for the U.S. Court of Appeals for the Federal Circuit).7 The First Circuit (comprising Maine, Massachusetts, New Hampshire, Rhode Island, and Puerto Rico) has the fewest number of authorized appellate court judgeships, 6, while the Ninth Circuit (comprising Alaska, Arizona, California, Hawaii, Idaho, Montana, Nevada, Oregon, and Washington) has the most, 29.
U.S. District Courts
U.S. district courts are the federal trial courts of general jurisdiction. There are 91 Article III district courts: 89 in the 50 states, plus 1 in the District of Columbia and 1 more in Puerto Rico. Each state has at least one U.S. district court, while some states (specifically California, New York, and Texas) have as many as four.
Altogether, 673 Article III U.S. district court judgeships are currently authorized by law.8 Congress has authorized between 1 and 28 judgeships for each district court. The Eastern District of Oklahoma (Muskogee) has 1 authorized judgeship, the smallest number among Article III district courts, while the Southern District of New York (Manhattan) and the Central District of California (Los Angeles) each have 28 judgeships, the most among Article III district courts.
U.S. Circuit and District Court Vacancies
Opportunities for a President to make circuit and district court appointments arise when judgeships are vacant or are scheduled to become vacant. Various factors influence the number of such opportunities a President will have during his tenure in office, including the frequency with which judicial departures occur; whether any new judgeships are statutorily created by Congress (which consequently provide a President with the opportunity to nominate individuals to the new judgeships);9 the number of judicial nominations submitted by a President; and the speed by which the Senate considers such nominations.
Table 1 reports the percentage of U.S. circuit and district court judgeships that were vacant on January 1 immediately prior to the beginning of each new Congress and four-year presidential term from 1977 through 2017.10
Table 1. Percentage of U.S. Circuit and District Court Judgeships Vacant on January 1 Prior to Beginning of Each Congress and Four-Year Presidential Term
(1977-2017)
|
Year |
Congress |
President |
Percentage of Judgeships Vacant on January 1 |
|
|
U.S. Circuit Courts |
U.S. District Courts |
|||
|
1977 |
95th |
Carter |
5.2 |
4.8 |
|
1979 |
96th |
Carter |
28.8 |
24.7 |
|
1981 |
97th |
Reagan |
3.8 |
5.7 |
|
1983 |
98th |
Reagan |
3.5 |
4.5 |
|
1985 |
99th |
Reagan |
14.9 |
13.1 |
|
1987 |
100th |
Reagan |
7.7 |
7.2 |
|
1989 |
101st |
Bush, G.H.W. |
6.0 |
4.7 |
|
1991 |
102nd |
Bush, G.H.W. |
10.1 |
16.4 |
|
1993 |
103rd |
Clinton |
9.5 |
13.8 |
|
1995 |
104th |
Clinton |
8.9 |
8.1 |
|
1997 |
105th |
Clinton |
12.8 |
10.0 |
|
1999 |
106th |
Clinton |
9.5 |
6.3 |
|
2001 |
107th |
Bush, G.W. |
14.5 |
8.2 |
|
2003 |
108th |
Bush, G.W. |
14.0 |
5.0 |
|
2005 |
109th |
Bush, G.W. |
8.4 |
3.1 |
|
2007 |
110th |
Bush, G.W. |
8.9 |
5.9 |
|
2009 |
111th |
Obama |
7.3 |
5.9 |
|
2011 |
112th |
Obama |
8.9 |
11.7 |
|
2013 |
113th |
Obama |
8.9 |
8.8 |
|
2015 |
114th |
Obama |
3.9 |
4.9 |
|
2017 |
115th |
Trump |
9.5 |
12.8 |
Source: Congressional Research Service.
Note: This table shows the percentage of U.S. circuit and district court judgeships that were vacant on January 1 immediately prior to a new Congress convening that same month and prior to a President being inaugurated on January 20.
Overall, during this period, the median percentage of circuit court judgeships that were vacant immediately prior to the start of a new Congress was 8.9%.11 The median percentage of district court judgeships that were vacant immediately prior to the start of a new Congress was 7.2%.
As shown by the table, the percentage of U.S. circuit judgeships that were vacant was highest at the beginning of the 96th Congress,12 28.8%, and lowest at the beginning of the 98th Congress, 3.5%. The percentage of U.S. district court judgeships that were vacant was also highest at the beginning of the 96th Congress, 24.7%, and lowest at the beginning of the 109th Congress, 3.1%.
The percentage of judgeships that are vacant at the beginning of a presidency is influenced, in part, by the extent to which the preceding President's nominees were approved by the Senate during the final year or two of his term. For example, most recently, at the beginning of the Trump presidency, the percentage of U.S. district court judgeships that were vacant was 12.8%.13 This was due, in part, to the comparatively small number of district court nominations confirmed by the Senate during the final two years of the Obama presidency.14
Number and Percentage of Nominees Confirmed
Various factors influence the number and percentage of judicial nominees confirmed during any given presidency or Congress. These factors include, but are not limited to, the frequency with which judges depart the bench; the speed with which a presidential Administration vets and selects nominees for vacant judgeships; whether a President is of the same political party as the majority party in the Senate; whether a congressional session coincides with a presidential election year; and the point in a congressional session when nominations arrive in the Senate.
By Presidency
As shown by Table 2, the number of U.S. circuit court nominees confirmed during a completed presidency ranged from a high of 83 during the Reagan presidency to a low of 42 during the single four-year term of George H. W. Bush.15 Of two-term Presidents, the high ranged from a high of 83 (Reagan) to a low of 55 during the Obama presidency.
In terms of the percentage of circuit court nominees confirmed during a completed presidency, which takes into account the number of circuit court nominations submitted to the Senate, the greatest percentage of nominees were confirmed during the Carter presidency (93.3%), and the smallest percentage were confirmed during the George W. Bush presidency (71.8%). Of two-term Presidents, the high ranged from 88.3% during the Reagan presidency to a low of 71.8% (George W. Bush).
Table 2. U.S. Circuit and District Court Nominees of Seven Most Recent Presidents: Number Nominated, Number Confirmed, Percentage Confirmed
(1977 through 2018)
|
President (Congresses, Years) |
U.S. Circuit Court Nominees |
U.S. District Court Nominees |
U.S. Circuit and District Court Nominees (Combined) |
|
|
Carter (95th-96th, 1977-1980) |
N |
60 |
218 |
278 |
|
C |
56 |
202 |
258 |
|
|
% |
93.3% |
92.7% |
92.8% |
|
|
Reagan (97th-100th, 1981-1988) |
N |
94 |
306 |
400 |
|
C |
83 |
290 |
373 |
|
|
% |
88.3% |
94.8% |
93.2% |
|
|
Bush, G.H.W. (101st-102nd, 1989-1992) |
N |
53 |
192 |
245 |
|
C |
42 |
148 |
190 |
|
|
% |
79.2% |
77.1% |
77.6% |
|
|
Clinton (103rd-106th, 1993-2000) |
N |
90 |
350 |
440 |
|
C |
65 |
305 |
370 |
|
|
% |
72.2% |
87.1% |
84.1% |
|
|
Bush, G.W. (107th-110th, 2001-2008) |
N |
85 |
286 |
371 |
|
C |
61 |
261 |
322 |
|
|
% |
71.8% |
91.3% |
86.8% |
|
|
Obama (111th-114th, 2009-2016) |
N |
68 |
322 |
390 |
|
C |
55 |
268 |
323 |
|
|
% |
80.9% |
83.2% |
82.8% |
|
|
Trumpa (115th, 2017-2018) |
N |
43 |
112 |
155 |
|
C |
30 |
53 |
83 |
|
|
% |
69.8% |
47.3% |
53.5% |
Source: Congressional Research Service.
Notes: This table shows, for each of the past seven Presidents, the number of individuals nominated to U.S. circuit and district court judgeships during his presidency (N); the number confirmed during his presidency (C); and the percentage confirmed (%).
a. The statistics presented for the Trump presidency are for the first two years of his presidency and not for his entire term in office. Consequently, the statistics presented for the Trump presidency in Table 2 may not be directly comparable to the statistics provided for the other Presidents listed in the table.
The number of U.S. district court nominees confirmed during a completed presidency ranged from a high of 305 during the Clinton presidency to a low of 148 during the single four-year term of George H. W. Bush.16 Of two-term Presidents, the high ranged from a high of 305 (Clinton) to a low of 261 during the George W. Bush presidency.
In terms of the percentage of district court nominees confirmed during a completed presidency, which takes into account the number of district court nominations submitted to the Senate, the greatest percentage of nominees were confirmed during the Reagan presidency (94.8%), and the smallest percentage were confirmed during the George H. W. Bush presidency (77.1%). Of two-term Presidents, the high ranged from 94.8% (Reagan) to a low of 83.2% during the Obama presidency.
By Congress
The median number of U.S. circuit court nominees confirmed during a Congress, from the 95th through the 115th, was 17 (while the median number of circuit court nominations submitted to the Senate was 26). And as shown by Table 3, the number of U.S. circuit court nominees confirmed during this same period ranged from a low of 2 (during the 114th Congress, 2015-2016) to a high of 44 (during the 96th Congress, 1979-1980).
The median percentage of circuit court nominees confirmed during a Congress, from the 95th through the 115th, was 65.4%. The smallest percentage of circuit court nominees, 22.2%, were confirmed during the 114th Congress (2015-2016). All (100%) of the circuit court nominations submitted to the Senate during the 95th and 99th Congresses (1977-1978 and 1985-1986, respectively) were confirmed by the Senate.
The median number of U.S. district court nominees confirmed during a Congress, from the 95th through the 115th, was 66 (while the median number of district court nominations submitted to the Senate was 85). The number of nominees confirmed ranged from a low of 18 (during the 114th Congress, 2015-2016) to a high of 154 (during the 96th Congress, 1979-1980).
The median percentage of district court nominees confirmed during a Congress, from the 95th through the 115th, was 84.0%. The smallest percentage confirmed during this period was 29.5% (during the 114th Congress, 2015-2016) and the greatest percentage confirmed was 98.6% (during the 97th Congress, 1981-1982).
Table 3. Nominees to U.S. Circuit and District Court Judgeships During Each Congress: Number Nominated, Number Confirmed, Percentage Confirmed
(95th Congress through 115th Congress)
|
Congress (Years) |
U.S. Circuit Court Nominees |
U.S. District Court Nominees |
U.S. Circuit & District Court Nominees (Combined) |
||||||
|
# of Nominees |
Nominees Confirmed |
# of Nominees |
Nominees Confirmed |
# of Nominees |
Nominees Confirmed |
||||
|
# |
% |
# |
% |
# |
% |
||||
|
95th (1977-78) |
12 |
12 |
100 |
50 |
48 |
96.0 |
62 |
60 |
96.8 |
|
96th (1979-80) |
48 |
44 |
91.7 |
168 |
154 |
91.7 |
216 |
198 |
91.7 |
|
97th (1981-82) |
20 |
19 |
95.0 |
69 |
68 |
98.6 |
89 |
87 |
97.8 |
|
98th (1983-84) |
19 |
14 |
73.7 |
75 |
61 |
81.3 |
94 |
75 |
79.8 |
|
99th (1985-86) |
33 |
33 |
100 |
100 |
95 |
95.0 |
133 |
128 |
96.2 |
|
100th (1987-88) |
26 |
17 |
65.4 |
78 |
66 |
84.6 |
104 |
83 |
79.8 |
|
101st (1989-90) |
23 |
22 |
95.7 |
50 |
48 |
96.0 |
73 |
70 |
95.9 |
|
102nd (1991-92) |
31 |
20 |
64.5 |
144 |
100 |
69.4 |
175 |
120 |
68.6 |
|
103rd (1993-94) |
22 |
19 |
86.4 |
118 |
107 |
90.7 |
140 |
126 |
90.0 |
|
104th (1995-96) |
20 |
11 |
55.0 |
85 |
62 |
72.9 |
105 |
73 |
69.5 |
|
105th (1997-98) |
30 |
20 |
66.7 |
94 |
79 |
84.0 |
124 |
99 |
79.8 |
|
106th (1999-00) |
34 |
15 |
44.1 |
83 |
57 |
68.7 |
117 |
72 |
61.5 |
|
107th (2001-02) |
32 |
17 |
53.1 |
98 |
83 |
84.7 |
130 |
100 |
76.9 |
|
108th (2003-04) |
34 |
18 |
52.9 |
94 |
85 |
90.4 |
128 |
103 |
80.5 |
|
109th (2005-06) |
28 |
16 |
57.1 |
65 |
35 |
53.8 |
93 |
51 |
54.8 |
|
110th (2007-08) |
23 |
10 |
43.5 |
79 |
58 |
73.4 |
102 |
68 |
66.7 |
|
111th (2009-10) |
25 |
16 |
64.0 |
78 |
44 |
56.4 |
103 |
60 |
58.3 |
|
112th (2011-12) |
25 |
14 |
56.0 |
127 |
97 |
76.4 |
152 |
111 |
73.0 |
|
113th (2013-14) |
26 |
23 |
88.5 |
123 |
109 |
88.6 |
149 |
132 |
88.6 |
|
114th (2015-16) |
9 |
2 |
22.2 |
61 |
18 |
29.5 |
70 |
20 |
28.6 |
|
115th (2017-18) |
43 |
30 |
69.8 |
112 |
53 |
47.3 |
155 |
83 |
53.5 |
Source: Congressional Research Service.
Notes: This table shows, for the 95th Congress through the 115th Congress, the number of individuals nominated to U.S. circuit and district court judgeships during each Congress; the number of nominees confirmed during each Congress (#); and the percentage of nominees confirmed during the same Congress (%).
Influence of Unified and Divided Party Control
In general, both a greater number and percentage of circuit and district court nominees were confirmed during Congresses in which the party of the President was the same as the majority party in the Senate.17 During Congresses in which there was unified party control (i.e., the party of the President and the majority party in the Senate were the same),18 the median number of circuit court nominees confirmed was approximately 18, and the median percentage of nominees confirmed was 80.0%. In contrast, during Congresses in which there was divided party control (i.e., the party of the President was different than the majority party in the Senate),19 the median number of circuit court nominees confirmed was 16, and the median percentage of nominees confirmed was 59.7%.
During Congresses in which there was unified party control, the median number of district court nominees confirmed was approximately 76, and the median percentage of nominees confirmed was 89.5%. In contrast, during Congresses in which there was divided party control, the median number of district court nominees confirmed was 60, and the median percentage of nominees confirmed was 73.1%.
Multiple Nominations of the Same Person Prior to Final Action by the Senate
Over the last several presidencies, it has become increasingly common for a President to nominate an individual two or more times to a U.S. circuit or district court judgeship prior to final action on the nomination by the Senate (irrespective of whether the Senate ultimately approved the nomination).20 Consequently, the percentage of nominees confirmed during a presidency who were nominated two or more times prior to being approved by the Senate has also increased in recent years.
U.S. Circuit Court Nominees
As shown by Table 4, the total number of circuit court nominees who were nominated two or more times prior to final action, whether confirmed or not, ranged from a low of 1 (during the Carter and George H. W. Bush presidencies) to a high of 39 (during the George W. Bush presidency).
The number of circuit court nominees who were nominated more than once and ultimately confirmed by the Senate ranged from a low of 0 (during the George H. W. Bush presidency) to a high of 28 (during the George W. Bush presidency). And the number of nominees who were nominated more than once but not confirmed by the Senate ranged from a low of 0 (during the Carter presidency) to a high of 11 (during the George W. Bush presidency).
Overall, of the six presidencies listed in Table 4, President George W. Bush had the greatest percentage of confirmed circuit court nominees who were nominated more than once prior to being confirmed by the Senate (45.9%).
Most recently, during the Obama presidency, the percentage of confirmed circuit court nominees who were nominated more than once prior to being approved by the Senate declined to 36.4% (representing the second-highest percentage of circuit court nominees nominated more than once prior to Senate approval).
Table 4. Number of U.S. Circuit Court Nominees Who Were Nominated Two or More Times Prior to Final Action and Percentage of All Confirmed U.S. Circuit Court Nominees Nominated Two or More Times Prior to Being Confirmed
|
President |
Number of Nominees Nominated Two or More Times Prior To Final Action |
Percentage of President's Confirmed Nominees Who Were Nominated Two or More Times Prior to Being Confirmed |
||
|
Confirmed |
Not Confirmed |
Total |
||
|
Carter |
1 |
0 |
1 |
1.8% |
|
Reagan |
6 |
1 |
7 |
7.2% |
|
Bush, G.H.W. |
0 |
1 |
1 |
0.0% |
|
Clinton |
12 |
10 |
22 |
18.5% |
|
Bush, G.W. |
28 |
11 |
39 |
45.9% |
|
Obama |
20 |
5 |
25 |
36.4% |
Source: Congressional Research Service.
Notes: This table shows the number of U.S. circuit court nominees who were nominated two or more times prior to final action on their nominations (and whether confirmed or not by the Senate). The table also provides the overall percentage of circuit court nominees who were confirmed during a presidency and nominated two or more times prior to being confirmed by the Senate. The Trump presidency is not listed in Table 4 because nine individuals who were nominated to circuit court judgeships during the 115th Congress were renominated during the 116th Congress and have yet to receive final action by the Senate.
U.S. District Court Nominees
As shown by Table 5, the total number of district court nominees who were nominated two or more times prior to final action ranged from a low of 3 (during the George H. W. Bush presidency) to a high of 111 (during the Obama presidency).
The number of district court nominees who were nominated more than once and ultimately confirmed by the Senate ranged from a low of 2 (during the George H. W. Bush presidency) to a high of 104 (during the Obama presidency). And the number of nominees who were nominated more than once but not confirmed by the Senate ranged from a low of 1 (during the Carter and George H. W. Bush presidencies) to a high of 9 (during the Clinton presidency).
Overall, of the six presidencies listed in Table 5, President Obama had the greatest percentage of confirmed district court nominees who were nominated more than once prior to being confirmed by the Senate (38.8%). This was an increase from the George W. Bush presidency, when 23.8% of district court nominees were nominated more than once prior to being confirmed (which represents the second-highest percentage of district court nominees nominated more than once prior to Senate approval).
Table 5. Number of U.S. District Court Nominees Who Were Nominated Two or More Times Prior to Final Action and Percentage of All Confirmed U.S. District Court Nominees Nominated Two or More Times Prior to Being Confirmed
|
President |
Number of Nominees Nominated Two or More Times Prior to Final Action |
Percentage of All Confirmed Nominees Who Were Nominated Two or More Times Prior to Being Confirmed |
||
|
Confirmed |
Not Confirmed |
Total |
||
|
Carter |
4 |
1 |
5 |
2.0% |
|
Reagan |
24 |
2 |
26 |
8.3% |
|
Bush, G.H.W. |
2 |
1 |
3 |
1.4% |
|
Clinton |
21 |
9 |
30 |
6.9% |
|
Bush, G.W. |
62 |
6 |
68 |
23.8% |
|
Obama |
104 |
7 |
111 |
38.8% |
Source: Congressional Research Service.
Notes: This table shows the number of U.S. district court nominees who were nominated two or more times prior to final action on their nominations (and whether confirmed or not by the Senate). The table also provides the overall percentage of district court nominees who were confirmed during a presidency and nominated two or more times prior to being confirmed by the Senate. The Trump presidency is not listed in Table 5 because individuals who were nominated to district court judgeships during the 115th Congress were renominated during the 116th Congress and have yet to receive final action by the Senate.
Nominees Whose Nominations Were Returned at the End of a Congress
Table 6 provides data related to the number of U.S. circuit and district court nominees whose nominations were returned by the Senate to the President at the end of each Congress, from the 95th through the 115th.21 The table also indicates how many of these nominees had been given a hearing (or not) by the Judiciary Committee as well as how many had their nominations reported by the committee and pending on the Executive Calendar prior to being returned to the President.
For a Congress that did not coincide with the last two years of a presidency, it was not uncommon for a nominee whose nomination was returned at the end of it to be resubmitted during a subsequent Congress and eventually be approved by the Senate.22 For a Congress, however, that did coincide with the last two years of a presidency, a nominee whose nomination was returned at the end of it was not confirmed by the Senate.
U.S. Circuit Court Nominees
The median number of U.S. circuit court nominees whose nominations were returned to a President at the end of a Congress during this period was 8, while the median number of district court nominees whose nominations were returned at the end of a Congress was 13. For the 13 most recent Congresses (corresponding to Congresses during the Clinton, George W. Bush, Obama, and Trump presidencies), the median number of circuit court nominees whose nominations were returned to a President at the end of a Congress was 9, while the median number of district court nominations returned was 20.
No circuit court nominees had nominations returned at the end of the 95th Congress (during the Carter presidency) or during the 99th Congress (during the Reagan presidency).
The 106th Congress, during the Clinton presidency, had the greatest number of circuit court nominees whose nominations were returned at the end of a Congress (17)—followed by the 107th and 108th Congresses, both during the George W. Bush presidency, when 15 circuit court nominations were returned at the end of each Congress.
The greatest percentage of circuit court nominees who had nominations returned, as a percentage of all nominees who were nominated during a Congress, occurred at the end of the 114th Congress during the Obama presidency (seven of nine nominations, or 77.8%, were returned).
Table 6. U.S. Circuit and District Court Nominees: Number Whose Nominations Were Returned at End of Each Congress and the Percentage of All Nominees Whose Nominations Were Returned at End of Each Congress
(95th Congress through 115th Congress)
|
Congress (Years) |
U.S. Circuit Court Nominees |
U.S. District Court Nominees |
||||||||
|
Hearing & Reported |
Hearing & Not Reported |
No Hearing |
Total |
% of All Nominees |
Hearing & Reported |
Hearing & Not Reported |
No Hearing |
Total |
% of All Nominees |
|
|
95th (1977-78) |
0 |
0 |
0 |
0 |
0.0% |
1 |
0 |
0 |
1 |
2.0% |
|
96th (1979-80) |
0 |
3 |
1 |
4 |
8.3% |
0 |
6 |
6 |
12 |
7.1% |
|
97th (1981-82) |
0 |
0 |
1 |
1 |
5.0% |
0 |
0 |
1 |
1 |
1.4% |
|
98th (1983-84) |
1 |
1 |
1 |
3 |
15.8% |
5 |
3 |
5 |
13 |
17.3% |
|
99th (1985-86) |
0 |
0 |
0 |
0 |
0.0% |
0 |
1 |
2 |
3 |
3.0% |
|
100th (1987-88) |
2 |
0 |
5 |
7 |
26.9% |
1 |
5 |
3 |
9 |
11.5% |
|
101st (1989-90) |
0 |
0 |
1 |
1 |
4.3% |
0 |
0 |
2 |
2 |
4.0% |
|
102nd (1991-92) |
0 |
1 |
9 |
10 |
32.3% |
0 |
0 |
42 |
42 |
29.2% |
|
103rd (1993-94) |
0 |
1 |
2 |
3 |
13.6% |
0 |
2 |
9 |
11 |
9.3% |
|
104th (1995-96) |
4 |
1 |
3 |
8 |
40.0% |
3 |
5 |
12 |
20 |
23.5% |
|
105th (1997-98) |
2 |
1 |
6 |
9 |
30.0% |
2 |
3 |
6 |
11 |
11.7% |
|
106th (1999-00) |
0 |
2 |
15 |
17 |
50.0% |
0 |
2 |
22 |
24 |
28.9% |
|
107th (2001-02) |
0 |
3 |
12 |
15 |
46.9% |
0 |
0 |
15 |
15 |
15.3% |
|
108th (2003-04) |
11 |
3 |
1 |
15 |
44.1% |
0 |
2 |
6 |
8 |
8.5% |
|
109th (2005-06) |
0 |
1 |
9 |
10 |
35.7% |
13 |
1 |
14 |
28 |
43.1% |
|
110th (2007-08) |
0 |
0 |
10 |
10 |
43.5% |
0 |
3 |
17 |
20 |
25.3% |
|
111th (2009-10) |
4 |
0 |
5 |
9 |
36.0% |
16 |
1 |
17 |
34 |
43.6% |
|
112th (2011-12) |
4 |
0 |
3 |
7 |
28.0% |
6 |
4 |
14 |
24 |
18.9% |
|
113th (2013-14) |
0 |
0 |
2 |
2 |
7.7% |
0 |
1 |
10 |
11 |
8.9% |
|
114th (2015-16) |
2 |
1 |
4 |
7 |
77.8% |
18 |
10 |
15 |
43 |
70.5% |
|
115th (2017-18) |
0 |
6 |
6 |
12 |
27.9% |
31 |
17 |
8 |
56 |
50.0% |
Source: Congressional Research Service.
Notes: This table shows, for the 95th Congress through the 115th Congress, the number of nominees whose nominations were returned at the end of a Congress (as well as how many of the nominees had received a Judiciary Committee hearing, or not, and how many had their nominations reported by the committee).
U.S. District Court Nominees
A single district court nominee had a nomination returned at the end of each of the 95th and 97th Congresses during the Carter and Reagan presidencies, respectively.
The 115th Congress had the greatest number of district court nominees whose nominations were returned at the end of a Congress (56).
The smallest percentage of district court nominees who had nominations returned, as a percentage of all nominees who were nominated during a Congress, occurred at the end of the 97th Congress, 1981-1982, during the Reagan presidency (1 of 69, or 1.4%, were returned).
The greatest percentage of district court nominees who had nominations returned, as a percentage of all nominees who were nominated during a Congress, occurred at the end of the 114th Congress, 2015-2016, during the Obama presidency (43 of 61 nominations, or 70.5%, were returned).
Table 6 does not indicate when, during a Congress, a President submitted nominations to the Senate. If nominations are submitted for the first time relatively late in a Congress, it may not give the Senate adequate time to act on them prior to adjournment.
Time from Nomination to Confirmation
This section provides, for nominees confirmed by the Senate from 1977 through 2018, the median number of days from nomination to confirmation by presidency and by Congress.23 In general, the length of time from when a President nominates an individual to a vacant circuit or district court judgeship to when the Senate approves that nomination has steadily increased, for most nominees, since 1977.24
In addition to the general increase in the length of time of the confirmation process itself, an individual nominee might experience a relatively longer period of time from nomination to confirmation due to opposition to the nomination by the nonpresidential party in the Senate; committee and floor scheduling decisions unrelated to partisan opposition to the nomination; and delays in receiving requested background information from the nominee.25
By Presidency
As shown by Table 7, the median number of days from nomination to confirmation for U.S. circuit court nominees for completed presidencies ranged from a low of 45.0 days during the Reagan presidency to a high of 229.0 days during the Obama presidency.
Following the Reagan presidency, the median number of days from nomination to confirmation increased during each successive completed presidency (increasing to 83.0 days during the George H. W. Bush presidency, 139.0 days during the Clinton presidency, 216.0 days during the George W. Bush presidency, and 229.0 days during the Obama presidency).
The first two years of the Trump presidency, with a median of 140.5 days, represent a decline in this trend.
If the average, rather than the median, is used to measure the length of time a President's circuit court nominees waited from nomination to confirmation,26 the average number of days from nomination to confirmation for completed presidencies ranged from a low of 68.7 days during the Reagan presidency to a high of 350.6 days during the George W. Bush presidency.27
Table 7. U.S. Circuit and District Court Nominees: Median Number of Days from Nomination to Confirmation, by Presidency
(1977-2018)
|
Circuit Court Nominees |
District Court Nominees |
|||
|
President |
Number Confirmed |
Median # of Days from Nomination to Confirmation |
Number Confirmed |
Median # of Days from Nomination to Confirmation |
|
Carter |
56 |
62.5 |
202 |
56.5 |
|
Reagan |
83 |
45.0 |
290 |
41.0 |
|
G.H.W. Bush |
42 |
83.0 |
148 |
93.0 |
|
Clinton |
65 |
139.0 |
305 |
99.0 |
|
G.W. Bush |
61 |
216.0 |
261 |
141.0 |
|
Obama |
55 |
229.0 |
268 |
215.0 |
|
Trumpa |
30 |
140.5 |
53 |
235.0 |
Source: Congressional Research Service.
Note: This table shows the median number of days from nomination to confirmation for U.S. circuit and district court nominees whose nominations were approved by the Senate from 1977 through 2018.
a. The statistics presented for the Trump presidency are for the first two years of his presidency and not for his entire term in office. Consequently, the statistics presented for the Trump presidency in Table 7 may not be directly comparable to the statistics provided for the other Presidents listed in the table.
For completed presidencies, the median number of days from nomination to confirmation for U.S. district court nominees ranged from a low of 41.0 days during the Reagan presidency to a high of 215.0 days during the Obama presidency.
Following the Reagan presidency, the median number of days from nomination to confirmation increased during each successive completed presidency (increasing to 93.0 days during the George H. W. Bush presidency, 99.0 days during the Clinton presidency, 141.0 days during the George W. Bush presidency, and to 215.0 days during the Obama presidency).
The first two years of the Trump presidency, with a median of 235.0 days, represented a continuation of this upward trend.28
U.S. Circuit Court Nominees
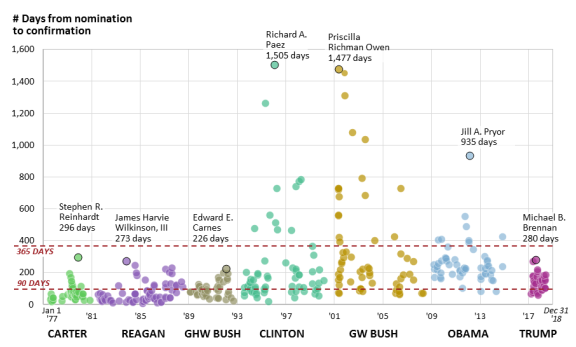
Figure 1 shows, for each U.S. circuit court nominee who was confirmed from 1977 through 2018, the number of days from when that individual was first nominated to when he or she was confirmed by the Senate. The particular circuit court nominee who waited the longest period of time from nomination to confirmation is also labeled for each presidency.29
365 or More Days from Nomination to Confirmation
As shown by the figure, there was a notable increase after the George H. W. Bush presidency in the number of nominees who waited one year or more from nomination to confirmation. During the Carter, Reagan, and George H. W. Bush presidencies, no circuit court nominees waited 365 days or more to be confirmed.
During the Clinton presidency, there were 12 circuit court nominees who waited one year or more to be confirmed. The number of circuit court nominees who waited at least 365 days to be confirmed increased further, to a high of 18, during the George W. Bush presidency. During the Obama presidency, there were 8 circuit court nominees who waited at least one year to be confirmed.
During the first two years of the Trump presidency, none of the 30 circuit court nominees whose nominations were confirmed by the Senate waited at least 365 days to be confirmed.
Overall, 18% of President Clinton's circuit court nominees waited at least 365 days to be confirmed, 30% of President George W. Bush's nominees waited at least this long (the highest among the six completed presidencies), and 15% of President Obama's nominees waited at least 365 days.
90 or Fewer Days from Nomination to Confirmation
During the Carter and Reagan presidencies, 47 and 63 circuit court nominees, respectively, waited 90 or fewer days from nomination to confirmation. During the George H. W. Bush presidency, 24 circuit court nominees waited 90 or fewer days to confirmation. President Clinton had 18 circuit court nominees confirmed within 90 days (i.e., within approximately three months) of being nominated, while President George W. Bush had 11 such nominees. President Obama had 2 circuit court nominees confirmed within three months of being nominated (the lowest number among the completed presidencies).
During the first two years of the Trump presidency, eight circuit court nominees were confirmed within 90 or fewer days of being nominated.
Overall, 84% of President Carter's circuit court nominees were confirmed within 90 days of being nominated. During the Reagan presidency, 76% of circuit court nominees were confirmed within 90 days of nomination, while during the George H. W. Bush presidency 57% of circuit court nominees were confirmed within this time frame.
During the Clinton presidency, the percentage of circuit court nominees approved by the Senate within 90 days fell below half of all circuit court nominees confirmed (to 26%). The percentage of nominees confirmed in 90 or fewer days decreased further during both the George W. Bush presidency (to 16%) and the Obama presidency (to 4%, the lowest percentage among the six completed presidencies).
During the first two years of the Trump presidency, 27% of circuit court nominees were confirmed within 90 days of being nominated.
U.S. District Court Nominees
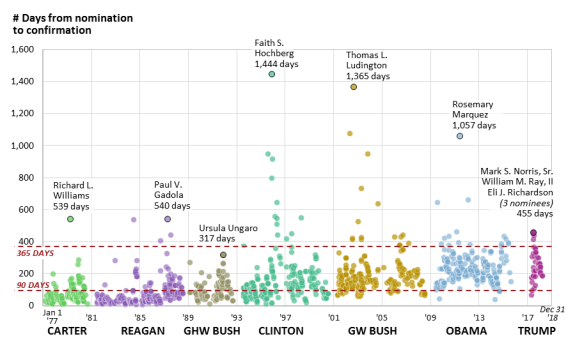
Figure 2 shows, for each U.S. district court nominee who was confirmed from 1977 through 2018, the number of days from when that individual was first nominated to when he or she was confirmed by the Senate. The particular district court nominee who waited the longest period of time from nomination to confirmation is also labeled for each presidency.30
365 or More Days from Nomination to Confirmation
As shown by the figure, there was a notable increase after the George H. W. Bush presidency in the number of nominees who waited one year or more from nomination to confirmation. During the Carter and Reagan presidencies, a combined total of five district court nominees waited 365 days or more to be confirmed.31 No district court nominees during the George H. W. Bush presidency waited 365 or more days from nomination to confirmation.
During the Clinton presidency, there were 14 district court nominees who waited one year or more to be confirmed. The number of district court nominees who waited at least 365 days to be confirmed increased further, to a high of 17, during the George W. Bush presidency. During the Obama presidency, there were 16 district court nominees who waited at least 365 days to be confirmed (which was the second highest among the completed presidencies).
During the first two years of the Trump presidency, there were six district court nominees who waited at least 365 days from nomination to confirmation.
Overall, 5% of President Clinton's district court nominees waited at least 365 days to be confirmed, 7% of President George W. Bush's nominees waited at least this long, and 6% of President Obama's nominees waited at least 365 days.
During the first two years of the Trump presidency, 11% of district court nominees waited at least 365 days from nomination to confirmation.
90 or Fewer Days from Nomination to Confirmation
During the Carter and Reagan presidencies, 157 and 234 district court nominees, respectively, waited 90 or fewer days from nomination to confirmation. During the George H. W. Bush presidency, 72 district court nominees waited 90 or fewer days to confirmation. President Clinton had 129 district court nominees confirmed within 90 days (i.e., within approximately three months) of being nominated, while President George W. Bush had 41 such nominees. President Obama had five district court nominees, the fewest of any completed presidency, confirmed within three months of being nominated.
During the first two years of the Trump presidency, two district court nominees were confirmed within 90 or fewer days of being nominated.
Overall, 78% of President Carter's district court nominees were confirmed within 90 days of being nominated. During the Reagan presidency, 81% of district court nominees were confirmed within 90 days of nomination, while during the George H. W. Bush presidency 49% of district nominees were confirmed within this time frame.
During the Clinton and George W. Bush presidencies, the percentage of district court nominees approved by the Senate within 90 days declined further to 42% and 16%, respectively. During the Obama presidency, the percentage of nominees confirmed in 90 or fewer days was 2% (the lowest percentage of the completed presidencies).
During the first two years of the Trump presidency, 4% of district court nominees were confirmed within 90 days of being nominated.
By Congress
Table 8 reports the median number of days from nomination to confirmation for U.S. circuit and district court nominees whose nominations were approved by the Senate from the 95th Congress through the 115th Congress.
Table 8. U.S. Circuit and District Court Nominees: Median Number of Days from Nomination to Confirmation, by Congress
(95th Congress-115th Congress)
|
Congress |
Years |
Circuit Court Nominees |
District Court Nominees |
||
|
Number Confirmed |
Median Number of Days from Nomination to Confirmation |
Number Confirmed |
Median Number of Days from Nomination to Confirmation |
||
|
95th |
1977-78 |
12 |
29.0 |
48 |
37.5 |
|
96th |
1979-80 |
44 |
66.5 |
154 |
65.0 |
|
97th |
1981-82 |
19 |
28.0 |
68 |
30.0 |
|
98th |
1983-84 |
14 |
46.0 |
61 |
26.0 |
|
99th |
1985-86 |
33 |
45.0 |
95 |
41.0 |
|
100th |
1987-88 |
17 |
118.0 |
66 |
98.0 |
|
101st |
1989-90 |
22 |
79.0 |
48 |
72.5 |
|
102nd |
1991-92 |
20 |
102.5 |
100 |
118.0 |
|
103rd |
1993-94 |
19 |
99.0 |
107 |
78.0 |
|
104th |
1995-96 |
11 |
167.0 |
62 |
99.0 |
|
105th |
1997-98 |
20 |
196.5 |
79 |
139.0 |
|
106th |
1999-2000 |
15 |
204.0 |
57 |
119.0 |
|
107th |
2001-02 |
17 |
256.0 |
83 |
126.0 |
|
108th |
2003-04 |
18 |
201.0 |
85 |
152.0 |
|
109th |
2005-06 |
16 |
281.5 |
35 |
132.0 |
|
110th |
2007-08 |
10 |
228.5 |
58 |
199.0 |
|
111th |
2009-10 |
16 |
252.5 |
44 |
140.0 |
|
112th |
2011-12 |
14 |
219.0 |
97 |
225.0 |
|
113th |
2013-14 |
23 |
229.0 |
109 |
203.0 |
|
114th |
2015-16 |
2 |
331.0 |
18 |
299.5 |
|
115th |
2017-18 |
30 |
140.5 |
53 |
235.0 |
Source: Congressional Research Service.
Note: This table shows, for the 95th Congress through the 115th Congress, the number of U.S. circuit and district court nominees confirmed during each Congress and the median number of days from nomination to confirmation.
U.S. Circuit Court Nominees
For circuit court nominees, the median number of days from nomination to confirmation ranged from a low of 28.0 days during the 97th Congress (1981-1982) to a high of 331.0 days during the 114th Congress (2015-2016). The second-shortest median number of days from nomination to confirmation was 29.0 days during the 95th Congress (1977-1978), while the second-highest median number of days was 281.5 days during the 109th Congress (2005-2006).
The median number of days from nomination to confirmation for U.S. circuit court nominees stayed above 200 days from the 106th through 114th Congresses. In contrast, for the 115th Congress, the median number of days from nomination to confirmation (140.5 days, or 4.6 months) declined to its lowest point since the 103rd Congress.
If the average, rather than the median, is used to measure the length of time circuit court nominees waited from nomination to confirmation, the average number of days from nomination to confirmation ranged from a low of 32.6 days during the 95th Congress to a high of 562.9 days during the 109th Congress. Additionally, the average time from nomination to confirmation for U.S. circuit court nominees increases by more than 30 days, relative to the median, for the 106th Congress (to 373.9 days); 105th Congress (303.1 days); 108th Congress (287.2 days); 113th Congress (281.2 days); and 110th Congress (268.8 days).32
U.S. District Court Nominees
For U.S. district court nominees, the median number of days from nomination to confirmation ranged from a low of 26.0 days during the 98th Congress (1983-1984) to a high of 299.5 days during the 114th Congress (2015-2016). The second-shortest median was 30.0 days during the 97th Congress (1981-1982), while the second-longest median was 235.0 days during the 115th Congress (2017-2018).33
The median number of days from nomination to confirmation during the 115th Congress was the fourth consecutive Congress for which the median wait time from nomination to confirmation for district court nominees was greater than 200 days. The first Congress during which the median wait time for district court nominees exceeded 200 days was the 112th Congress (2011-2012).
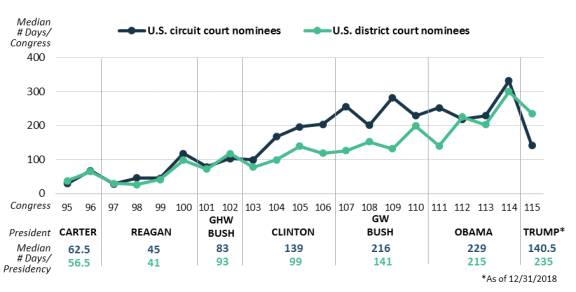
Figure 3 displays the overall trends in the median number of days from nomination to confirmation for U.S. circuit and district court nominees who were confirmed from the 95th Congress through the 115th Congress (and also indicates the corresponding presidency for each Congress during this period).
For circuit court nominees, the five greatest increases in the number of median days from nomination to confirmation occurred during the 114th Congress (an increase of 102.0 days from the 113th Congress); the 109th Congress (an increase of 80.5 days from the 108th Congress); 100th Congress (an increase of 73.0 days from the 99th Congress); 104th Congress (an increase of 68.0 days from the 103rd Congress); and the 107th Congress (an increase of 52.0 days from the 106th Congress).
Most recently, from the 114th to 115th Congress, the median number of days from nomination to confirmation for U.S. circuit court nominees declined from 331.0 to 140.5 days.34
For district court nominees, the five greatest increases in the number of median days from nomination to confirmation occurred during the 114th Congress (an increase of 96.5 days from the 113th Congress); 112th Congress (an increase of 85.0 days from the 111th Congress); 110th Congress (an increase of 67.0 days from the 109th Congress); 100th Congress (an increase of 57.0 days from the 99th Congress); and the 102nd Congress (an increase of 45.5 days from the 101st Congress).
Most recently, from the 114th to 115th Congress, the median number of days from nomination to confirmation for U.S. district court nominees declined from 299.5 to 235.0 days.35
Time from Nomination to Committee Hearing
The President customarily transmits a circuit or district court nomination to the Senate in the form of a written nomination message. Once received, the nomination is numbered by the Senate executive clerk, read on the floor, and then immediately referred to the Judiciary Committee.36
The Judiciary Committee's processing of the nomination typically consists of three phases—a prehearing phase, the holding of a hearing on the nomination, and voting on whether to report the nomination to the Senate.37 During a hearing on the nomination, lower court nominees engage in a question-and-answer session with members of the Senate Judiciary Committee. The hearing typically is held for more than one judicial nominee at a time.
From 1977 through 2018, the median length of time from when an individual was first nominated to a circuit court judgeship to when he or she received a hearing by the Judiciary Committee was 63.0 days (or 2.1 months).38 During this same period, the median length of time from when an individual was nominated to a district court judgeship to when he or she received a hearing was also 63.0 days.
Table 9. U.S. Circuit and District Court Nominees: Median Number of Days from Nomination to Committee Hearing
(1977-2018)
|
President |
Circuit Court Nominees |
District Court Nominees |
|
Median Number of Days from Nomination to Hearing |
Median Number of Days from Nomination to Hearing |
|
|
Carter |
39.0 |
38.0 |
|
Reagan |
23.0 |
22.0 |
|
G.H.W. Bush |
65.5 |
65.0 |
|
Clinton |
97.0 |
69.0 |
|
G.W. Bush |
154.0 |
87.5 |
|
Obama |
79.5 |
83.0 |
|
Trumpa |
69.0 |
77.0 |
Source: Congressional Research Service.
Note: This table shows, by presidency, the median number of days from nomination to hearing for U.S. circuit and district court nominees from 1977 through 2018.
a. The statistics presented for the Trump presidency are for the first two years of his presidency and not for his entire term in office. Consequently, the statistics presented for the Trump presidency in Table 9 may not be directly comparable to the statistics provided for the other Presidents listed in the table.
As shown in Table 9, the median length of time from nomination to committee hearing for circuit and district court nominees has, however, varied across presidencies.39 For individuals nominated during more recent presidencies, the length of time from nomination to committee hearing has been relatively longer than the median for all nominees from 1977 through 2018.
The median number of days from nomination to committee hearing for U.S. circuit court nominees ranged from a low of 23.0 days (during the Reagan presidency) to a high of 154.0 days (during the George W. Bush presidency).40
For the first two years of the Trump presidency, the median number of days from nomination to hearing for U.S. circuit court nominees was 69.0 days.
The median number of days from nomination to committee hearing for U.S. district court nominees ranged from a low of 22.0 days (during the Reagan presidency) to a high of 87.5 days (during the George W. Bush presidency).41
For the first two years of the Trump presidency, the median number of days from nomination to hearing for U.S. district court nominees was 77.0 days.
Time from Committee Report to Confirmation
After a nominee receives a hearing by the Judiciary Committee, she awaits a vote by the committee on whether her nomination will be reported to the Senate as a whole.42 If the nomination is not put to the committee for a vote, or if the committee votes against reporting it (i.e., rejects the nomination),43 the nomination will not move forward, ultimately failing to receive Senate confirmation.
The committee, in reporting a nomination to the Senate as a whole, has three options—to report a nomination favorably, unfavorably, or without recommendation. Almost always, when the committee votes on a nomination, it votes to report favorably. The committee, however, may vote (as it has done in the past, but only on rare occasions) to report unfavorably or without recommendation.44 Such a vote advances the nomination for Senate consideration despite the lack of majority support for it in committee. After it is reported by the Judiciary Committee, a circuit or district court nomination is listed on the Executive Calendar and is eligible for floor consideration.45
The nominees who are included in this part of the analysis all had their nominations reported by the Judiciary Committee (i.e., their nominations advanced to the full Senate for consideration) and were confirmed by the Senate.
From 1977 through 2018, the median length of time from when an individual who was nominated to a circuit court judgeship had his nomination reported by the Judiciary Committee to when he was confirmed by the Senate was 9.0 days. During this same period, the median length of time from when a district court nominee had his nomination reported to when he was confirmed was 8.0 days.
There was, however, variation during this period across presidencies in how long circuit and district court nominees waited to be confirmed once their nominations were reported by the Judiciary Committee—with nominees during more recent presidencies waiting longer to be confirmed once their nominations were reported by the committee.46
As shown by Table 10, for completed presidencies, the median number of days from committee report to confirmation for U.S. circuit court nominees ranged from a low of 1.0 day (during the George H. W. Bush presidency) to a high of 98.0 days (during the Obama presidency).47
For the first two years of the Trump presidency, the median number of days from committee report to confirmation was 26.0 days.
Table 10. U.S. Circuit and District Court Nominees: Median Number of Days from Committee Report to Confirmation
(1977-2018)
|
President |
Circuit Court Nominees |
District Court Nominees |
|
Median Number of Days from Committee Report to Confirmation |
Median Number of Days from Committee Report to Confirmation |
|
|
Carter |
2.0 |
2.0 |
|
Reagan |
4.0 |
4.0 |
|
G.H.W. Bush |
1.0 |
1.0 |
|
Clinton |
13.0 |
8.0 |
|
G.W. Bush |
14.0 |
19.0 |
|
Obama |
98.0 |
84.0 |
|
Trumpa |
26.0 |
133.0 |
Source: Congressional Research Service.
Notes: This table shows, by presidency, the median number of days from committee report to confirmation for U.S. circuit and district court nominees from 1977 through 2018.
a. The statistics presented for the Trump presidency are for the first two years of his presidency and not for his entire term in office. Consequently, the statistics presented for the Trump presidency in Table 10 may not be directly comparable to the statistics provided for the other Presidents listed in the table.
For completed presidencies, the median number of days from committee report to confirmation for U.S. district court nominees ranged from a low of 1.0 day (during the George H. W. Bush presidency) to a high of 84.0 days (during the Obama presidency).48
For the first two years of the Trump presidency, the median number of days from committee report to confirmation for U.S. district court nominees was 133.0 days.
Ratings by the American Bar Association for Confirmed Nominees
Since 1953, every presidential Administration, except those of George W. Bush and Donald Trump, has sought prenomination evaluations of its candidates for district and circuit court judgeships by the American Bar Association (ABA).49
The committee that performs this evaluation, the ABA's Standing Committee on the Federal Judiciary, is made up of 15 lawyers with various professional experiences. The stated objective of the committee is to assist the White House in assessing whether prospective judicial nominees should be nominated.50 It seeks to do so by providing what it describes as an "impartial peer-review evaluation" of each candidate's professional qualifications. This evaluation, according to the committee, focuses strictly on a candidate's "integrity, professional competence and judicial temperament" and does not take into account the candidate's "philosophy, political affiliation or ideology."51 In evaluating professional competence, the committee assesses the prospective nominee's "intellectual capacity, judgment, writing and analytical abilities, knowledge of the law, and breadth of professional experience."52
Following the multistep evaluation process by the committee,53 a nominee is given an official rating of "well qualified," "qualified," or "not qualified."54 A rating is provided strictly on an advisory basis; it is solely in the President's discretion as to how much weight to place on a judicial candidate's ABA rating in deciding whether to nominate him or her.55
As shown by Table 11, there is some variation across presidencies in the percentage of confirmed U.S. circuit and district court nominees who received a particular rating by the ABA. For U.S. circuit court nominees for completed presidencies, the percentage who received a well qualified rating ranged from a low of 56.6% during the Reagan presidency to a high of 80.0% during the Obama presidency.
During the first two years of the Trump presidency, 80.0% of confirmed circuit court nominees also received a well qualified rating.
None of the completed presidencies listed in the table had any confirmed circuit court nominees who were rated as not qualified by the ABA.
During the first two years of the Trump presidency, two circuit court nominees were rated as not qualified (comprising 6.7% of the circuit court nominees confirmed during this period).56
Table 11. U.S. Circuit and District Court Nominees: Official Ratings by the American Bar Association for Nominees Confirmed by the Senate
(1977-2018)
|
President |
Circuit Court Nominees |
District Court Nominees |
|||||
|
Well Qualified |
Qualified |
Not Qualified |
Well Qualified |
Qualified |
Not Qualified |
||
|
Cartera |
75.0% |
25.0% |
n/a |
51.0% |
47.5% |
1.5% |
|
|
Reagan |
56.6% |
43.4% |
n/a |
53.8% |
46.2% |
n/a |
|
|
G.H.W. Bush |
61.9% |
38.1% |
n/a |
57.4% |
42.6% |
n/a |
|
|
Clinton |
75.4% |
24.6% |
n/a |
58.7% |
40.0% |
1.3% |
|
|
G.W. Bush |
68.9% |
31.1% |
n/a |
69.3% |
29.1% |
1.5% |
|
|
Obama |
80.0% |
20.0% |
n/a |
58.6% |
41.4% |
n/a |
|
|
Trumpb |
80.0% |
13.3% |
6.7% |
62.3% |
34.0% |
3.8% |
|
Source: Congressional Research Service.
Note: This table shows, for presidencies since 1977, the percentage of confirmed U.S. circuit and district court nominees who received an official rating of "well qualified," "qualified," and "not qualified" by the American Bar Association.
a. During the Carter and Reagan presidencies, the American Bar Association utilized a rating system that also allowed for a rating of "extremely well qualified." For the purposes of this report, any nominee who received such a rating during this period is included in the percentage of nominees who received a well qualified rating.
b. The statistics presented for the Trump presidency are for the first two years of his presidency and not for his entire term in office. Consequently, the statistics presented for the Trump presidency in Table 11 may not be directly comparable to the statistics provided for the other Presidents listed in the table.
For confirmed U.S. district court nominees, the percentage who received a well qualified rating ranged from a low of 51.0% during the Carter presidency to a high of 69.3% during the George W. Bush presidency. During the first two years of the Trump presidency, 62.3% of confirmed district court nominees received a well qualified rating.
For completed presidencies during which at least one confirmed district court nominee was rated as not qualified, the percentage of nominees who received such a rating ranged from a high of 1.5% of all confirmed nominees during the Carter and George W. Bush presidencies to a low of 1.3% of such nominees during the Clinton presidency.57 During the first two years of the Trump presidency, 3.8% of confirmed district court nominees received a rating of not qualified.58
Frequency of Roll Call Votes for Confirmed Nominees
The Senate may confirm nominations by unanimous consent, voice vote, or by recorded roll call vote. When the question of whether to confirm a nomination is put to the Senate, a roll call vote will be taken on the nomination if the Senate has ordered "the yeas and nays." The support of 11 Senators is necessary to order the roll call.59
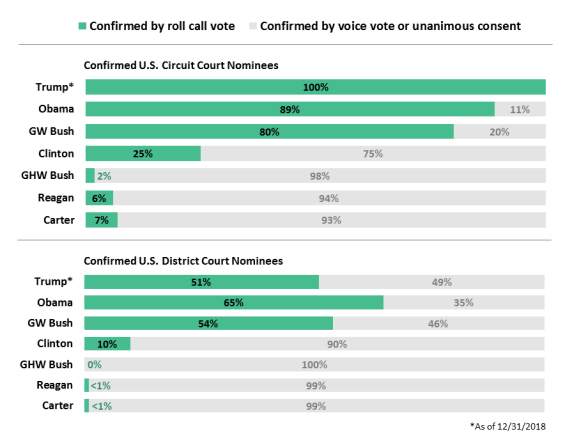
Historically, the Senate confirmed most U.S. circuit and district court nominations by unanimous consent or by voice vote. As shown by Figure 4, however, using roll call votes to confirm nominees has become much more common during recent presidencies.
A relatively small percentage of circuit court nominees were confirmed by roll call vote during the Carter, Reagan, and George H. W. Bush presidencies. Specifically, 7.1%, 6.0%, and 2.4% of circuit court nominees were confirmed by roll call during each of these three presidencies, respectively.60
Additionally, only one district court nominee was confirmed by roll call vote during each of the Carter and Reagan presidencies, and no district court nominees were confirmed by roll call vote during George H. W. Bush's presidency.
Confirmation by roll call vote became more common during the Clinton presidency, with nearly one-quarter, 24.6%, of circuit court nominees and 10.5% of district court nominees receiving roll call votes at the time of Senate confirmation.61
It was not, however, until the George W. Bush presidency that a majority of lower court nominees were approved using roll call votes, with 80.3% of circuit court nominees and 54.0% of district court nominees confirmed in this way. This trend continued under President Obama, with 89.1% of circuit court nominees and 64.6% of district court nominees being confirmed by roll call vote.62
During the first two years of the Trump presidency, all U.S. circuit court nominees were confirmed using roll call votes, representing an increase from recent years in the frequency of using roll call votes to confirm circuit court nominees. In contrast, 50.9% of district court nominees were confirmed by roll call vote, representing a decrease from recent years in the frequency of using roll call votes to confirm district court nominees.63
|
Figure 4. U.S. Circuit and District Court Nominees: Percentage Confirmed by Roll Call Vote |
 |
|
Source: Congressional Research Service. Notes: These figures show the percentage of U.S. circuit and district court nominees confirmed by roll call vote from the Carter presidency through the first two years of the Trump presidency. The statistics presented for the Trump presidency are for the first two years of his presidency and not for his entire term in office. Consequently, the statistics presented for the Trump presidency in Figure 4 may not be directly comparable to the statistics provided for the other Presidents listed in the figure. |
Number of Nay Votes Received
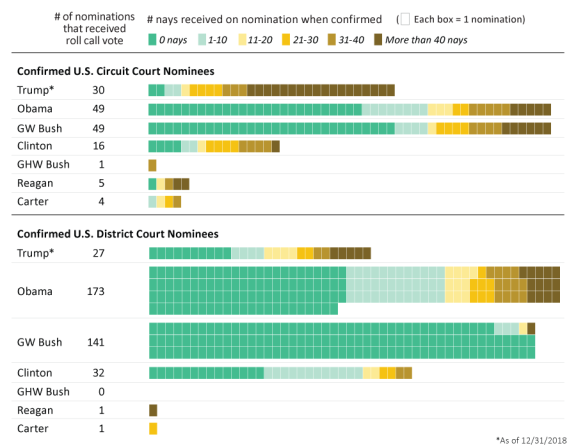
The increased frequency with which roll call votes have been used to confirm U.S. circuit and district court nominations has not always been correlated with Senators using roll call votes to express opposition to a nominee by voting against his or her nomination. As shown by Figure 5, there is notable variation in the number of nay votes received by circuit and district court nominations when they have been confirmed by roll call vote.
The figure shows the number of nominations that received zero nay votes at the time of confirmation. For nominations that received at least one nay vote, the roll call data are presented using five ranges to reflect the number of nay votes received by a President's nominees: (1) 1 to 10 nay votes; (2) 11 to 20 nay votes; (3) 21 to 30 nay votes; (4) 31 to 40 nay votes; and (5) more than 40 nay votes.
|
Figure 5. U.S. Circuit and District Court Nominees: Number of Nay Votes Received at Time of Confirmation |
 |
|
Source: Congressional Research Service. Notes: These figures show the number of nominations that received zero nay votes at the time of confirmation. For nominations that received at least one nay vote, the roll call data are presented using five ranges to reflect the number of nay votes received by a President's nominees: (1) 1 to 10 nay votes; (2) 11 to 20 nay votes; (3) 21 to 30 nay votes; (4) 31 to 40 nay votes; and (5) more than 40 nay votes. The statistics presented for the Trump presidency are for the first two years of his presidency and not for his entire term in office. Consequently, the statistics presented for the Trump presidency in Figure 5 may not be directly comparable to the statistics provided for the other Presidents listed in the figure. |
During the Clinton presidency, 12 (75.0%) of 16 circuit court nominees who were confirmed by roll call vote received at least one nay vote (with 9, or 56.2%, receiving more than 20 nay votes). Of the 32 district court nominees who were confirmed by roll call vote, 18 (56.2%) received at least one nay vote.
In contrast to the Clinton presidency, a majority of the circuit and district court nominees approved by roll call vote during the George W. Bush and Obama presidencies were confirmed after having received zero nay votes. During the Bush presidency, 30 (61.2%) of 49 circuit court nominees confirmed by roll call votes received zero nay votes. For the 141 district court nominees confirmed by roll call vote, 136 (96.4%) received zero nay votes.
During the Obama presidency, 26 (53.1%) of 49 circuit court nominees confirmed by roll call vote received zero nay votes. For the 173 district court nominees confirmed by roll call vote, 95 (54.9%) received zero nay votes.
During the first two years of the Trump presidency, 18 (60.0%) of 30 circuit court nominees approved by roll call vote were confirmed with more than 40 nay votes. In contrast, 2 (6.7%) were confirmed with zero nay votes. For district court nominees, 17 (63.0%) of 27 confirmed by roll call vote received at least one nay vote (while 10, or 37.0%, received zero nay votes). Of the 17 who received at least one nay vote, a plurality (5, or 29.4%) received more than 40 nay votes.
Demographic Characteristics of Confirmed Nominees
This section provides data related to the gender and race of U.S. circuit and district court nominees confirmed by the Senate during each presidency since the Carter Administration. These particular demographic characteristics of judicial nominees are of ongoing interest to Congress. Such interest is demonstrated especially at the time circuit and district court nominations are considered by the Senate.64 For example, floor statements by Senators in support of circuit or district court nominees frequently emphasize the particular demographic characteristics of nominees who would enhance the diversity of the federal judiciary.65
Gender
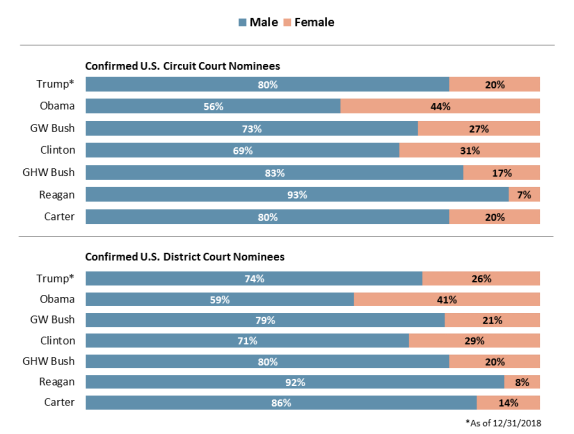
As shown by Figure 6, for completed presidencies,66 the percentage of confirmed U.S. circuit court nominees who were women ranged from a low of 7.2% during the Reagan presidency to a high of 43.6% during the Obama presidency.67
|
Figure 6. U.S. Circuit and District Court Nominees: Percentage of Confirmed Nominees by Gender and Presidency |
 |
|
Source: Congressional Research Service. Note: This figure shows, for select presidencies, the percentage of confirmed U.S. circuit and district court nominees by gender. The statistics presented for the Trump presidency are for the first two years of his presidency and not for his entire term in office. Consequently, the statistics presented for the Trump presidency in Figure 6 may not be directly comparable to the statistics provided for the other Presidents listed in the figure. |
For district court nominees, the percentage of confirmed nominees who were women ranged from a low of 8.3% during the Reagan presidency to a high of 41.0% during the Obama presidency.
During the first two years of the Trump presidency, 20.0% of confirmed U.S. circuit court nominees were women, while 26.4% of confirmed district court nominees were women.68
Race
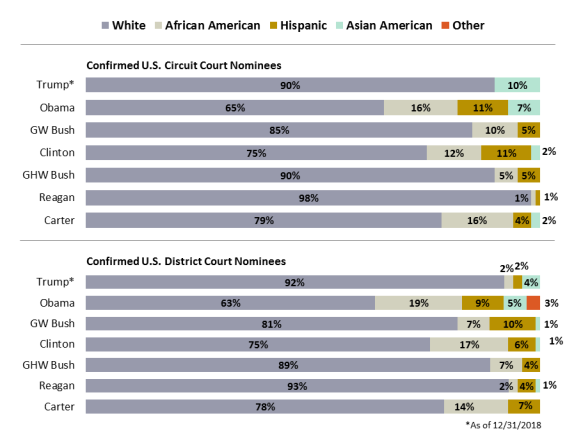
Figure 7 shows the percentage of each President's confirmed U.S. circuit and district court nominees who were African American, Asian American, Hispanic, and white.69
Confirmed African American Nominees
For completed presidencies, the percentage of confirmed U.S. circuit court nominees who were African American ranged from a low of 1.2% during the Reagan presidency to a high of 16.4% during the Obama presidency.70
During the first two years of the Trump presidency, no confirmed circuit court nominees were African American.
For completed presidencies, the percentage of confirmed U.S. district court nominees who were African American ranged from a low of 2.1% during the Reagan presidency to a high of 18.7% during the Obama presidency.71
During the first two years of the Trump presidency, 1.9% of confirmed district court nominees were African American.72
|
Figure 7. U.S. Circuit and District Court Nominees: Percentage of Confirmed Nominees by Race and Presidency |
 |
|
Source: Congressional Research Service. Note: This figures shows, for select presidencies, the percentage of confirmed U.S. circuit and district court nominees by race. Any group that comprises less than 1% of a President's appointees is not represented in the figure. The statistics presented for the Trump presidency are for the first two years of his presidency and not for his entire term in office. Consequently, the statistics presented for the Trump presidency in Figure 7 may not be directly comparable to the statistics provided for the other Presidents listed in the figure. |
Confirmed Asian American Nominees
For completed presidencies, there were no Asian American circuit court judges appointed during the Reagan, George H. W. Bush, or George W. Bush presidencies. The greatest percentage was appointed during the Obama presidency (7.3%).73
During the first two years of the Trump presidency, 10.0% of confirmed circuit court nominees were Asian American.
For past presidencies, there were no Asian American district court judges appointed during the George H. W. Bush presidency. The greatest percentage was appointed during the Obama presidency (5.2%).74
During the first two years of the Trump presidency, 3.8% of confirmed district court nominees were Asian American.75
Confirmed Hispanic Nominees
For completed presidencies, the percentage of confirmed U.S. circuit court nominees who were Hispanic ranged from a low of 1.2% during the Reagan presidency to a high of 10.9% during the Obama presidency.76
During the first two years of the Trump presidency, no confirmed circuit court nominees were Hispanic.
For completed presidencies, the percentage of confirmed U.S. district court nominees who were Hispanic ranged from a low of 4.1% during the George H. W. Bush presidency to a high of 10.3% during the George W. Bush presidency.77
During the first two years of the Trump presidency, 1.9% of confirmed district court nominees were Hispanic.78