Introduction
This report presents data on average Member tenure over time, analyzes several factors that affect tenure in any given Congress, and examines historical patterns of congressional service, including the distribution of years served within each Congress, and the cross-chamber experience of Representatives and Senators.
During much of the 19th century, the average tenure of Representatives and Senators remained relatively steady, with incoming Representatives generally averaging between two and three years of prior service in most Congresses, and Senators averaging between three and five years. Beginning in the late 19th and through much of the 20th century, average tenure for Members in both chambers steadily increased. The average years of service for Members of the 116th Congress, as of January 3, 2019, when the Congress convened, was 8.6 years for the House and 10.1 years for the Senate.
Two factors that affect average years of service are examined in this report: the percentage of Members choosing to seek reelection, and the success rate of Members who do seek reelection. The findings presented here align with scholarly assessments of congressional history, which conclude that during the early history of Congress, turnover in membership was frequent and resignations were commonplace. Many lawmakers in the 18th and early 19th centuries might be characterized as "citizen legislators," holding full-time nonpolitical employment and serving in Congress on a part-time basis for a short number of years. During the 20th century, congressional careers lengthened as turnover decreased and Congress became more professionalized.
The report also examines two further issues related to Member tenure, including the distribution of Member service over time, as well as Members' cross-chamber experience. Although the average tenure of Members has increased since the late 19th century, a substantial portion of Representatives and Senators in recent Congresses have served for six years or less in their respective chambers. With respect to cross-chamber experience, while a small proportion of Representatives have historically had previous Senate experience, a sizable percentage of Senators throughout congressional history have had previous House experience.
Methodology
Data
Data on the tenure of Members of Congress for the 1st through 115th Congresses are drawn from the Biographical Directory of the United States Congress,1 which records each Member's service in the House and Senate from the 1st Congress through the present. Specifically, each Member listed in the Biographical Directory was recorded, along with the beginning and ending dates of the Congresses in which the directory indicates they served. To identify any instances where a Member did not serve for the entire duration of a particular Congress, individual Member biographies contained in the Biographical Directory were consulted, in addition to the Roster of United States Congressional Officeholders and Biographical Characteristics of the United States Congress, 1789-1996,2 as well as the Congressional Directory3 for evidence that a Member's service began after the opening day of a Congress, or ended prior to the last day of a Congress. Data for new Members of the 116th Congress come from the Clerk of the House and CQ Press's Guide to the New Congress.4 Each Member's service in a given Congress in years is calculated by dividing their total days served in that Congress by 365.25. As of the beginning date of each Congress, each Member's years of total prior service in each chamber is calculated.
Data on Member tenure as described above are aggregated to generate a series of summary statistics for each chamber from the 1st through 116th Congresses. Statistics are calculated as of the first day of the Congress. For example, the average tenure of Senators in the 115th Congress is generated by first identifying those Senators who served during the opening day of the Congress (January 3, 2017), obtaining each Senator's total years of prior service in the Chamber as of the opening day of the Congress, and computing the average for the chamber.5 Consequently, any changes in membership during the term arising from vacancies and replacements are not taken into account. In addition, the statistics reported on average tenure over time include prior service within the chamber, but do not include cross-chamber experience (i.e., years of Senators' House experience, or Representatives' Senate experience). Freshman Members in each chamber are considered to have zero years of prior chamber service.
Average Service Tenure
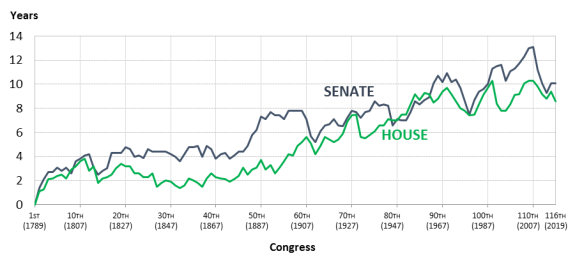
As shown in Figure 1 below, the average years of service of Members in both chambers has generally increased over time. The prior House service of incoming Representatives increased from an average of 2.5 years in the 19th century to 9.5 in the 21st to date; the average peaked at 10.3 years—just over five terms—during the 102nd (1991-1992), 110th (2007-2008), and 111th Congresses (2009-2010). Incoming Senators averaged 4.8 years of prior chamber service in the 19th century, and 11.2 years during the 21st century to date. This figure peaked at 13.1 years during the 111th Congress (2009-2010).
For both the House and Senate, the Congress with the fewest average years of prior experience was the 1st, as all Senators and Representatives necessarily had zero years of experience upon arrival. In the last 50 years, the Congress with the lowest average years of service among Representatives and Senators was the 97th Congress (1981-1982), in which incoming Representatives had an average of 7.4 years of prior service in the House (slightly more than 3.5 terms) and Senators had an average of 7.5 years of prior service in the Senate (1.25 terms).
House of Representatives
As shown in Figure 1, during the 19th century (7th through 56th Congresses), the average service of Representatives remained relatively steady; during this time incoming Representatives averaged between 1.4 and 3.8 years of prior service.6 Around the turn of the 20th century, the average began to increase, rising from just over four years at the beginning of the century, to approximately nine years in each of the three most recent prior Congresses. At the start of the 116th Congress, the average years of prior service for Representatives was 8.6 years.
Among Members serving in the 116th Congress, Don Young is the longest-serving Representative, with approximately 46 years of service in the House as of the beginning of the Congress.
Senate
Historically, the average years of service among Senators has been similar to that of Representatives, with relative stability during much of the 19th century, followed by a steady increase beginning in the late 19th and early 20th century. As shown in Figure 1, for much of the 19th century, the average prior service of Senators remained roughly constant at approximately four years. Beginning in the 1880s, the average began to rise steadily, predating the similar rise in the House by about 20 years. After falling dramatically for a short time in the 1910s, the average years of prior service in the Senate began to rise steadily again, tracking the rise in average years of service among Representatives. At the start of the 116th Congress, incoming Senators averaged 10.1 years of prior Senate service.
Among Members serving in the 116th Congress, the longest-serving Senator is Patrick Leahy, with 44 years of service in the Senate as of the beginning of the 116th Congress.
Factors Affecting Average Tenure
Among the many factors that may affect variation in Member seniority over time, two are examined in this report: the decision of sitting Members whether or not to seek reelection to the next Congress, and the success rate of Members who do seek reelection.7 Each of these components is discussed below in greater detail.
The Rate of Members Seeking Reelection
The average years of prior service for Representatives and Senators is influenced by Member choices about whether or not to seek reelection to the chamber. If a large number of Members in one Congress choose not to seek reelection, many Members of the subsequent Congress will necessarily be first-term Members with no prior service. Members might not seek reelection for any number of reasons; common historical reasons include seeking another office, appointment to other government positions, retirement from public service, and death.
Figure 2 plots the percentage of Representatives in each Congress who did not seek reelection to the following Congress.8
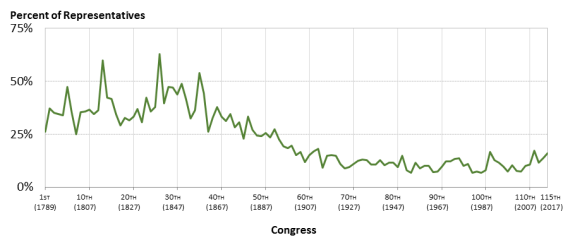
As shown in Figure 2, the rate of Representatives not seeking reelection dropped dramatically beginning in the mid-19th century. Prior to the 1860s, it was common for 40% of Representatives or more not to seek reelection, and prior to the 46th Congress (1879-1880) this figure never fell below 25%. After declining in the latter part of the 19th century, the rate at which Members have not sought reelection has remained relatively steady during the 20th and 21st centuries, averaging approximately 11.5% during this time period.
Reelection Success Rate
In addition to the rate at which Members seek reelection, a second important factor in understanding variation in average seniority in Congress is the success rate among Members who do seek reelection.9 Figure 3 plots the percentage of Representatives in each Congress who sought reelection to the next Congress but were defeated, either in their attempt to gain their party's nomination or in the general election for office.10
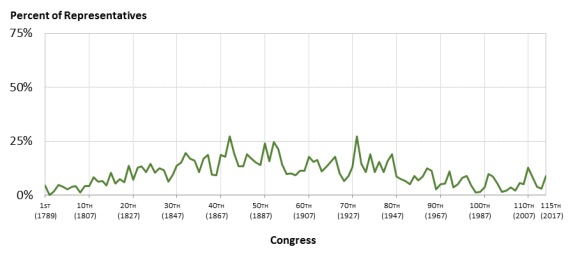
As shown in Figure 3, the percentage of Representatives defeated for reelection generally increased during the 19th century, and later declined over the course of the 20th century. There was significant short-term variation resulting from high-turnover elections, including the 1872, 1890, 1894, and 1932 elections (to the 43rd, 52nd, 54th, and 72nd Congresses, respectively).
Discussion
The data presented in Figure 2 and Figure 3 align with scholarly assessments of congressional history, which conclude that during the early history of Congress, turnover in membership was frequent and resignations were commonplace, and that during the 20th century, congressional careers lengthened as turnover decreased and Congress became more professionalized.
Many lawmakers in the 18th and early 19th centuries might be characterized as "citizen legislators," holding full-time nonpolitical employment and serving in Congress on a part-time basis for a short number of years. According to political scientist Randall Ripley, "In the pre-modern Congress, Members came and went rapidly. There were few senior Members. Life in Washington was not pleasant; Congress did not seem very important."11
According to H. Douglas Price, the lack of incentives for Members to retain their seats explains the high turnover in those early years of the House. Power was fluid in the House. The Speaker controlled committee appointments, changes in party control were common, and seniority in the chamber was not yet as valuable as it would later become.12
After the Civil War, circumstances changed and precipitated a rise of careerism in Congress.13 Legislative careers became professionalized, and the concept of the "citizen legislator" became a thing of the past.14 Some observers attribute this to institutional changes in the structure of congressional elections, such as the strengthening of the party system and the emergence of one-party states and districts following the Civil War.15 Others have identified redistricting practices as a potential factor in lengthening careers.16 Recent scholarship has pointed to historical electoral reforms, such as adoption of the secret ballot and nominating primaries, as contributing to the increases in average tenure around the turn of the 20th century.17
Other scholars have pointed to institutional changes in congressional operations, such as the rise of the seniority system, the development of the committee system, and new advantages of incumbency that allowed Members to generate publicity, serve constituents, and receive support in organizing their offices and forming agendas that help them be effective legislators.18 In addition, the development of transportation technology made travel between Washington and a Member's home district less burdensome, potentially increasing the attractiveness of a longer career.
Finally, the emergence of national problems raised a legislative career to a new level of importance. As the federal government took on new responsibilities, both after the Civil War and in the early 20th century, Members may have begun to view congressional office as relatively more desirable than state office, and this may have contributed to many Members' desire to remain in Congress.19
Patterns of Congressional Service
Distribution of Service Experience
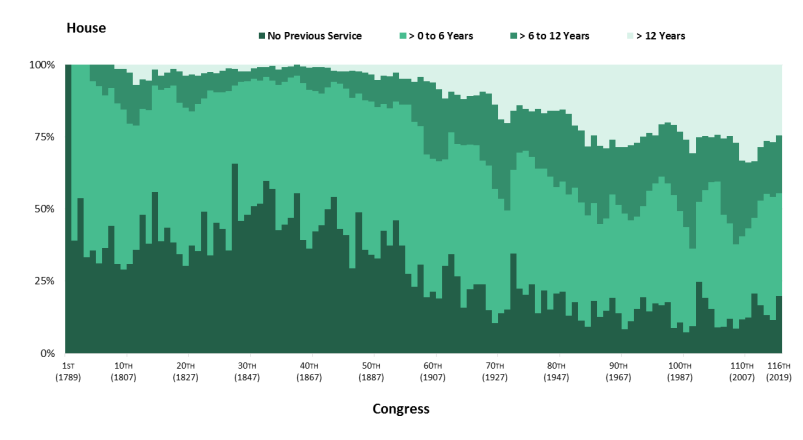
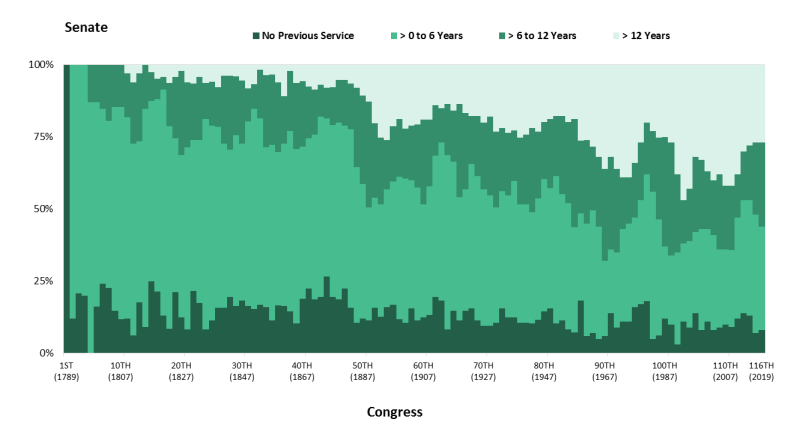
Examining the aggregate average years of Member service in a given Congress reveals little about the underlying distribution of service among individual Members. Figure 4 and Figure 5 present the distribution of service experience of Representatives and Senators, respectively, from the 1st through 116th Congresses. For each Congress, the figures plot the percentage of each chamber made up of the following four categories of Members: first-term Members with no prior chamber service, returning Members with six years of chamber service or fewer, returning Members with between 6 and 12 years of chamber service, and Members with more than 12 years of chamber service.
House of Representatives
As shown in Figure 4, from Congress's early years and throughout the 19th century, it was not uncommon for 40% or more of the House to be made up of Members with no prior experience in the chamber; in nine different Congresses during the century, Representatives with no previous House experience made up half of the chamber or more.20 As the proportion of incoming freshman Members began to decline around the turn of the 20th century, the proportion of Representatives with more than 12 years of service began to increase. Members in this category made up approximately 6% of the House in the 57th Congress (1901-1902); the figure peaked at approximately 34% in the 111th Congress (2009-2010). As of the opening day of the 116th Congress, approximately 24% of the chamber was made up of Representatives with more than 12 years of House service. Still, despite a general increase over time in longer-tenured Members, more than half the House was made up of Members with six or fewer years of chamber experience during each of the last four Congresses.
Senate
Long-term trends in the distribution of Senate service generally mirror those in the House. In contrast to the House, the Senate has generally had a smaller proportion of Members with no prior chamber experience, even during Congress's earlier history. The comparatively smaller proportion of freshman Senators can be explained by the Senate's staggered terms; because only one-third of the chamber's seats are up for election at a time, the amount of turnover resulting from a single election year is limited. As can be seen in Figure 5, for much of congressional history, the single largest group of Senators has been those with six years or fewer spent in the chamber.
For much of the early history of Congress, relatively few Senators served for more than 12 years; this group never exceeded 10% of the chamber until the 50th Congress (1887-1888). However, the percentage in this category grew during the next few Congresses, and despite some fluctuation, generally increased over much of the 20th and (to date) 21st centuries. The 103rd Congress (1993-1994) marks the high point for Senators serving more than 12 years; this group of Senators made up 47% of the chamber. As of the opening day of the 116th Congress, Members in this category make up 26% of the chamber.
Cross-Chamber Experience
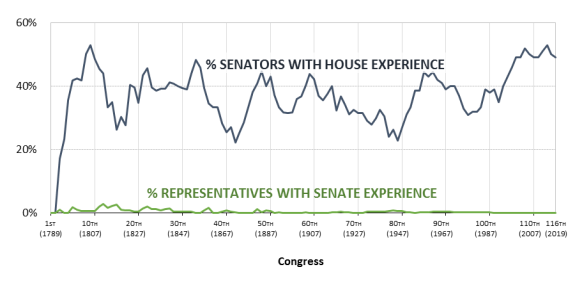
A second issue related to patterns of congressional service is cross-chamber experience of Senators and Representatives. While Senators have infrequently gone on to serve in the House, Representatives who subsequently serve in the Senate have been common throughout U.S. history. Figure 6 plots the percentage of Representatives and Senators with previous experience in the other chamber from the 1st through 116th Congress.
Senators with Prior House Experience
As shown in Figure 6, throughout American history, a sizable proportion of Senators have arrived with prior service in the House, and the proportion has remained within a fairly constant range over time. After Congress's initial formation (when prior experience in one chamber was not possible), the proportion of Senators with House experience fluctuated between 20% and 45% for much of congressional history. In recent history, more than half of Senators serving at the start of the 109th (2005-2006), 113th (2013-2014), and 114th (2015-2016) Congresses had previous House experience. At the start of the 116th Congress, 49 of 100 Senators (49%) had previously served in the House.
Representatives with Prior Senate Experience
Historically, a small but declining number of Members have served in the House of Representatives after serving in the Senate. Figure 6 also plots the percentage of Representatives in each Congress who had previously served in the Senate.
As can be seen in Figure 6, prior to the 1840s, it was common for several Representatives to have previously served in the Senate. This group included such notable figures as Henry Clay, and former President John Quincy Adams. Over time, it became less common for Representatives to have Senate experience. The last Representative to have previously served in the Senate was Claude Pepper, who served in the Senate from 1936 until 1951, and in the House from 1963 until 1989.
Amount of Cross-Chamber Experience
A related question is how much prior House experience, on average, Senators have. Figure 7 plots the average years of House service among Senators, by Congress. The bottom line is the average amount of House service among all Senators who began a given Congress; the top line is the average amount of House service among Senators who previously served in the House.
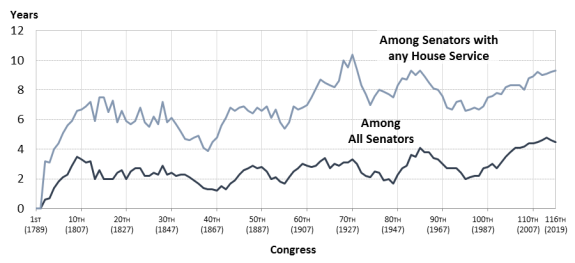
As shown in Figure 7, Senators with prior House experience typically averaged between five and nine years in the House prior to serving in the Senate. In the 116th Congress, the 49 Senators with prior House service spent an average of 9.3 years in the House—just over four-and-one-half terms—prior to serving in the Senate.
Concluding Observations
Aggregate statistics on Member service tenures tend to disguise the variety of congressional service records found among individual Members. Some Members have very short tenures of service and choose not to seek reelection; other Members have long tenures that end after reelection defeat. At the aggregate level, average careers have become longer, but a great deal of variation in the length of congressional careers still persists.
Additionally, the institutional and policy contexts that have shaped Member decisions to seek or not seek reelection, and succeed or fail when seeking reelection, are not static factors. Just as the institutional contexts of elections and congressional operations have developed since the 19th century, they continue to change in the contemporary Congress. To the degree that patterns of congressional service in part reflect the incentives provided to Members by these institutional factors, it is likely that the patterns of Member service tenure will also continue to change. Similarly, the continued development of the institutional environment suggests that there is no way to predict how the patterns of service tenure will change; just as seemingly stable 19th century patterns rapidly changed toward the end of the century, so could the service tenure patterns we observe today.