Introduction
In 2017, approximately 39.7 million people, or 12.3% of the population, had incomes below the official definition of poverty in the United States. The poverty rate (the percentage that were in poverty), fell from 12.7% in 2016, while the number of persons in poverty showed no discernible change.
In this report, the numbers and percentages of those in poverty are based on the Census Bureau's estimates.1 While this official measure is often regarded as a statistical yardstick rather than a complete description of what people and families need to live,2 it does offer a measure of economic hardship faced by the low-income population: the poverty measure compares family income against a dollar amount called a poverty threshold, a level below which the family is considered to be poor. The Census Bureau releases these poverty estimates every September for the prior calendar year. Most of the comparisons discussed in this report are year-to-year comparisons. This report only considers a number or percentage to have changed from the previous year, or to be different from another number or percentage, if the difference has been tested to be statistically significant at the 90-percent confidence level. 3
However, in addition to the most recent year's data, this report presents a historical perspective as well as information on poverty for demographic groups (by family structure, age, race and Hispanic origin, and work status) and by state.
Over the past several decades, criticisms of the official poverty measure have led to the development of an alternative research measure called the Supplemental Poverty Measure (SPM), which the Census Bureau also computes and releases. Statistics comparing the official measure with the SPM are provided at the conclusion of this brief.
The SPM includes the effects of taxes and in-kind benefits (such as housing, energy, and food assistance) on poverty, while the official measure does not. Because some types of tax credits are used to assist the poor, as are other forms of assistance, the SPM may be of interest to policymakers. However, the official measure provides a comparison of the poor population over a longer time period, including some years before many current anti-poverty assistance programs had been developed. In developing poverty-related legislation and conducting oversight on programs that aid the low-income population, policymakers may be interested in these historical trends.
How the Official Poverty Measure Is Computed
The Census Bureau determines a person's poverty status by comparing his or her resources against a measure of need. For the official measure, "resources" is defined as total family income before taxes, and the measure of "need" is a dollar amount called a poverty threshold. There are 48 poverty thresholds that vary by family size and composition. If a person lives with other people to whom he or she is related by birth, marriage, or adoption, the money income from all family members is used to determine his or her poverty status. If a person does not live with any family members, his or her own income is used. Only money income before taxes is used in calculating the official poverty measure, meaning this measure does not treat in-kind benefits such as the Supplemental Nutritional Assistance Program (SNAP, formerly known as food stamps), housing subsidies, or employer-provided benefits as income.
The poverty threshold dollar amounts vary by the size of the family (from one person not living in a family, to nine or more family members living together) and the ages of the family members (how many of the members are children under 18 and whether or not the family head is 65 years of age or older). Collectively, these poverty thresholds are often referred to as the "poverty line." As a rough guide, the poverty line can be thought of as $25,094 for a family of four, $19,515 for a family of three, $15,877 for a family of two, or $12,488 for an individual not living in a family, though the official measure is actually much more detailed.4
The threshold dollar amounts are updated annually for inflation using the Consumer Price Index. Notably, the same thresholds are applied throughout the country: no adjustment is made for geographic variations in living expenses.5
The official poverty measure used in this report is the federal government's definition of poverty for statistical purposes, such as comparing the number or percentage of people in poverty over time. A different definition of poverty, the poverty guidelines published by the Department of Health and Human Services (HHS), is used for administrative purposes such as eligibility criteria for assistance programs and will not be discussed in this report.6
Historical Perspective
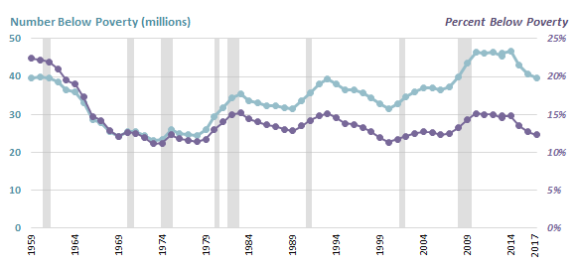
Figure 1 shows a historical perspective of the number and percent of the population below the poverty line. The number in poverty and the poverty rates are shown from the earliest year available (1959) through the most recent year available (2017). Because the total U.S. population has grown over time, poverty rates are useful for historical comparisons because they control for population growth.
Poverty rates fell through the 1960s. Since then, they have generally risen and fallen according to the economic cycle, though during the most recent two expansions poverty rates did not fall measurably until four to six years into the expansion. Historically notable lows occurred in 1973 (11.1%) and 2000 (11.3%).7 Poverty rate peaks occurred in 1983 (15.2%), 1993 (15.1%), and 2010 (15.1%).8
Poverty rates tend to rise during and after recessions, as opposed to leading economic indicators such as new housing construction, whose changes often precede changes in the performance of the overall economy. The poverty rate's lag is explainable in part by the way it is measured: it uses income from the entire calendar year.
Notably, the poverty rate in 2017 registered a third consecutive annual decrease since the most recent recession, though it remained higher than the rate in 2000, the most recent low point.
|
Figure 1. Number of Persons Below Poverty and Poverty Rate, 1959 to 2017 (Poverty rates in percentages, number of persons in millions. Shaded bars indicate recessions.) |
 |
|
Source: Congressional Research Service, based on poverty data from U.S. Census Bureau, Current Population Survey, 1960-2018 Annual Social and Economic Supplements, Historical Poverty Table 2, http://www2.census.gov/programs-surveys/cps/tables/time-series/historical-poverty-people/hstpov2.xls, downloaded October 9, 2018. Recession dates obtained from National Bureau of Economic Research, http://www.nber.org/cycles/cyclesmain.html. Notes: Two estimates are shown for 2013 because the Census Bureau implemented a change to the CPS ASEC income questions. This change was partially implemented with the 2013 data and fully implemented for the 2014 data. For 2013, some households received the old questionnaire and others the new, so that it would be possible to see the effect of changing the questionnaire, and possible to make consistent comparisons both before and after 2013. |
Poverty for Demographic Groups9
The drop in the U.S. poverty rate (from 12.7% in 2016 to 12.3% in 2017) affected some demographic groups more than others, notably the population ages 18 to 64, people of Hispanic origin, and part-time workers; it was not a broad-based decline. Details for selected demographic groups are described below.
Family Structure
Because poverty status is determined at the family level by comparing resources against a measure of need, vulnerability to poverty may differ among families of different compositions. In this section, poverty data by family structure are presented using the official poverty measure, along with a definition of "family" that the Census Bureau has used in the CPS ASEC for nearly four decades.10 In the "Supplemental Poverty Measure" section of this report, a different definition will be used.
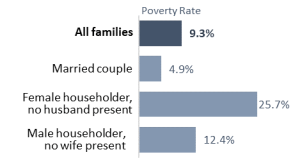
Families with a female householder and no husband present (female-householder families) have historically had higher poverty rates than both married-couple families and families with a male householder and no wife present (male-householder families). This remained true in 2017: female-householder families experienced a poverty rate of 25.7%, compared with 4.9% for married-couple families and 12.4% for male-householder families. None of these groups registered a significant decrease from 2016, although families as a whole (i.e., all family types together) did—from 9.8% in 2016 to 9.3% in 2017, a drop of 0.4 percentage points after rounding).
Among individuals not living in families, the poverty rate was 20.7% in 2017, not distinguishable from the previous year. Poverty rates of families in 2017 are shown in Figure 2.
|
Figure 2. Poverty Rates of Families by Family Structure: 2017 (Poverty rates in percentages) |
 |
|
Source: Congressional Research Service, using data from U.S. Census Bureau, Current Population Survey, 2018 Annual Social and Economic Supplement, https://www2.census.gov/programs-surveys/demo/tables/p60/263/pov_table4.xls, downloaded October 10, 2018. Notes: The poverty rates above include only families with a householder (the survey's reference person for the household, typically the person in whose name the home is owned or rented). The Census Bureau defines a family as those living together related by birth, marriage, or adoption. Not included above are cohabiting couples, people living alone or with non-relatives, people related to each other but not to the householder, and legally married same-sex couples. The Census Bureau is changing the CPS ASEC data processing to measure same-sex married couples. For details, see https://www.census.gov/topics/families/same-sex-couples/library/working-papers.2018.html. For an overview of the effects of the proposed changes on poverty statistics, see Ashley Edwards, "The Presence and Impact of Same-Sex Married Couples on Poverty Rates in the Current Population Survey," U.S. Census Bureau, https://www.census.gov/content/dam/Census/library/working-papers/2017/demo/SEHSD-WP2017-25.pdf. |
Age
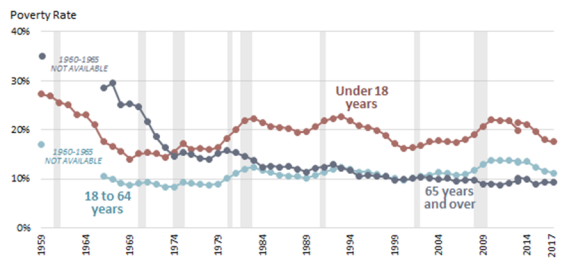
When examining poverty by age, three main groups are noteworthy for distinct reasons: under 18, 18 to 64, and 65 and older. People under age 18 are typically dependent on other family members for income, particularly young children below their state's legal working age. People ages 18 to 64 are generally thought of as the working-age population and typically have wages and salaries as their greatest source of income. People 65 years and older, referred to as the aged population, are often eligible for retirement, and those who do retire typically experience a change in their primary source of income.
For the working-age population, the poverty rate, but not the number of persons in poverty (22.2 million), registered a decline.11 In 2017, 11.2% of the working-age population was in poverty (down from 11.6% in 2016). Neither children nor the aged registered any significant changes in their poverty rate or number in poverty from 2016. Among children, 12.8 million (or 17.5%) were poor; among the aged population, 4.7 million (or 9.2%) were poor.
From a historical standpoint, the poverty rate for those 65 and over used to be the highest of the three groups. In 1966, the aged had a poverty rate of 28.5%, compared with 17.6% for those under 18 and 10.5% for working-age adults. By 1974, the poverty rate for people 65 and over had fallen to 14.6%, compared with 15.4% for people under 18 and 8.3% for working-age adults. Since then, people under 18 have had the highest poverty rate of the three age groups, as shown in Figure 3.
|
Figure 3. Poverty Rates by Age: 1959 to 2017 (Poverty rates in percentages. Shaded bars indicate recessions.) |
 |
|
Source: Congressional Research Service, using data from U.S. Census Bureau, Current Population Survey, 1960-2018 Annual Social and Economic Supplements, Historical Poverty Table 3, http://www2.census.gov/programs-surveys/cps/tables/time-series/historical-poverty-people/hstpov3.xls, downloaded October 10, 2018. Recession dates obtained from National Bureau of Economic Research, http://www.nber.org/cycles/cyclesmain.html. Notes: Data are not available from 1960 to 1965 for persons age 65 and older and for persons age 18 to 64. For each group, two estimates are shown for 2013 because the Census Bureau implemented a change to the CPS ASEC income questions. This change was partially implemented with the 2013 data, and fully implemented for the 2014 data. For 2013, some households received the old questionnaire and others the new, so that it would be possible to see the effect of changing the questionnaire, and possible to make consistent comparisons both before and after 2013. |
Race and Hispanic Origin12
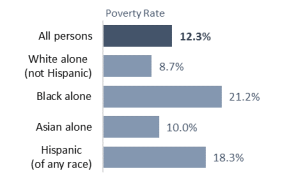
Poverty rates vary by race and Hispanic origin, as shown in Figure 4. In surveys, Hispanic origin is asked separately from race; accordingly, people identifying as Hispanic may be of any race. The poverty rate fell for Hispanics (from 19.4% in 2016 to 18.3% in 2017). Among blacks13 (21.2%), Asians14 (10.0%), and non-Hispanic whites (8.7%), the poverty rate did not change discernably from 2016.15
|
Figure 4. Poverty Rates by Race and Hispanic Origin: 2017 (Poverty rates in percentages) |
 |
|
Source: Congressional Research Service, using data from U.S. Census Bureau, Current Population Survey, 2018 Annual Social and Economic Supplement, https://www2.census.gov/programs-surveys/demo/tables/p60/263/pov_table3.xls, downloaded October 10, 2018. Notes: People of Hispanic origin may be of any race. Additionally, respondents may identify with one or more racial groups. Except for "All persons" and "Hispanic," the remaining groups shown include those who identified with one race only. Data for Native Hawaiians and Other Pacific Islanders, American Indians and Alaska Natives, and the population of two or more races are not shown separately. |
Work Status
While having a job reduced the likelihood of being in poverty, it did not guarantee that a person or his or her family would avoid poverty. Among the 18 to 64 year old population living in poverty, 36.6% had jobs in 2017. However, workers were less likely to be in poverty in 2017 (5.3%) than they were the year before (5.8%). Among full-time year-round workers, 2.2% were poor in 2017, not measurably changed from the previous year. Among part-time or part-year workers, 13.4% were poor, down from 14.7% in 2016. No change was detected among those who did not work at least one week in 2017 (30.7% were poor).
Because poverty is a family-based measure, the change in one member's work status can affect the poverty status of his or her entire family. Among all 18 to 64 year olds who did not have jobs in 2017, 58.1% lived in families in which someone else did have a job.16 Among poor 18 to 64 year olds without jobs, 19.1% lived in families where someone else worked.17
Poverty Rates by State18
Poverty is not equally prevalent in all parts of the country. The map in Figure 5 shows states with relatively high poverty rates across parts of the Appalachians, the deep South, and the Southwest, with the poverty rate in Mississippi (19.8%) among the highest in the nation, and not statistically different from the rates in New Mexico (19.7%), Louisiana (19.7%), and West Virginia (19.1%). The poverty rate in New Hampshire (7.7%) was lowest. When comparing poverty rates geographically, it is important to remember that the official poverty thresholds are not adjusted for geographic variations in the cost of living—the same thresholds are used nationwide. As such, an area with a lower cost of living accompanied by lower wages will appear to have a higher poverty rate than an area with a higher cost of living and higher wages, even if individuals' purchasing power were exactly the same in both areas.
The District of Columbia and 20 states experienced poverty rate declines from 2016 to 2017: six in the Midwest (Illinois, Indiana, Iowa, Michigan, Missouri, and Ohio), three in the Northeast (Maine, New York, and Pennsylvania); eight in the South (District of Columbia, Florida, Georgia, Kentucky, Mississippi, North Carolina, Tennessee, and Texas); and four in the West (Arizona, California, Colorado, and Idaho).19 Delaware and West Virginia were the only states to experience increases, and 28 states, as well as Puerto Rico, experienced no significant change.
|
Figure 5. Percentage of People in Poverty in the Past 12 Months by State, the District of Columbia, and Puerto Rico: 2017 (Poverty rates in percentages) |
 |
|
Source: Congressional Research Service, based on poverty data from Alemayehu Bishaw and Craig Benson, Poverty: 2016 and 2017, U.S. Census Bureau, American Community Survey Brief ACSBR/17-02, Table 1, issued September 2018, using 2017 American Community Survey (ACS) and 2017 Puerto Rico Community Survey, https://www.census.gov/library/publications/2018/acs/acsbr17-02.html. Notes: Data by state are based on the ACS, while national-level data presented elsewhere in this report are based on the Current Population Survey Annual Social and Economic Supplement (CPS ASEC). The ACS reported a poverty rate of 13.4% for the United States in 2017, compared with 12.3% in the CPS ASEC. See footnote 18 for further details. |
Supplemental Poverty Measure
Criticisms of the official measure have led to the development of the Supplemental Poverty Measure (SPM). Described below are the development of the official measure, its limitations, attempts to remedy those limitations, the research efforts that led to the SPM, and a comparison of poverty rates based on the SPM and the official measure.20
How the Official Poverty Measure Was Developed
The poverty thresholds were originally developed in the early 1960s by Mollie Orshansky of the Social Security Administration. Rather than attempt to compute a family budget by using prices for all essential items that low-income families need to live, Orshansky focused on food costs.21 Unlike other goods and services such as housing or transportation, which did not have a generally agreed-upon level of adequacy, minimum standards for nutrition were known and widely accepted. According to a 1955 U.S. Department of Agriculture (USDA) food consumption survey, the average amount of their income that families spent on food was roughly one-third. Therefore, using the cost of a minimum food budget and multiplying that figure by three yielded a figure for total family income. That computation was possible because USDA had already published recommended food budgets as a way to address the nutritional needs of families experiencing economic stress. Some additional adjustments were made to derive poverty thresholds for two-person families and individuals not living in families to reflect the relatively higher fixed costs of smaller households.
Motivation for a Supplemental Measure
While the official poverty measure has been used for over 50 years as the source of official statistics on poverty in the United States, it has received criticism over the years for several reasons. First, it does not take into account benefits from most of the largest programs that aid the low-income population. For instance, it uses money income before taxes – meaning that it does not necessarily measure the income available for individuals to spend, which for most people is after-tax income. Therefore, any effects of tax credits designed to assist persons with low income are not captured by the official measure. The focus on money income also does not account for in-kind benefit programs designed to help the poor, such as SNAP or housing assistance.
The official measure has also been criticized for the way it characterizes families' and individuals' needs in the poverty thresholds. That is, the method used to compute the dollar amounts used in the thresholds, which were originally based on food expenditures in the 1950s and food costs in the 1960s, do not accurately reflect current needs and available goods and services.22 Moreover, the official measure does not take account of the sharing of expenses and income among household members not related by birth, marriage, or adoption. And, as mentioned earlier, the official thresholds do not take account of geographic variations in the cost of living.
In 1995, a panel from the National Academy of Sciences issued a report, Measuring Poverty: A New Approach, which recommended improvements to the poverty measure.23 Among the suggested improvements were to have the poverty thresholds reflect the costs of food, clothing, shelter, utilities, and a little bit extra to allow for miscellaneous needs; to broaden the definition of "family;" to include geographic adjustments as part of the measure's computation; to include the out-of-pocket costs of medical expenses in the measure's computation; and to subtract work-related expenses from income. An overarching goal of the recommendations was to make the poverty measure more closely aligned with the real-life needs and available resources of the low-income population, as well as the changes that have taken place over time in their circumstances, owing to changes in the nation's economy, society, and public policies (see Table 1).
After over a decade and a half of research to implement and refine the methodology suggested by the panel, conducted both from within the Census Bureau as well as from other federal agencies and the academic community, the Census Bureau issued the first report using the Supplemental Poverty Measure (SPM) in November 2011.24
|
Official Poverty Measure |
Supplemental Poverty Measure |
||
|
Resource units ("families") |
People related by birth, marriage, or adoption (official Census Bureau definition of "family"). People age 15 and older not related to anyone else in the household are considered as their own economic units. |
People related by birth, marriage, adoption, plus unrelated and foster children, and cohabiting partners and their children or other relatives (if any) are considered as "SPM resource units" (sharing resources and expenses together). |
|
|
Needs (thresholds) |
|
|
|
|
Resources |
Money income before taxes (includes 18 private and government sources of income, including Social Security, cash assistance, and other sources of cash income). |
Money income (both private and government sources) after taxes ...
|
Source: Congressional Research Service summary of methodological discussion in Liana Fox, The Supplemental Poverty Measure: 2017, U.S. Census Bureau, September 2017, http://www.census.gov/content/dam/Census/library/publications/2016/demo/p60-265.pdf.
Notes: For caveats, see the text of the section, "Supplemental Poverty Measure."
Official and Supplemental Poverty Findings for 201725
Compared with the official measure, the SPM takes into account greater detail of individuals' and families' living arrangements and provides a more up-to-date accounting of the costs and resources available to them. Because the SPM recognizes greater detail in relationships among household members and geographically adjusts housing costs, it provides an updated rendering, compared with the official measure, of the circumstances in which the poor live. In that context, some point out that the SPM's measurement of taxes, transfers, and expenses may offer policymakers a clearer view of how government policies affect the poor population today. However, the SPM was developed as a research measure, and the Office of Management and Budget set the expectation that it would be revised periodically to incorporate improved measurement methods and newer sources of data as they became available; it was not developed for administrative purposes. Conversely, the official measure's consistency over a longer time span makes it easier for policymakers and researchers to make historical comparisons.
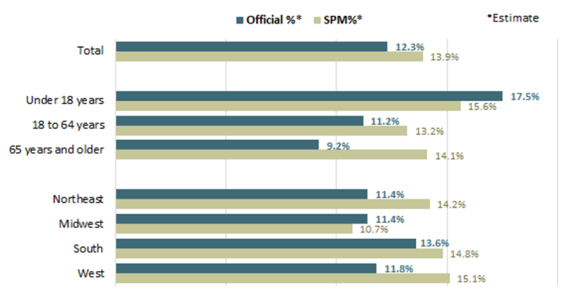
Under the SPM, the profile of the poverty population is slightly different than under the official measure. After rounding, the SPM was about 1.6 percentage points higher in 2017 than the official poverty rate (13.9% compared with 12.3%, a figure that includes foster children under age 15, who are not normally included in the official measure. See Figure 6). More people ages 18 to 64 are in poverty under the SPM (13.2% compared with 11.2% under the 2017 official measure), as are people ages 65 and over (14.1%, compared with 9.2% under the official measure). The poverty rate for people under age 18 was lower under the SPM (15.6% in 2017) than under the official measure (17.5%, with foster children included). Again, the SPM uses a different definition of resources than the official measure: the SPM includes in-kind benefits which generally help families with children; subtracts out work-related expenses, which are often incurred by the working-age population; and subtracts medical out-of-pocket expenses, which are incurred frequently by people age 65 and older.
|
Figure 6. Poverty Rates Under Official Measure and Supplemental Poverty Measure, for the U.S. Total Population, by Age and by Region: 2017 (Poverty rates in percentages) |
 |
|
Source: Congressional Research Service, based on data from Liana Fox, The Supplemental Poverty Measure: 2017, U.S. Census Bureau, September 2018, https://www.census.gov/library/publications/2018/demo/p60-265.html. Notes: Figures include unrelated individuals under age 15 (such as foster children), who are not usually included in official poverty estimates. |
With the geographically-adjusted thresholds, the poverty rate in 2017 was lower under the SPM than under the official measure for the Midwest (10.7% compared with 11.4%), while it was higher than the official measure for the Northeast (14.2% compared with 11.4%), the West (15.1% compared with 11.8%), and the South (14.8% compared with 13.6%).