Introduction: An Overview of Natural Gas Liquids
The shale revolution, as it is commonly referred to, has seen U.S. production of hydrocarbons rise significantly over the last 10 years. U.S. natural gas production has risen 33% since 2008, and crude oil production has jumped 87%. Both commodities are also being exported in growing quantities. In between natural gas and crude oil is a group of hydrocarbons referred to as natural gas liquids (NGLs).1 NGLs, which make up about 4% of the U.S. energy mix, include ethane, propane, butane, isobutane, and pentanes (which includes natural gasoline). The United States is the largest producer of NGLs in the world. NGLs are differentiated from one another by the number of carbon atoms in their molecular chain.
Natural gas liquids are extracted as a mixture of hydrocarbons and other gases and are produced and separated from one of two sources: natural gas processing or crude oil refining. (See Appendix for additional information.) Mainly due to the shale revolution, which uses horizontal drilling and hydraulic fracturing, NGL production in the United States has grown at a rapid rate since 2008.
This report focuses on NGLs and not the various petrochemical products, like plastics or fertilizer, they can create. However, the report aims to give a general overview of the use, production, price trends, exports/imports, and infrastructure needs for processing and transporting NGLs, as well as policy issues.
|
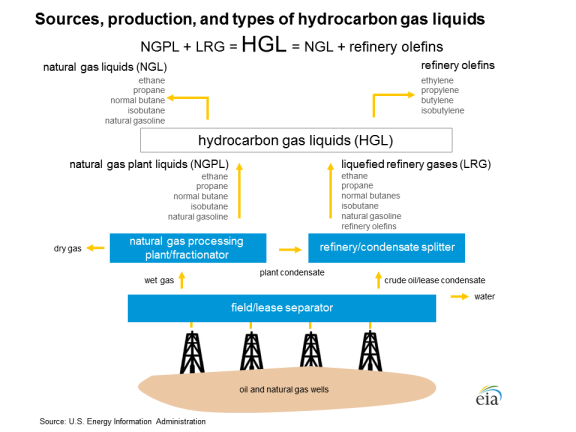
Demystifying the Acronyms It is essential to differentiate NGLs, the focus of this report, from similar categories and acronyms to avoid any potential confusion. Hydrocarbon gas liquids (HGLs), as defined by the U.S. Energy Information Administration (EIA), refer to a broader category of hydrocarbon liquids that includes the five NGLs as well as additional petrochemicals that can be made from crude oil at refineries (through a process known as olefin cracking): ethylene, propylene, butylene, and isobutylene. EIA uses the acronym HGLs in place of NGLs because it encompasses both midstream and downstream marketed gas liquids. An unrelated term, liquefied natural gas (LNG), is natural gas (mainly methane) that has been cooled to -260°F at atmospheric pressure, causing it to liquefy. The state change—from gaseous to liquid—primarily allows for the economical transportation of natural gas via specially designed ships. LNG is not an NGL. A final acronym, liquefied petroleum gases (LPGs), is, in turn, a subset of NGLs. LPGs are typically a hydrocarbon mix of propane, butane, and isobutane (EIA has included ethane and olefin refinery products in this category prior to January 2014). LPG is often bottled and sold as "propane" for use in vehicles, grills, and other appliances. |
NGLs: What's Included?
Ethane (C2H6) is the simplest of all the NGL hydrocarbons. With only two carbon atoms in its molecular makeup, it is the lightest NGL, the hardest to liquefy, and the one with the lowest heat content (as measured in British thermal units or Btus). Due to the difficulty of liquefying ethane compared to the other NGLs, it is the most energy intensive and expensive to separate from raw gas streams and to store and transport after recovery.2 The vast majority of ethane produced in the United States is sent to domestic petrochemical companies to make ethylene, a building block for a variety of products like plastic bottles, trash bags, antifreeze, PVC piping, and detergent. Between 2010 (as far back as the EIA data set goes) and 2017, there has been a more than 35% increase in domestic consumption of ethane.3 Meanwhile, U.S. production of ethane has more than doubled. The rise in ethane production has put downward pressure on its price and has prompted companies to export ethane.
Propane (C3H8) is the second-simplest NGL hydrocarbon, with three carbon atoms. It has a much higher boiling point than ethane (-128 degrees Fahrenheit for ethane compared to -44 degrees Fahrenheit for propane). Like ethane, it is typically stored in canisters at high pressure, so it can be transported as a liquid. This pressure is about one-quarter of what it takes to liquefy ethane at a similar temperature.4 As a result, it is far less energy intensive to pressurize propane to a sufficient degree for it to be liquefied than it is for ethane, making it more desirable as a portable fuel.5 Propane is used as a feedstock at petrochemical plants, and it can also be converted into polypropylene, which is used in injection moldings and to create resins, plastics, and some adhesives.6 It is also used in residential and commercial heating, and is therefore highly seasonal in its demand. Propane production has increased by almost 150% since 2008, and of all the NGL- derives the largest percentage of its production from oil refining (roughly 20%). Propane has been exported for years (as propane and as a component of liquefied petroleum gas or LPG); the relatively low cost of U.S. propane in recent years has driven substantial international demand, especially from Asia.
Normal Butane (C4H10), or just butane, is the first of the two forms of the four-carbon NGL hydrocarbons. Butane has a significantly higher boiling point (30 degrees Fahrenheit) than either propane or ethane, but it is still a gas at room temperature and standard pressure. Normal butane has two primary uses: as a fuel additive in motor gasoline (usually during colder months) and as a petrochemical feedstock. The critical petrochemical product that can be made from processing butane is butadiene, a key component in synthetic rubber. Butane production has more than doubled since 2008, while consumption and growth have been sporadic, rising in some years and declining in others. The relative surge in production has corresponded with an increase in exports as well. Butane, like propane, is an LPG component and exported in that form as well. Butane prices tend to be linked to oil prices because of its use as a gasoline additive.
Isobutane (C4H10), by molecular makeup, is identical to butane with four carbon atoms. The atoms, however, are arranged in a different shape than in butane, giving it slightly different properties, such as a different vapor pressure and boiling point. The majority of isobutane (60%) is used in a refinery process called alkylation, which converts it into alkylate. Alkylate is an ingredient of high-octane low-vapor-pressure motor gasoline. Other uses of isobutane include as a fuel for lighters and camping stoves, a replacement for Freon in refrigerators, and a propellant in hair and cooking sprays. Isobutane makes up one of the smallest percentages of total NGL growth, due mostly to its relatively small contribution to the total makeup of NGLs. However, like the other NGLs, it has experienced a sharp uptick in production over the last decade. Consumption of isobutane is also rising. The United States is a net importer of isobutane, mainly from Canada. Isobutane prices tend to follow butane prices, but at a premium because of the additional processing required to create it.
Pentanes (C5H12), also referred to as natural gasoline, are perhaps the most unique NGL. They are a mixture of different hydrocarbons with five or sometimes six carbon atoms. Most pentanes are used as a blending fuel in oil refineries to make motor gasoline. They are also used as a petrochemical feedstock, as a denaturant in ethanol to make it undrinkable, and as a diluent for heavy crude (the fastest-growing source of demand).7 Other NGLs have pushed pentane demand lower as a petrochemical feedstock. Pentanes production has grown, but not as much as other NGLs. Most exports of pentanes go to Canada, where their demand as a diluent is high. The price of pentanes tends to track gasoline and crude oil prices.
The NGL Energy Chain
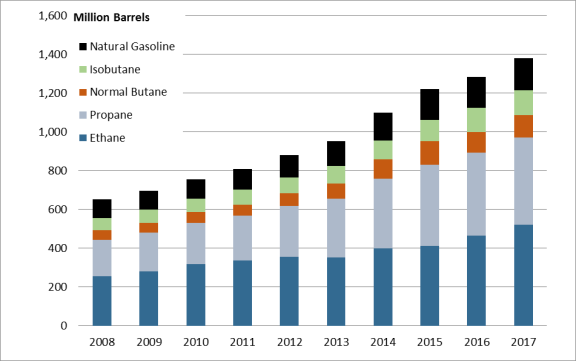
The United States is the world's largest producer of NGLs. In 2008, U.S. production of NGLs was 653 million barrels, and in 2017 it was 1,381 million barrels, more than doubling in 10 years.8 As U.S. production of NGLs rises, a subsequent build-out of the necessary infrastructure to process and transport the products downstream is similarly increasing—albeit somewhat delayed. The distance, cost, and ease of taking NGL products to market can have a significant effect on their market prices and demand.
Specific areas of the country, for example Texas, benefit from a long history of hydrocarbon extraction and processing. (See Figure 1.) These regions, mostly located on the Gulf Coast, can take advantage of already existing pipelines, refineries, processing plants, and petrochemical processing sites. Other areas of the country, like the Appalachian region, Kansas, and North Dakota, have had difficulty adding infrastructure to match their growing output of NGLs.
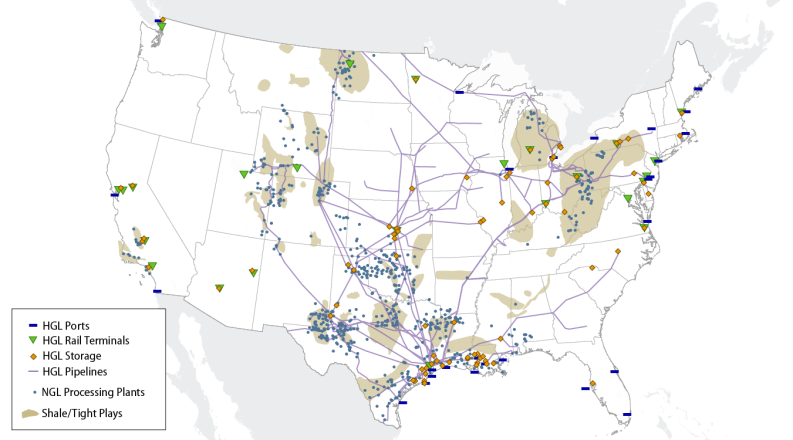
In areas of the country, like Pennsylvania, where the construction of pipelines is lagging behind the increasing production of NGLs, the use of more expensive methods of transportation (e.g., rail cars) has become necessary, driving up costs. A Department of Energy (DOE) report on NGLs in the Appalachian region also pointed out that states like Pennsylvania are strongly reliant on storage outside of their region.9
Sources of Production
Most of the increase in NGL production has come from tight shale natural gas formations, some of which have high concentrations of NGLs. In 2008, the distribution by state of NGL production began to shift from the Gulf Coast region toward higher levels of output from the Bakken, Marcellus, and Utica shale formations of the Midwest and Northeast. The output from the Northeast has grown by over 2,200% since 2008 to make up over 11% of all U.S. NGL production in 2017 (it made up 1% in 2008). The Gulf Coast states, however, still comprise 54% of total U.S. NGL production.10
The vast majority of the growth in NGL production has been driven primarily by increases in ethane and propane production. The prominence of ethane and propane is due to the substantial portion they make up of NGLs. In 2017, 70% of all NGLs produced were either ethane or propane (see Figure 2).11
|
2008-2017 |
 |
|
Source: U.S. Energy Information Administration, Petroleum and Other Liquids: Supply and Disposition, https://www.eia.gov/dnav/pet/pet_sum_snd_d_nus_mbbl_m_cur.htm. |
To understand and accurately discuss the full well-to-market lifespan of natural gas liquids, it is useful to start with natural gas as a foundation. Although NGLs may be obtained from both natural gas processing and crude oil refining, they come predominantly from the former—with over 90% of all U.S. NGL production coming from natural gas processing. This makeup varies based on each hydrocarbon, but none derive more than 20% of their total production from crude oil.
Natural gas itself is composed of almost entirely methane (C1), the simplest of all hydrocarbons, and can come from both natural gas and crude oil wells. When it is produced from an oil well, it is referred to as associated natural gas. There is no chemical distinction between associated gas and natural gas coming from a gas well. Over 99% of all EIA-documented wells produced both oil and natural gas.12
Natural gas, when extracted from a wellhead, contains methane, a variety of other hydrocarbons (most of them NGLs), and various impurities including hydrogen sulfide and water. This mixture of chemicals is referred to as "raw gas," and it can come from both conventional wells and shale wells. When the raw gas has a high concentration of NGLs, it is described as being "wet." (See textbox.)
|
Wet vs. Dry Gas The terms wet and dry gas are used to describe the concentration of NGLs in a natural gas stream. There is no definitive rule on what is wet gas and what is dry, but generally, natural gas with less than 2 GPM (gallons per thousand cubic feet (Mcf)) of NGLs is considered dry, and anything more than that is considered to be in the wet range. For reference, the Barnett formation, with a typical GPM of 2.5-3.5, is considered to be relatively dry/wet range, especially when compared to the Bakken and Utica formations that have concentrations of 6-12 and 4-9 GPM, respectively.13 |
As of 2016, 33 states had at least one natural gas well. Moreover, in that same year, there were over 2 million active natural gas wells in the United States.14 Texas had the most natural gas wells, with over 500,000 active sites. Pennsylvania, due mainly to the burgeoning Marcellus and Utica shale formations, had the second most, at over 300,000.15
Separating the Hydrocarbons
In order to bring pure NGLs to market, they are first separated from the raw natural gas stream, and then a process called "fractionation" isolates the NGLs based on their boiling point.16 The resulting mix of NGLs and other hydrocarbons (known as a "y-grade mix" or "raw mix") is then further separated into individual product streams.
The separation of NGLs from the raw gas stream occurs after impurities have been removed. When raw gas is initially extracted from a wellhead, it can contain varying degrees of impurities that may include water vapor, carbon dioxide, hydrogen sulfide, nitrogen, oxygen, helium, and particulate matter. These impurities must be removed from natural gas before it can be pressurized and transported in long-distance pipelines that will carry it to market. If too many impurities are present in the gas stream, they can cause compressors to malfunction and pipes to corrode, rupture, or even explode.
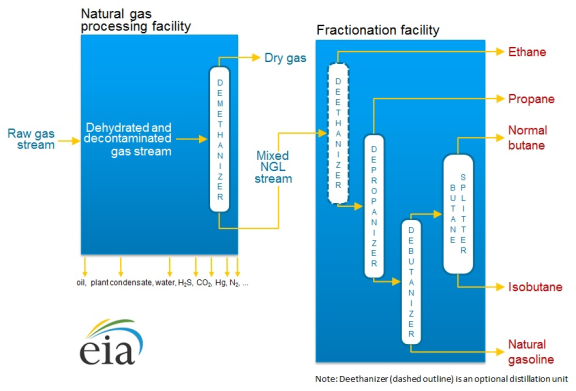
To remove these impurities, raw gas streams are sent by pipeline to treatment plants (see Figure 3). From there, the cleaned raw gas mixture is sent to a natural gas processing plant. In these plants the inlet-gas stream is cooled to the point where the NGLs in the stream condense into a liquid and separate out of the gas.
|
Types of Natural Gas Processing There are three primary methods to cool off an inlet gas stream during natural gas processing: absorption, refrigeration, and cryogenic turbo-expansion. Of these, cryogenic turbo-expansion is the most prevalent, with 68% of plants using this method, followed by refrigeration at 20%, and absorption at 1%. The remainder use refrigeration in combination with either absorption or cryogenic turbo-expansion. The average sized, 200-300 million cubic feet of gas per day, processing plant in use in West Texas costs around $150-$300 million in initial investment.17 Absorption is the oldest and least efficient method of separating NGLs from natural gas streams. Consequently, very few processing plants use this method. As the name suggests, the process absorbs NGLs from a natural gas stream by using a thin oil that can soak up NGLs in the stream. The oil is then heated to distill off the NGLs and then recycled for further use. Refrigeration cools off a natural gas stream to -30°F, where the NGLs in the mixture condense into a liquid, falling out of the natural gas stream. This process can recover up to 40% of ethane, 70% of propane, and nearly all butane and natural gasoline. Cryogenic turbo-expansion is the newest, most efficient, and most prevalent method of natural gas processing. In this method, a raw gas stream is sent through a turbine which expands the gas stream and cools it off to -120°F. This style of processing plant can recover 85%-95% of ethane and nearly all of the other NGLs. It is, however, the most energy- and capital-intensive process.18 |
Once the inlet stream has been sent through the processing plant, there are two distinct outlet streams that are handled separately. The first stream consists of mainly natural gas and is sometimes referred to as either residue or tailgate gas. That stream will then typically be moved via pipeline to market. The second stream is mostly made up of NGLs (i.e., a y-grade mix). This outlet stream is typically then sent to a fractionator site to be broken up into its individual hydrocarbons.
Longer chain hydrocarbons (i.e., those with more carbon atoms) tend to have higher vaporization temperatures. Given this difference, fractionator sites increase the temperature of the y-grade mixture at incremental levels to vaporize one specific hydrocarbon at a time. First, the y-grade mix is sent to a deethanizer where ethane is boiled out of the mixture and is allowed to flow out through the top of a container, as a gas, to a new storage tank where it is cooled, condensed, and stored. This process repeatedly occurs until all the NGLs have been separated from one another.
 |
|
Source: U.S. Energy Information Administration, Hydrocarbon Gas Liquids (HGL): Recent Market Trends and Issues, November 25, 2014, https://www.eia.gov/analysis/hgl/. Note: The chemical representations and elements above include, hydrogen sulfide (H2S), carbon dioxide (CO2), Mercury (Hg), and nitrogen (N2). |
Petrochemical Processing Plants
Petrochemical processing plants are facilities set up to "crack" hydrocarbons: an essential part of the well-to-market-process for NGLs. At these facilities, hot steam is used to break carbon-to-carbon bonds in hydrocarbon molecules, mainly ethane, to form shorter-chained alkene molecules that can be used for a variety of downstream processes.
Transportation Infrastructure
The rapid growth of NGL production has outpaced the development of supporting infrastructure. NGLs are expensive to transport and handle—requiring high pressures and low temperatures to keep them in a liquid state for shipment. A network of processing plants, fractionation sites, petrochemical olefin crackers, and distribution methods is necessary to move NGLs from production to their markets. Moreover, the surplus of NGLs brought about by domestic production growth is increasing the need for infrastructure to aid in exporting of NGLs and the storage of NGLs domestically.
There are multiple ways to transport NGLs across the country, but pipelines are the most common. The cost of shipping via trucks, barges, or by rail tends to be high compared to pipelines. In 2017, based on EIA shipment data, over 90% of all NGLs, by volume, were transported by pipeline.19
Estimates for total U.S. pipeline capacity are difficult to ascertain with any certainty. Pipelines tend to change products and operating status regularly, and so the numbers will fluctuate. Based on an industry database, there are roughly 54,000 miles of documented NGL pipelines in the United States. A little over 6,600 of those miles are for direct "purity" products, that is, the five hydrocarbons that make up the NGL grouping. The other roughly 47,000 miles of pipeline are for downstream products, like petrochemicals and fuel mixes. These pipelines, for both cases, are heavily centered in Texas and then spread out over the rest of the country.20 Moreover, while shipping is predominantly via pipeline, there is one notable exception. The West Coast and the area west of the Rockies are deficient of distribution pipelines. These areas use barges and tankers for movements around the region.
Storage
As NGL production rises, companies are facing increasing shortfalls in transportation and storage capacity. Some regions, like the Kansas-Oklahoma production area, are extracting more hydrocarbons than they can transport and therefore are having to build out their storage capacities. Another reason to build out storage capabilities is to handle fluctuating demand patterns. Propane demand, for example, peaks in the winter while falling off in the summer. Since production levels rarely fluctuate throughout the year, companies may find it advantageous to build inventories in the summer for shipment out in the winter. Another reason companies may choose to increase storage capabilities is to hold short-term supplies for iterative shipping methods such as barges and railcars, which can only transport certain amounts of NGLs at one time, necessitating onsite storage.
Propane, normal butane, isobutane, and natural gasoline can all be stored with relative ease in aboveground storage tanks as pressurized liquids. It is possible to store ethane aboveground in steel storage tanks, but it is far more expensive and energy intensive.
Aboveground storage tanks are typically used for short-term storage before the delivery of these products, like propane, to consumers. For long-term storage, it is more economical for companies to pursue underground storage in bored out geological formations.
Primarily salt formations (occasionally shale, granite, and limestone can be used) are bored out to form a hollow cavern where the NGLs can be stored. Regions with suitable geology for these formations are typically located in the South and the Southeast (particularly on the Gulf Coast). Areas whose geology is predominately characterized by shale, such as the Northeast, typically rely on aboveground tanks as their primary source of storage since shale is generally not ideal for underground storage.21
As of 2012, the EIA identified 28 "large" storage facilities (>5 million barrel capacity) which were all underground storage, 20 "mid-sized" facilities (>1 million barrel capacity) which were mainly underground storage, and 47 "smaller" storage facilities (0.3-1.0 million barrel capacity) which were a combination of above- and below-ground storage. Most midsized and smaller-sized facilities, according to the EIA, are colocated with aboveground storage or are near processing plants, fractionators, ports, rail terminals, and in-transit pipeline stocks.22
The two largest storage facilities in the United States correspond with two of the country's main market hubs: Mont Belvieu, TX, and Conway, KS.23
Economics
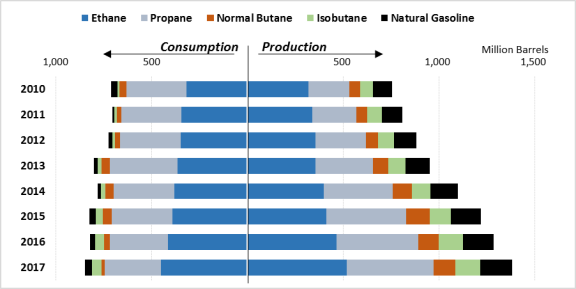
The United States is by far the largest producer of NGLs in the world. As of 2017, the United States accounted for over one-third of global NGL production.24 Moreover, in the same year, the next-largest producer, Saudi Arabia, had a production rate that was just over half that of the United States. Supply has outstripped demand so quickly in the United States that companies have begun to export NGLs at increasing rates (see Figure 4 and Figure 6). The second change due to increasing domestic production is a dramatic increase in the global competitiveness of U.S. petrochemical companies.
|
Figure 4. U.S. Production and Consumption of NGLs 2010-2017 |
 |
|
Source: U.S. Energy Information Administration, Petroleum and Other Liquids: Supply and Disposition, and Product Supplied, https://www.eia.gov/petroleum/data.php. Notes: EIA data for NGL consumption begins in 2010 for most NGLs. |
As production rates of NGLs, particularly ethane, have risen in recent years, their prices have fallen. These lower prices make them a very competitive feedstock for petrochemical companies to make products like plastic. U.S. companies tend to have petrochemical plants outfitted for using ethane and other NGLs while global competitors tend to have plants designed to use heavier hydrocarbons that are more expensive as a petrochemical feedstock (e.g., naphtha, which is derived from oil and therefore linked to oil prices). This price disparity has made U.S.-produced petrochemicals more competitive on a global stage, fueling an increase in their production and exportation.25
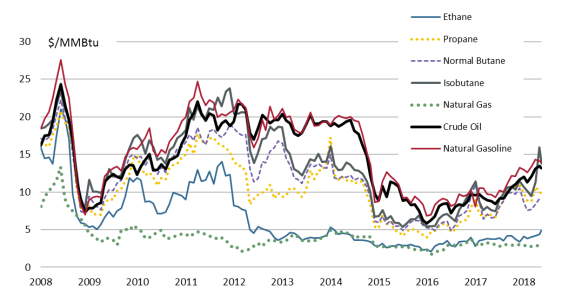
Pricing
Since 2008, prices of individual NGLs have diverged away from natural gas (see Figure 5). The higher prices for NGLs, as compared to natural gas, have created markets that are separate from natural gas. Furthermore, the rising value of NGLs is driving the focus of natural gas production away from the Gulf Coast to tighter shale formations in the Midwest and Northeast that have more NGLs. As the industry makes technological improvements in extraction, production costs have declined and NGL production has increased.
|
Compared to Crude Oil and Natural Gas Prices |
 |
|
Source: Bloomberg. Notes: Unit = U.S. dollars per British thermal unit ($/MMBtu). |
Historically, U.S. NGL prices have fluctuated between the U.S. natural gas benchmark price (known as the Henry Hub price) and the international crude oil benchmark price (known as Brent) on a dollar-per-million British thermal unit (MMBtu) basis. Typically, however, natural gas has acted effectively as a price floor for ethane with the other NGL hydrocarbons stratified upward (with the heavier hydrocarbons being more expensive) to the price ceiling of crude oil.
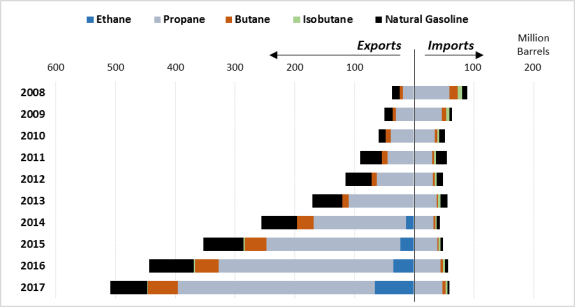
Imports and Exports
As the international competitiveness of U.S. NGLs has risen and as U.S. production has exceeded domestic demand, companies have increasingly looked to world markets. Over the years, demand for NGLs has remained mostly flat, even declining in some years. Without increasing demand in the United States, companies have increased their exports of NGLs. (See Figure 6.) Between 2008 and 2017, U.S. NGL exports grew by over 1,200%. In 2017, approximately 37% of U.S. NGL production was exported, with Canada, Japan, and China being the largest recipients, receiving 18%, 16%, and 11% of U.S. exports, respectively. Over 50% of all U.S. exports go to five countries: Canada, Japan, China, Mexico, and South Korea.26 Canada represents the largest market for U.S. natural gasoline exports—over 85% of the total volume of Canadian NGL imports from the United States come from this hydrocarbon alone. By contrast, propane comprises the largest share of imports by the other top five countries.
In the same time frame—2008 to 2017—U.S. imports of NGLs have fallen by over 30%. As a whole, the United States imports far fewer NGLs than it exports. In 2017 the United States exported over five times as many barrels of NGLs as it imported, with a majority of these imports coming from Canada, Mexico, Norway, Peru, and Sweden. These five countries together account for over 95% of U.S. imports, a majority of which is propane from Canada.
|
Figure 6. U.S. Exports and Imports by Hydrocarbon 2008-2017 |
 |
|
Source: U.S. Energy Information Administration, Petroleum and Other Liquids: Exports by Destination, U.S. Imports by Country of Origin, https://www.eia.gov/dnav/pet/pet_move_expc_a_EP00_EEX_mbbl_m.htm. |
Environment27
Most NGLs are gases at atmospheric pressure and room temperature, and therefore air emissions from NGLs can escape from small leaks, faulty equipment, or even normally operating processes (e.g., pressure relief venting). These air emission sources can occur throughout production, fractionation, processing, and distribution. Emissions of NGLs may also be considered lost product.
NGLs are included in a group of air pollutants called volatile organic compounds (VOCs). The U.S. Environmental Protection Agency (EPA) has the authority to regulate emissions of VOCs under the Clean Air Act because they contribute to the formation of ground-level ozone (smog). Studies have linked ozone to negative human health affects including respiratory ailments and premature mortality.28 Ozone has also been linked to plant damage and decreases in crop yield.29 Studies have linked exceedances of the federal air quality standards for ozone to oil and gas development in rural regions of Wyoming30 and Utah31 with VOCs playing a key role. Measurement studies in and around major U.S. oil and gas fields suggest that NGLs make up a significant portion of total VOC emissions from oil and gas production activities.32 Emissions of these ozone precursors can impact air quality, both locally and in downwind areas.
As stated, NGLs are primarily emitted to the atmosphere through unintended releases commonly referred to as fugitive emissions. By definition, fugitive releases are diffuse, transitory, and elusive. Thus, one of the greater difficulties in fully understanding the impacts of NGL emissions is the development of a comprehensive and consistent inventory of sources and emissions. EPA's National Emissions Inventory (NEI) is a bottom-up accounting of emissions that uses commonly accepted emissions factors with best available activity data to calculate an inventory for each source category. According to NEI data, emissions of total VOCs from oil and gas production and refining have increased by about 80% (from 1,814 to 3,281 thousand tons) between 2008 and 2014, the latest available data.33
Atmospheric measurements of NGLs can also be used to estimate trends and inventories of NGL emissions. Attributing these top-down estimates to specific source categories is a challenging and difficult task. Notwithstanding, a recent academic study found that after decreasing for almost 30 years, concentrations of individual NGLs in the Northern Hemisphere began to increase around 2009, and the rate of increase has been growing.34 The scientists reporting this finding used spatial patterns of ambient measurements of NGLs with shorter atmospheric lifetimes to identify oil and gas production regions in the United States as the most likely source of the increasing atmospheric concentrations of NGLs.35
EPA has established emission standards and guidelines that would limit VOC emissions, including NGLs, from the oil and natural gas sector. For example, in 201236 and 201637 EPA promulgated New Source Performance Standards (NSPS) for VOC emissions from new and modified activities and equipment in the oil and gas sector. EPA has also provided VOC reduction guidelines to state, local, and tribal air agencies for existing oil and gas sources in ozone nonattainment areas and states in the Ozone Transport Region.38 In 2018, the EPA proposed updates to the NSPS rules, loosening some requirements, and proposed to rescind the guidelines, citing the desire to "streamline implementation, reduce duplicative EPA and state requirements, and significantly decrease unnecessary burdens on domestic energy producers."39
Consumption
Consumption of NGLs has risen almost 20% between 2010 (the furthest year back of data) and 2017, mainly from a more than 40% rise in ethane use. Ethane and propane comprised almost 90% of NGL consumption in 2017. Nearly all of U.S. domestic ethane consumption is by petrochemical companies that use it to produce ethylene. The rise in ethane production has put intense downward pressure on its price. The falling profitability of ethane recovery, due to the falling price, has introduced a surprising phenomenon in the production line, something known as ethane rejection. If a plant determines that ethane recovery is not profitable at a particular time, usually by considering price spreads, they will operate in what is sometimes referred to as rejection mode. When they are in this operating mode, firms leave the ethane they receive from raw gas streams in the natural gas to be sold as natural gas (natural gas is sold on a per-BTU basis and not by volume).40 There is, however, a physical limit to how much ethane can be rejected. Pipes are typically specified for a specific range of Btu values. If too much ethane is rejected, thus raising the Btu value, the gas stream may exceed this design limitation and damage the pipelines.41
Propane, the second-largest component of NGL consumption, has declined 6% since 2010. Propane consumption, more so than for the other NGLs, is seasonal, with 45% of consumption for residential and commercial heating and cooking. As a result, propane consumption tends to increase in the winter, when home and building heating needs are highest, and nearly disappears in the summer. An additional 30% of propane is used as a feedstock for petrochemical companies. The rest is used in crop-drying and other niche tasks.42 In 2013, there was a tremendous increase in consumption due to an unusually wet corn crop season which was followed by the 2013-2014 polar vortex winter. The resultant surge in demand led to a spike in propane prices for the year. Since then both the demand and price have stabilized. The emerging trend, however, since 2016, is decreasing demand for propane. Residential and commercial markets are decreasing their consumption of propane due in large part to implementation of more energy-efficient appliances and a shift toward natural gas for heating.
Although isobutane consumption rose almost 500% during the period, it only makes up 6% of overall NGL consumption. Pentanes and normal butane comprise 4% and 2% of consumption, respectively. Normal butane use has dropped 63% between 2010 and 2017.
Congressional Interest
Infrastructure, production, safety, the environment, and economics are all critical to the NGL market and are of interest to Congress. About 30 NGL-related bills have been introduced in the 115th Congress. For example, H.R. 2568 and S. 1075 propose to have a feasibility study conducted to determine suitable locations in the areas of the Marcellus and Utica shale formations for ethane storage facilities and to then determine potential economic costs and benefits of such projects. S. 1340, the Appalachian Energy and Manufacturing Infrastructure Revitalization Act, is designed to help speed up the permitting process for projects deemed as a "critical energy infrastructure project." H.R. 5988 relates to the safety of delivering or retrieving propane containers. The Energy Information Administration's (EIA's) data on NGLs are limited, especially compared to oil and natural gas. Some stakeholders argue that this contributes to a lack of transparency in the market and hinders analysis, which may affect policymaking related to NGLs. As NGLs play a bigger role in the U.S. energy mix, this may become a larger concern. S. 1972 would require EIA to collect additional data on propane, specifically exports. Other bills that have been introduced in the 115th Congress address infrastructure, taxes, safety, and other energy topics, and are not specifically targeting NGLs.
As U.S. production of natural gas and oil continues to grow, so will U.S. consumption of NGLs. The rise in production of each NGL—ethane, propane, butane, isobutane, and pentanes—since 2008 has been large. Whether the increase is consumed in the United States or exported will depend on market conditions, especially prices. Nevertheless, the production and consumption of more NGLs requires a better understanding of the differences and specificity of each hydrocarbon. Improved data collection and market understanding will help policymakers understand the ramifications of this growing fuel source.
Appendix. Flow Chart
 |
|
Source: U.S. Energy Information Administration, https://www.eia.gov/energyexplained/index.php?page=hgls_home. |