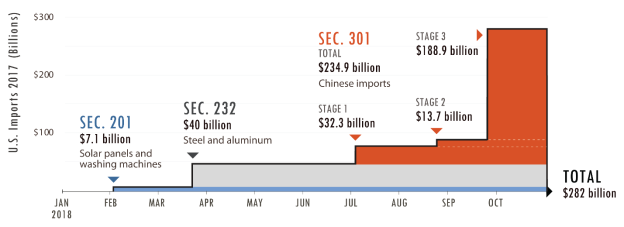
Concerns over trading partner trade practices and the U.S. trade deficit have been a focus of the Trump Administration. For a timeline of recent actions, see CRS Insight IN10943, Escalating Tariffs: Timeline. Citing these concerns and others, the President has imposed tariffs under three U.S. laws and authorities (Figure 1) that allow the Administration to unilaterally impose trade restrictions: (1) Section 201 on U.S. imports of washing machines and solar products; (2) Section 232 on U.S. imports of steel and aluminum, and potentially autos and uranium, and (3) Section 301 on U.S. imports from China. Annual U.S. imports of goods subject to the additional tariffs, which range from 10% to 50%, totaled $282 billion in 2017 (Table 1). All formally proposed tariffs are now in effect, but the President has informally raised the prospect of tariffs on an additional $267 billion of U.S. annual imports from China, and, pending a Section 232 investigation, approximately $361 billion of U.S. auto and parts imports. While the tariffs may benefit import-competing U.S. producers, they are also likely to increase costs for downstream users of imported products and consumers. The Administration could be using the tariffs in part to pressure affected countries into broader trade negotiations, such as the U.S.-EU trade liberalization talks, but it is unclear what specific outcomes the Administration is seeking.
|
Figure 1. Trump Administration Tariffs and Affected Imports
|
 |
|
Source: CRS calculations with data from U.S. Census Bureau sourced through Global Trade Atlas.
Notes: Based on 2017 import values. Increased U.S. import tariffs may reduce demand for imports lowering annual import values. The figure above includes all U.S. imports from China under HTS 85176200 ($22.9 billion in 2017). A portion of the products currently included in this category are excluded from the tariffs, but there is currently no statistical reporting number (HTS 10 digit code) for these excluded items such that CRS is unable to determine the portion of trade under this category that will be excluded. USITC is creating a new statistical reporting number, HTS 8517620090, to capture these excluded items.
|
Retaliation may amplify the potential negative effects of the U.S. tariff measures. Retaliatory tariffs in effect cover almost $126 billion of U.S. annual exports, based on 2017 export data (Table 2). Economically, retaliatory tariffs broaden the scope of U.S. industries potentially harmed, targeting those reliant on export markets and sensitive to price fluctuations, such as agricultural commodities. Some U.S. manufacturers have announced plans to shift production to other countries in order to avoid the tariffs on U.S. exports. Lost market access resulting from the retaliatory tariffs may compound concerns raised by many U.S. exporters that the United States increasingly faces higher tariffs than some competitors in foreign markets as other countries proceed with trade liberalization agreements, such as the recently signed EU-Japan FTA. Adverse effects could grow if a tit-for-tat process of retaliation continues and the scale of trade affected increases. For example, the President stated that $267 billion of additional U.S. imports from China could face increased tariffs. China's potential retaliation against another round of U.S. tariffs is limited by the fact that it has already imposed tariff increases on nearly all its U.S. imports, but it could further increase tariffs on the products it has already targeted or begin imposing nontariff measures such as informal pressure to limit U.S. multinational sales in China.
New Section 232 actions by the Administration could result in larger potential trade effects. On March 23, 2018, the Commerce Department initiated a new Section 232 investigation on U.S. auto and auto parts imports. Motor vehicles and parts accounted for $361 billion of U.S. imports in 2017. The EU, which accounts for more than $50 billion of U.S. motor vehicle and parts imports, has reportedly threatened comparable retaliatory measures. The globally integrated nature of the industry could complicate the impact of the tariffs. For example, affiliates of foreign motor vehicle firms operating in the United States exported more than $49 billion (nearly $70 billion including wholesale trade) in 2015 (latest available data). Although the auto investigation remains ongoing, the Administration has stated it will not impose tariffs while the recently announced U.S.-EU trade talks are ongoing. On July 18, the Administration began a fourth Section 232 investigation on U.S. uranium imports.
Many Members of Congress and U.S. businesses, interest groups, and trade partners, including major allies, have weighed in on the President's actions. While some U.S. stakeholders support the President's use of unilateral trade actions, many have raised concerns, including the chairs of the Ways and Means and Senate Finance Committees, about potential negative impacts. In July 2017, Congress passed a nonbinding resolution directing appropriations bill conferees to include language giving Congress a role in Section 232 determinations, and several Members have introduced legislation that would constrain the President's authority (e.g., S. 3013 and S. 3266). As it debates the Administration's import restrictions, Congress may consider the following:
- Delegation of Authority. Among these statutes, only Section 201 requires an affirmative finding by an independent agency (the ITC) before the President may restrict imports. Section 232 and Section 301 investigations are undertaken by the Administration, giving the President broad discretion in their use. Are additional congressional checks on such discretion necessary?
- Economic Implications and Escalation. The Administration's tariffs imposed to date cover more than 10% of annual U.S. goods imports; pending investigations and threatened further counter-retaliations could potentially increase this to nearly 30%. While most economists estimate that the current level of tariffs is unlikely to have major effects on the overall U.S. economy, these effects may be substantial for individual firms reliant either on imports subject to the U.S. tariffs or exports facing retaliatory measures. The potential drag on economic growth could be significant if tit-for-tat action escalates. What are the Administration's ultimate objectives from the tariff increases and do potential benefits justify potential costs?
- International Trading System. While the Administration argues that the imposition of U.S. import restrictions is within its rights under international trade agreement obligations, U.S. trade partners disagree and have initiated dispute proceedings, and begun retaliating. The United States has initiated its own dispute proceedings arguing that retaliatory countermeasures violate trade agreement obligations. What are the risks to the international trading system of continued unilateral action?
Potential Trade Affected
The tables below provide the range of potential trade volumes affected by the U.S. tariffs and trading partner retaliation. In addition to tariffs, the President has imposed quotas, or quantitative limits on U.S. imports of certain goods from specified countries, as well as tariff-rate quotas (TRQs), for which one tariff applies up to a specific quantity of imports and a higher tariff applies above that threshold.
Table 1. U.S. Import Restrictions
|
U.S. Trade Action
|
U.S. Imports (millions, 2017)
|
Additional Tariff
|
Potential Annual Tariff Revenue (millions, 2017)
|
Effective Date
|
|
Section 201
|
Solar Cells/ Modules
|
$5,196
|
TRQ (0%, 30%)/ 30%
|
$1,559
|
Feb. 7, 2018
|
|
|
Large Washers/ Washer Parts
|
$1,927
|
TRQ (20%, 50%)/ TRQ (0%, 50%)
|
$964
|
Feb. 7, 2018
|
|
|
Total
|
$7,123
|
|
$2,523
|
|
|
Section 232
|
Aluminum
|
$16,643
|
10%
|
$1,664
|
Mar. 23, 2018
|
|
|
Steel
|
$23,369
|
25%a
|
$6,140
|
Mar. 23, 2018
|
|
|
Total
|
$40,012
|
|
$7,805
|
|
|
Section 301
|
China - Stage 1
|
$32,262
|
25%
|
$8,066
|
July 6, 2018
|
|
|
China - Stage 2
|
$13,685
|
25%
|
$3,421
|
Aug. 23, 2018
|
|
|
China - Stage 3
|
$188,897b
|
10%(2018) 25%(2019)
|
$42,502c
|
Sept. 24, 2018
|
|
|
Total
|
$234,844
|
|
$53,989
|
|
|
Total in Effect
|
$281,979
|
|
$64,316
|
|
Source: Calculations by CRS based on trade data from U.S. Census Bureau and tariff data from Administration notifications.
Notes: Potential tariff revenue estimated using 2017 import values. This does not account for potential fluctuations in demand resulting from the tariffs or other variables. Increases in the price of goods resulting from the tariffs are likely to decrease demand for imports and therefore result in lower revenue collection than the estimated amounts. TRQ tariff revenue estimated assuming all imports are subject to over quota tariff.
a. U.S. steel tariff is 50% on imports from Turkey.
b. This includes all U.S. imports from China under HTS 85176200 ($22.9 billion in 2017). A portion of the products currently included in this category are excluded from the tariffs, but there is currently no statistical reporting number (HTS 10 digit code) for these excluded items such that CRS is unable to determine the portion of trade under this category that will be excluded. USITC is creating a new statistical reporting number, HTS 8517620090, to capture these excluded items moving forward.
c. Annual total revenue estimate calculated with 2 months at 10% and 10 months at 25%.
Table 2. Retaliatory Actions
|
Retaliatory Trade Action
|
U.S. Exports (millions, 2017)
|
Additional Tariff
|
Potential Annual Tariff Revenue (millions, 2017)
|
Effective Date
|
|
Section 201
|
South Korea (Solar and Washers)
|
$1,377a
|
TBD
|
$474a
|
2021
|
|
|
China (Solar and Washers)
|
$654a
|
TBD
|
$220a
|
2021
|
|
|
Japan (Solar)
|
$83a
|
TBD
|
$25a
|
2021
|
|
|
Total
|
$2,114
|
|
$719
|
|
|
Section 232
|
Canada
|
$12,748
|
10-25%
|
$1,920
|
July 1, 2018
|
|
|
Mexico
|
$3,691
|
7-25%
|
$730
|
Partial-June 5, Full-July 5, 2018
|
|
|
European Union (EU)—Stage 1
|
$3,204
|
10-25%
|
$781
|
June 25, 2018
|
|
|
EU—Stage 2
|
$4,239
|
10-50%
|
$931
|
2021
|
|
|
China
|
$2,969
|
15-25%
|
$645
|
Apr. 2, 2018
|
|
|
Japan
|
$1,911a
|
TBD
|
$440a
|
TBD
|
|
|
Turkey
|
$1,788
|
4-140%b
|
$935
|
June 21, 2018b
|
|
|
India
|
$1,396
|
10-50%
|
$240
|
Nov. 2, 2018
|
|
|
Russia
|
$347
|
25-40%
|
$105
|
Aug. 6, 2018c
|
|
|
Russia—Stage 2
|
TBD
|
TBD
|
TBD
|
2021
|
|
|
Total
|
$32,292
|
|
$6,727
|
|
|
Section 301
|
China—Stage 1
|
$33,834
|
25%
|
$8,459
|
July 6, 2018
|
|
|
China—Stage 2
|
$14,108
|
25%
|
$3,527
|
Aug. 23, 2018
|
|
|
China—Stage 3
|
$53,296
|
5%-10%
|
$3,650
|
Sept. 24, 2018
|
|
|
Total
|
$101,238
|
|
$15,636
|
|
|
Total in Effect
|
$125,984
|
|
$20,752
|
|
Source: CRS calculations based on import data of U.S. trade partner countries sourced from Global Trade Atlas and tariff details from WTO or government notifications.
Notes: Potential tariff revenue estimated using 2017 import values in dollars (foreign trade data converted to U.S. dollars based on monthly average exchange rates during the relevant time periods). This does not account for potential fluctuations in demand resulting from the tariffs or other variables. Increases in the price of goods resulting from the tariffs are likely to decrease demand for imports and therefore result in lower revenue collection than the estimated amounts. TRQ tariff revenue estimated assuming all imports are subject to over quota tariff.
a. Retaliation announcements did not include a product list or specific tariff values. Retaliatory export and tariff value estimated based on retaliation commensurate with U.S. tariff actions.
b. Turkey's retaliatory tariffs have been in effect since June 2018. Turkey increased the tariff rates in August 2018 in response to the Trump Administration's decision to increase the U.S. steel tariff on Turkish imports to 50%.
c. Russia published its list of retaliatory tariff rates and products on July 6, 2018. The tariffs appear to go into effect within 30 days of publication.