Introduction
The Elementary and Secondary Education Act (ESEA) was comprehensively reauthorized by the Every Student Succeeds Act (ESSA; P.L. 114-95) on December 10, 2015.1 The Title I-A program is the largest grant program authorized under the ESEA and is funded at $15.8 billion for FY2018. Title I-A of the ESEA authorizes aid to LEAs for the education of disadvantaged children. Title I-A grants provide supplementary educational and related services to low-achieving and other students attending pre-kindergarten through grade 12 schools with relatively high concentrations of students from low-income families. Title I-A has also become a vehicle to which a number of requirements affecting broad aspects of public K-12 education for all students have been attached as conditions for receiving Title I-A grants.
Under Title I-A, funds are distributed to state educational agencies (SEAs) and local educational agencies (LEAs) based on four formulas. The ESSA made few changes to these formulas. One notable change is an increase in the set-aside for the Bureau of Indian Education (BIE) and Outlying Areas from 1.0% to 1.1%. This change will take effect beginning in FY2017 provided the total amount available for state grants would not be less than the amount available in FY2016. All changes to the Title I-A grant allocation process made by the ESSA will take effect beginning in FY2017.2
This report provides a detailed discussion of the four Title I-A formulas used to determine grants as modified by the ESSA. Table A-1 in Appendix A offers an overview of the key elements included in the four formulas. Appendix B provides an overview of Title I-A appropriations levels in recent years.
Determination of Title I-A Grants
Under Title I-A, funds are allocated to LEAs via states using four different allocation formulas specified in statute: Basic Grants, Concentration Grants, Targeted Grants, and Education Finance Incentive Grants (EFIG). Annual appropriations bills specify that portions of each year's appropriation be allocated under each of these different formulas. In FY2018, an estimated 41% of Title I-A appropriations were allocated through the Basic Grant formula, 9% through the Concentration Grant formula, and 25% through each of the Targeted Grant and EFIG formulas.3
The current four formula strategy has evolved over time, beginning with the Basic Grant formula when the ESEA was originally enacted. The Concentration Grant formula was added in the 1970s in an attempt to focus funding more effectively on LEAs with relatively large numbers or high percentages of formula children (i.e., low-income children or children in need). During consideration of ESEA reauthorization in the early 1990s, there was an attempt to replace the two existing formulas with a new formula that would target Title I-A funds better by providing more funding per formula child as the percentage or number of formula children in an LEA increased. Both the House and the Senate developed formulas intended to accomplish this goal (Targeted Grants and EFIG, respectively). A compromise on one new formula was not reached; nor was there agreement on eliminating the existing formulas. As a result, funds are allocated through four formulas under current law.
For each formula, a maximum grant is calculated by multiplying a "formula child count," consisting primarily of estimated numbers of school-age children in poor families, by an "expenditure factor" based on state average per pupil expenditures for public K-12 education. In some formulas, additional factors are multiplied by the formula child count and expenditure factor. Then these maximum grants are reduced to equal the level of available appropriations for each formula, taking into account a variety of state and LEA minimum grant and "hold harmless" provisions. In general, LEAs must have a minimum number of formula children and/or a minimum formula child rate to be eligible to receive a grant under a specific Title I-A formula. Some LEAs may qualify for a grant under only one formula, while other LEAs may be eligible to receive grants under multiple formulas.
Under three of the formulas—Basic Grants, Concentration Grants, and Targeted Grants—funds are initially calculated at the LEA level. State grants are the total of allocations for all LEAs in the state adjusted for state minimum grant provisions. Under EFIG, grants are first calculated for each state overall and then are subsequently suballocated to LEAs within a state using a different formula. Once funds reach LEAs, the amounts allocated under the four formulas are combined and used jointly.4
Basic Grants
The Basic Grants formula is the original Title I-A formula, authorized and implemented each year since FY1966.5 It is also the formula under which the largest proportion of funds are allocated (41% of FY2018 appropriations), and under which the largest proportion of LEAs participate, largely due to its low LEA eligibility threshold (see below). However, because all post-FY2001 increases in Title I-A appropriations have been provided to the Targeted Grant and EFIG formulas (see below), the proportion of Title I-A funds allocated under the Basic Grant formula has been declining steadily since FY2001 (see Appendix B).
Compared to some of the other Title I-A formulas, the Basic Grant formula is relatively straightforward. Grants are based on two formula factors—each LEA's relative share, compared to the national total, of a formula child count multiplied by an expenditure factor—subject to available appropriations, an LEA minimum or hold harmless provision, and a state minimum. These formula factors and features are described below, followed by a mathematical expression of the formula.
Population Factor (Formula Child Count). The population used to determine Title I-A grants for the 50 states, the District of Columbia, and Puerto Rico consists of children ages 5-17 (1) in poor families, according to estimates for a recent income year for LEAs from the Census Bureau's Small Area Income and Poverty Estimates (SAIPE) program; (2) in institutions for neglected or delinquent children or in foster homes; and (3) in families receiving Temporary Assistance for Needy Families (TANF) payments above the poverty income level for a family of four (hereinafter referred to as TANF children). These children are commonly referred to as formula children. In FY2018, children in poor families accounted for about 97% of the total formula child count. Each element of the population factor is updated annually.
Eligibility Threshold. To receive funding under Basic Grants, an LEA must have at least 10 formula children and these children must account for more than 2% of the children ages 5-17 in the LEA. The latter qualification is referred to as the formula child rate and is calculated by dividing the number of formula children in an LEA by the number of children ages 5-17 who reside in the LEA. Both the number of formula children in an LEA and the number of children ages 5-17 who reside in the LEA are based on SAIPE data.
Expenditure Factor. The state expenditure factor is determined using the state average per pupil expenditure (APPE) for public K-12 education.6 For Basic Grants, state APPE is subject to a minimum of 80% and a maximum of 120% of the national APPE. That is, if a state's APPE is less than 80% of the national APPE, the state's APPE is automatically raised to 80% of the national APPE. If a state's APPE is more than 120% of the national APPE, the state's APPE is automatically reduced to 120% of the national APPE. After adjustments, should they be needed, a state's APPE is multiplied by 0.40 as specified in statute.7 The expenditure factor is the same for all LEAs in the state.
LEA Minimum Grant or "Hold Harmless" Level. If sufficient funds are appropriated, each LEA is to receive a minimum of 85%, 90%, or 95% of its prior-year grant, depending on the LEA's formula child rate. More specifically, the hold harmless rate is 85% of the previous-year grant if the LEA's formula child rate is less than 15%, 90% if the LEA's formula child rate is at or above 15% and less than 30%, and 95% if the LEA's formula child rate is at or above 30%. In order to benefit from the hold harmless provisions, an LEA must meet the eligibility requirements for Basic Grants.
Minimum State Grant. Each state is to receive the lesser of (1) 0.25% of total Basic Grant appropriations if total Basic Grant funding is equal to or less than the FY2001 level (as has been the case each year since FY2001 thus far),8 and up to 0.35% of total Basic Grant appropriations in excess of the FY2001 amount, if any; or (2) the average of (i) 0.25% of the total FY2001 amount for state grants plus 0.35% of any amount above the FY2001 level, and (ii) 150% of the national average grant per formula child, multiplied by the number of formula children in the state.9
Initial LEA Grant. The initial grant for each LEA is calculated by multiplying the number of formula children in the LEA by the state expenditure factor.
Ratable Reduction. After initial grants are calculated, if appropriations are insufficient to pay the initial amounts (as has been the case every year beginning with FY1967), these amounts are reduced by the same percentage (though not necessarily the same dollar amount) for all LEAs, subject to LEA hold harmless and state minimum provisions, until they equal the aggregate level of appropriations.
Treatment of Puerto Rico, the Outlying Areas, Palau, and the Bureau of Indian Education. Puerto Rico is treated as a state under the Basic Grant formula. Grants to schools operated or supported by the BIE and Outlying Areas are provided via a reservation of 1% of total Title I-A appropriations.10 From the funds reserved for the BIE and Outlying Areas, up to $5 million is reserved for competitive grants to the Outlying Areas and Palau. Beginning in FY2017, 0.7% of total Title I-A appropriations will be reserved for the BIE and 0.4% of total Title I-A appropriations will be reserved for the Outlying Areas provided the total amount of funds available to make grants to states after implementing these provisions is at least as much as the total amount of funds available to make grants to states in FY2016.11 Of the funds allocated to the Outlying Areas under this scenario, $1 million will be taken off the top for a grant to Palau. If appropriations for Title I-A for FY2017 or a subsequent fiscal year are insufficient to meet the requirement that the total amount of funds available to make grants to states after reserving 1.1% for the BIE and Outlying Areas is at least as much as the total amount of funds available to make grants to states in FY2016, the reservation of funds for the BIE and Outlying Areas will be implemented as required by law prior to the enactment of ESSA.
Further Adjustments by SEAs of LEA Grants as Calculated by ED. Among ESEA programs, a distinctive aspect of Title I-A is that after calculation of LEA grants by ED applying the methods discussed here, SEAs make a number of adjustments before determining the final amounts that LEAs actually receive. These adjustments include the following:
- Through FY2016, reservation of 4% of state total allocations to be used for school improvement grants; beginning in FY2017,12 states are required to reserve the larger of (1) 7% of state total allocations or (2) the amount the state reserved for school improvement under Title I-A in FY2016 plus its school improvement grant for FY2016;13
- Reservation of 1% of state total allocations under all formulas for ESEA Title I, Part A, plus funds allocated under the Migrant Education Program (Title I-C) and the Prevention and Intervention Programs for Children and Youth Who Are Neglected, Delinquent, or At-Risk (Title I-D), or $400,000, whichever is greater, for state administration;14
- Through FY2016, optional reservation of up to 5% of any statewide increase in total Title I-A grants over the previous year for academic achievement awards to participating schools that significantly reduce achievement gaps between disadvantaged and other student groups or exceed adequate yearly progress standards for two consecutive years or more;
- Beginning in FY2017, an optional reservation of 3% of the state total allocation for direct student services;
- Provision of funds to eligible charter schools or to account for recent LEA boundary changes; and
- Optional use by states of alternative methods to reallocate all of the grants as calculated by ED among the state's small LEAs (defined as those serving an area with a total population of 20,000 or fewer persons).15
Basic Grant Allocation Formula
Step 1: Preliminary Grant 1 = PF * EF or L_HH, whichever is greater
In Step 1, the population factor (formula child count) is multiplied by the expenditure factor for each eligible LEA. If this amount is greater than the LEA's hold harmless level it is used in the subsequent calculation. If it is less than the LEA's hold harmless level, the hold harmless amount is used.
Step 2: Preliminary Grant 2 = (Preliminary Grant 1 / ∑ Preliminary Grant 1) * APP or L_HH, whichever is greater
In Step 2, to adjust grant amounts for insufficient appropriations, the amount for each LEA in Step 1 is divided by the total of these amounts for all eligible LEAs in the nation and multiplied by the available appropriation. This preliminary grant amount is used in the subsequent calculation unless it is less than the LEA's hold harmless level. In such instances, the hold harmless amount is used.
Step 3: Preliminary Grant 3 = (Preliminary Grant 2 * S_MIN_ADJ * L_HH_ADJ) or L_HH, whichever is greater
In Step 3, the amount for each LEA in Step 2 is adjusted through application of the state minimum grant provision and by a factor to account for the aggregate costs of raising affected LEAs to their hold harmless levels, given a fixed total appropriation level. LEAs in states receiving a minimum grant will generally see an increase in their grant amounts while LEAs in states not receiving a minimum grant will generally see a decrease in their grant amounts. Similarly, the LEA hold harmless adjustment is downward for all LEAs except those at their hold harmless levels. If appropriations are sufficient, no LEA will receive less than its hold harmless amount.
It should be noted that in the grant allocation process, only Steps 1 through 3 are calculated by ED. Thus, all estimates produced by ED (and by CRS) are the grant amounts calculated in Step 3.
Step 4: Final Grant = Preliminary Grant 3 * SCH_IMP_ADJ * S_ADMIN_ADJ * AWD_ADJ * DSS_ADJ*OTR_ADJ
In the final step of calculating LEA grants under all Title I-A allocation formulas, LEA grants as calculated in Step 3 are further adjusted by the state for the school improvement and state administration reservations, possible state reservations for achievement awards (through FY2016), possible state reservations for direct student services (beginning in FY2017), and other possible adjustments (such as for grants to charter schools) discussed above.
Where:
PF = Population factor (formula child count)
EF = Expenditure factor
L_HH = LEA minimum or hold harmless level
APP = Appropriation
S_MIN_ADJ = State minimum adjustment (proportional increase [in small states] or decrease [in other states] to apply the statewide minimum grant)
L_HH_ADJ = LEA minimum or "hold harmless" adjustment (proportional decrease, in LEAs not benefitting from the LEA "hold harmless," to apply the LEA minimum grant)
SCH_IMP_ADJ = Reservation by SEA for school improvement grants
S_ADMIN_ADJ = Reservation by SEA for state administration
AWD_ADJ = Possible reservation by SEA for achievement awards through FY2016
DSS_ADJ = Possible reservation by SEA for direct student services beginning in FY2017
OTR_ADJ = Other possible adjustments by the SEA
∑ = Sum (for all eligible LEAs in the nation)
Concentration Grants
The Concentration Grant formula is essentially the same as Basic Grants, with one substantial exception: it has a much higher LEA eligibility threshold. There are also differences in the LEA hold harmless and state minimum grant provisions. Although the Title I-A statute has included Concentration Grant formulas (with varying provisions and sometimes under different names) since 1970, the current version of the formula dates from 1988 (P.L. 100-297).16 A relatively small proportion (9% of FY2018 appropriations) of Title I-A appropriations is allocated under the Concentration Grant formula.
As with Basic Grants, Concentration Grants are based on each eligible LEA's share, compared to the national total, of a population factor multiplied by an expenditure factor, subject to available appropriations, an LEA minimum or "hold harmless," and a state minimum. These formula factors are described below, followed by a mathematical expression of the formula.
Population Factor (Formula Child Count). Same as Basic Grants (see above).
Eligibility Threshold. To receive funding under Concentration Grants, an LEA must be eligible for a Basic Grant and have more than 6,500 formula children or a formula child rate greater than 15%.
Expenditure Factor. Same as Basic Grants (see above).
LEA Minimum Grant or "Hold Harmless" Level. The hold harmless rates for Concentration Grants are the same as those for Basic Grants with one exception. Unlike with Basic Grants and the other Title I-A formulas, LEAs that meet the eligibility requirements in one year to receive a Concentration Grant but fail to meet the requirements in a subsequent year will continue to receive a grant based on the hold harmless provisions for four additional years.
Minimum State Grant. The Concentration Grant state minimum is a modified version of the Basic Grant minimum. Each state is to receive the lesser of (1) 0.25% of total Concentration Grant appropriations if total Concentration Grant funding is equal to or less than the FY2001 level (as has been the case each year since FY2001 thus far), and up to 0.35% of total Concentration Grant appropriations in excess of the FY2001 amount, if any; or (2) the average of (i) 0.25% of the total FY2001 amount for state grants plus 0.35% of the amount above this, and (ii) the greater of 150% of the national average grant per formula child, multiplied by the number of formula children in the state, or $340,000.17,18
Initial LEA Grant. Same as Basic Grants (see above).
Ratable Reduction. Same as Basic Grants (see above).
Treatment of Puerto Rico, Outlying Areas, and the Bureau of Indian Education. Same as Basic Grants (see above).
Further Adjustments by SEAs of LEA Grants as Calculated by ED. With one exception, these are the same as for Basic Grants. The exception is that in states where the state total number of formula children constituted less than 0.25% of the national total of such children as of the date of enactment of the No Child Left Behind Act of 2001 (NCLB; P.L. 107-110),19 SEAs may allocate Concentration Grants among all LEAs with a formula child count or rate that is greater than the state average number or percentage of such children (not just LEAs meeting the 6,500 or 15% thresholds). These SEAs also have the option of allocating grants to LEAs based solely on formula child counts.
Concentration Grant Allocation Formula. The mathematical expression of the Concentration Grant formula is the same as that for Basic Grants (above), with one exception. As discussed immediately above, in states where the number of formula children constituted less than 0.25% of the national total of such children as of the date of enactment of the NCLB, the state total may be allocated to LEAs based on the formula child counts in each LEA. These LEAs may include, at state discretion, either LEAs in the state meeting the Concentration Grant eligibility criteria described above, or all LEAs in the state with a formula child count or rate that is greater than the state average. In either case, in these states Step 3 of the grant allocation process is:
LEA Grant = PF / ∑ PF * ALL or L_HH, whichever is greater
Where:
PF = Population factor (formula child count)
ALL = State total allocation
L_HH = LEA minimum or "hold harmless" level
∑ = Sum (for all eligible LEAs in the state)
Targeted Grants
Targeted Grants were initially authorized in 1994,20 but no funds were appropriated for them until FY2002, after the formula was slightly modified.21 Beginning in FY2002, all increases in Title I-A appropriations have been allocated as either Targeted Grants or EFIG (below). Thus, Targeted Grants constitute a substantial and growing portion (25% of FY2018 appropriations) of total Title I-A grants.22
The allocation formula for Targeted Grants is essentially the same as that for Basic Grants, except for substantial differences related to how children in the population factor are counted. For Targeted Grants, the formula children are assigned weights on the basis of each LEA's formula child rate and number of formula children. As a result, the higher an LEA's formula child rate and/or number of formula children are, the higher grant per child counted in the formula it receives. There is also a somewhat higher LEA eligibility threshold for Targeted Grants than for Basic Grants (e.g., 5% formula child rate for Targeted Grants and 2% formula child rate for Basic Grants). Aside from these two differences, Targeted Grants, like Basic Grants, are based on each eligible LEA's share, compared to the national total, of a formula child count multiplied by an expenditure factor, subject to available appropriations, an LEA minimum or "hold harmless," and a state minimum. These formula factors are described below, followed by a mathematical expression of the formula.
Population Factor (Formula Child Count). The children counted for calculating Targeted Grants are the same as for Basic Grants (see above). However, for Targeted Grants LEA-specific weights are applied to these child counts to produce a weighted child count that is used in the formula. In general, children counted in the formulas are assigned weights on the basis of (1) each LEA's formula child rate (commonly referred to as percentage weighting), and (2) each LEA's number of formula children (commonly referred to as number weighting). Under both percentage weighting and number weighting, a weighted formula child count is produced. The higher of the two weighted formula child counts for a given LEA is then used in the formulas for determining grants. As a result, the higher an LEA's formula child rate and/or number are, the higher grant per formula child it receives. Of the LEAs for which ED calculates grants under the Targeted Grant formula, about 88% have higher weighted formula child counts based on their formula child rates than based on their number of formula children for FY2015. That is, 88% of LEAs receiving grants under the Targeted Grant formula use the percentage-based rather than the numbers-based weighting scale.
The weights are applied under number weighting and under percentage weighting in a stepwise manner to all LEAs nationwide to produce two weighted child counts (one under each weighting system). Formula children in LEAs with the highest formula child rates have a weight of up to four, and those in LEAs with the highest numbers of such children have a weight of up to three, compared to a weight of one for formula children in LEAs with the lowest formula child rate and number of such children (see Table 1, below).
Table 1. Weights Applied to Formula Child Counts in the Calculation of ESEA Title I-A Targeted Grants
|
A. Weights Based on LEA Numbers of Formula Children (Number Weighting) |
|
|
Population Range |
Weight Applied to Formula Children in This Range |
|
0-691 |
1.0 |
|
692-2,262 |
1.5 |
|
2,263-7,851 |
2.0 |
|
7,852-35,514 |
2.5 |
|
35,515 or more |
3.0 |
|
B. Weights Based on LEA Formula Children as a Percentage of Total School-Age Population (Percentage Weighting) |
|
|
Population Range |
Weight Applied to Formula Children in This Range |
|
0%-15.58% |
1.00 |
|
15.58%-22.11% |
1.75 |
|
22.11%-30.16% |
2.50 |
|
30.16%-38.24% |
3.25 |
|
Above 38.24% |
4.00 |
Source: Table prepared by CRS, based on CRS analysis of current law.
Note: Each population quintile includes 20% of all formula children. For example, 20% of all formula children live in LEAs that have 0-691 formula children. Similarly, 20% of all formula children live in LEAs in which up to 15.58% of all children ages 5-17 are formula children.
There are five ranges associated with each of the number and percentage weighting scales demarcated in current law. These steps, or quintiles, were based on the actual distribution of Title I-A formula children among the nation's LEAs according to the latest available data in 2001.23 Each quintile includes roughly 20% of all formula children included in the determination of FY2001 Title I-A grants.
As previously discussed, the Targeted Grant formula child weights are applied in a stepwise manner, rather than the highest relevant weight being applied to all formula children in the LEA. For example, assume an LEA has 2,000 formula children and the total school-age population is 10,000; the formula child rate is 20%. The following calculations demonstrate how an LEA's weighted child count would be calculated under number weighting and percentage weighting in this example:
Numbers Scale:
Step 1: 691 * 1.0 = 691
The first 691 formula children are weighted at 1.0.
Step 2: (2,000 - 691) = 1,309 * 1.5 = 1,963.5
For an LEA with a total number of formula children falling within the second step of the numbers scale, the number of formula children above 691 (the maximum for the first step) is weighted at 1.5.
Total (Numbers Scale) = 691 + 1,963.5 = 2,654.5
The weighted formula child counts from Steps 1 and 2 are combined.
Percentage Scale:
Step 1: 15.58% * 10,000 = 1,558 * 1.0 = 1,558
The number of formula children constituting up to 15.58% of the LEA's total school-age population is weighted at 1.0.
Step 2: (20% - 15.58%) = 4.42% * 10,000 = 442 * 1.75 = 773.5
For an LEA with a formula child rate falling within the second step of the percentage scale, the number of formula children above 15.58% of the LEA's total school-age population (the maximum for the first step) is weighted at 1.75.
Total (Percentage Scale) = 1,558 + 773.5 = 2,331.5
The weighted formula child counts from Steps 1 and 2 are combined.
Since the numbers scale weighted count of 2,654.5 exceeds the percentage scale weighted count of 2,331.5, the numbers scale count would be used as the population factor for this LEA in the calculation of Targeted Grants.
Eligibility Threshold. To receive funding under Targeted Grants, an LEA must have at least 10 formula children (with no weights applied) and have a formula child rate of 5% or more.
Expenditure Factor. Same as Basic Grants (see above).
LEA Minimum Grant or "Hold Harmless" Level. Same as Basic Grants (see above).
Minimum State Grant. Each state is to receive the lesser of (1) 0.35% of total state grants, and (2) the average of 0.35% of total state grants and 150% of the national average grant per formula child, multiplied by the number of formula children in the state. (In the latter calculation, formula child counts are not weighted.24)
Initial LEA Grant. Same as Basic Grants (see above) except that the formula child count for each LEA is weighted.
Ratable Reduction. Same as Basic Grants (see above).
Treatment of Puerto Rico, Outlying Areas, and the Bureau of Indian Education. Same as Basic Grants (see above), with one additional provision. For Puerto Rico, a cap of 1.82 is placed on the aggregate weight applied to the population factor under the Targeted Grant formula when calculating the weighted child count for Puerto Rico.25
Further Adjustments by SEAs of LEA Grants as Calculated by ED. Same as Basic Grants (see above).
Targeted Grant Allocation Formula. Same as Basic Grants (see above), except that the population factor would be the weighted child count, as described above.
Education Finance Incentive Grants (EFIG)
As with the Targeted Grant formula, the EFIG formula was initially authorized in 1994,26 but no funds were appropriated for it until FY2002, after the formula was (in the case of EFIG) considerably modified.27 Beginning in FY2002, all increases in Title I-A appropriations have been allocated as either EFIG or Targeted Grants. Thus, as with Targeted Grants, grants under EFIG constitute a substantial and growing portion (25% of FY2018 appropriations) of total Title I-A grants.28 The EFIG formula is, however, substantially different from the other Title I-A allocation formulas.
First, under EFIG grants are initially calculated at the state level. As a result, a state grant amount is affected by the formula child count within the state relative to the formula child count in other states. Subsequently, LEAs within each state compete for grants against other LEAs in the state, and these grants are determined, in part, based on how an LEA's formula child count compares to that of other LEAs in the same state. Under the other three Title I-A formulas, grants are initially determined at the LEA level, so each LEA competes for funding against all other LEAs nationwide.
Second, while formula child counts are not weighted when calculating state total grants under the EFIG formula, they are weighted in the separate process of suballocating state total grants among LEAs. This intra-state allocation process is based on the same number and percentage scales used for Targeted Grants, but the weights vary among states based on a state's equity factor (see below for more information).
Third, slightly narrower floor and ceiling constraints are applied to the expenditure factor under EFIG compared to the other Title I-A formulas. In general, this results in higher expenditure factors for lower-spending states and lower expenditure factors for higher-spending states relative to the other Title I-A formulas.
Fourth, the EFIG formula includes not only a formula child count and an expenditure factor but also two unique factors. These are an effort factor, based on APPE for public K-12 education compared to personal income per capita for each state compared to the nation as a whole, and an equity factor, based on variations in APPE among the LEAs within a given state.
Thus, state total grants under EFIG are based on each state's share, compared to the national total, of a formula child count multiplied by an expenditure factor, an effort factor, and an equity factor, adjusted by a state minimum. Then, each LEA's share of the state's total grant under EFIG is based on a weighted formula child count for the LEA, compared to the total for all LEAs in the state, adjusted by an LEA hold harmless provision. These formula factors are described below, followed by a mathematical expression of the formula.
Population Factor (Formula Child Count). In the first-stage calculation of state total grants under EFIG, this factor is the same as for Basic Grants (see above). In the second-stage suballocation of state total grants to LEAs, as under all stages of the allocation process for Targeted Grants, weights are applied to the formula child counts before they are actually used in the formula. This process is the same as for Targeted Grants with respect to the number and percentage scales used, and use of the greater of the two weighted child counts to calculate LEA grants. However, for EFIG the weights on the number and percentage scales differ, depending on the state's equity factor. That is, the weights rise more rapidly as the numbers and percentages of formula children increase in states with higher equity factors. As is discussed below, states with higher equity factors have relatively high degrees of variation in APPE among their LEAs. For states with an equity factor below 0.10, the weights are the same as for Targeted Grants. For states with equity factors of 0.10 to less than 0.20, the maximum weights are 50% higher than for Targeted Grants. For states with equity factors of 0.20 or above, the maximum weights are twice as high as for Targeted Grants. This variation is illustrated in Table 2.
Table 2. Weights Applied to Formula Child Counts in the Calculation of LEA Grants Under the ESEA Title I-A Education Finance Incentive Grant Formula
|
A. Weights Based on LEA Numbers of Formula Children (Number Weighting) |
|||
|
Weight Applied to Formula Children Based on |
|||
|
Population Range |
State Equity Factor Below 0.10 |
State Equity Factor of 0.10 to Less Than 0.20 |
State Equity Factor of 0.20 or Above |
|
0-691 |
1.0 |
1.000 |
1.0 |
|
692-2,262 |
1.5 |
1.500 |
2.0 |
|
2,263-7,851 |
2.0 |
2.250 |
3.0 |
|
7,852-35,514 |
2.5 |
3.375 |
4.5 |
|
35,515 or more |
3.0 |
4.500 |
6.0 |
|
B. Weights Based on LEA Formula Children as a Percentage of Total School-Age Population (Percentage Weighting) |
|||
|
Weight Applied to Formula Children Based on |
|||
|
Population Range |
State Equity Factor Below 0.10 |
State Equity Factor of 0.10 to Less Than 0.20 |
State Equity Factor of 0.20 or Above |
|
0-15.58 |
1.00 |
1.0 |
1.0 |
|
15.58-22.11 |
1.75 |
1.5 |
2.0 |
|
22.11-30.16 |
2.50 |
3.0 |
4.0 |
|
30.16-38.24 |
3.25 |
4.5 |
6.0 |
|
Above 38.24 |
4.00 |
6.0 |
8.0 |
Source: Table prepared by CRS, based on CRS analysis of the ESEA.
Note: Each population quintile includes 20% of all formula children. For example, 20% of all formula children live in LEAs that have 0-691 formula children. Similarly, 20% of all formula children live in LEAs in which up to 15.58% of all children ages 5-17 are formula children.
Eligibility Threshold. Same as Targeted Grants (see above).
Expenditure Factor. The state expenditure factor is determined using the state APPE for public K-12 education. For EFIG, state APPE is subject to a minimum of 85% (not 80%, as in the other Title I-A formulas) and a maximum of 115% (not 120%, as in the other Title I-A formulas) of the national APPE. That is, if a state's APPE is less than 85% of the national APPE, the state's APPE is automatically raised to 85% of the national APPE. If a state's APPE is more than 115% of the national APPE, the state's APPE is automatically reduced to 115% of the national APPE. After adjustments, should they be needed, a state's APPE is multiplied by 0.40 as specified in statute.29 The expenditure factor is the same for all LEAs in the same state.
Effort Factor. The effort factor is one of the two factors that is only included in the EFIG formula. It is a ratio of the three-year average APPE for public K-12 education to the three-year average state personal income per capita (PCI) divided by the ratio of the three-year average national APPE to the three-year average national PCI. The effort factor ratio is
|
Effort = |
3-Year Average APPE State : 3-Year Average PCI State |
|
3-Year Average APPE National : 3-Year Average PCI National |
The resulting index number is greater than 1.0 for states where the ratio of expenditures per pupil for public elementary and secondary education to PCI is greater than the average for the nation as a whole, and below 1.0 for states where the ratio is less than the average for the national as a whole. Narrow bounds of 0.95 and 1.05 are placed on the resulting multiplier, so that its influence on state grants is rather limited. The effort factor is the same for all LEAs in the same state.
Equity Factor. The equity factor is also unique to the EFIG formula. It is based on a measure of the average disparity in APPE among the LEAs of a state, called the coefficient of variation (CV). The CV is expressed as a decimal proportion of the state APPE. In the CV calculations for this formula, an extra weight (1.4 vs. 1.0) is applied to estimated counts of formula children. The effect of including this additional weight is that grants would be maximized for a state where expenditures per formula child are 40% higher than expenditures per nonformula child.30 Typical state equity factors range from 0.0 (for the single-LEA jurisdictions of Hawaii, Puerto Rico, and the District of Columbia, where by definition there is no variation among LEAs) to approximately 0.25 for a state with high levels of variation in expenditures per pupil among its LEAs. The equity factors for most states fall into the 0.10-0.20 range.31 In calculating grants, the equity factor is subtracted from 1.30 to determine a multiplier to be used in calculating state grants. As a result, the lower a state's expenditure disparities among its LEAs are, the lower its CV and equity factor are, and the higher its multiplier and grant are under the EFIG formula. Conversely, the greater a state's expenditure disparities among its LEAs are, the higher its CV and equity factor are, and the lower its multiplier and grant are under the EFIG formula. In effect, states are rewarded for having lower disparities among LEAs.
LEA Minimum Grant or "Hold Harmless" Level. Same as Basic Grants (see above), with one exception. The hold harmless provisions are not taken into consideration in the initial calculation of state total grants. Therefore, it is possible (and it has occurred in a small number of instances) that state total grants would be insufficient to fully pay hold harmless amounts to all LEAs in a state. In that case, each LEA would get a proportional share of its hold harmless amount.32
Minimum State Grant. Same as Target Grants (see above), with one exception. The formula child count used in the calculation of the minimum grant amounts for each state includes children in LEAs that are ineligible for grants under the EFIG formula. In contrast, under Targeted Grants only children in LEAs eligible to receive Targeted Grants are included in the determination of the state minimum grant amounts.33,34
Initial State Grant. The initial grant for each state is calculated by multiplying the unweighted number of formula children in the state by the state expenditure factor, the state effort factor, and the state equity factor.
Ratable Reduction. Same as Basic Grants (see above).
Treatment of Puerto Rico, Outlying Areas, and the Bureau of Indian Education. Same as Basic Grants (see above).
Further Adjustments by SEAs of LEA Grants as Calculated by ED. Same as Basic Grants (see above).
Education Finance Incentive Grant Allocation Formula.
Stage 1: Calculation of State Total EFIG Allocations
Step 1: Preliminary State Grant = PF * EF * EFF * (1.30 - EQ)
In Step 1, the population factor is multiplied by the expenditure factor, the effort factor, and 1.30 minus the equity factor for each state.
Step 2: Final State Grant = (Preliminary State Grant / ∑ Preliminary State Grant) * APP * S_MIN_ADJ or S_MIN, if greater
In Step 2, the amount for each state in Step 1 is divided by the total of these amounts for all eligible states in the nation, and then multiplied by the available appropriation, adjusted through application of the state minimum grant provision. The state minimum grant adjustment is upward in the smallest states, where total grants are increased through application of the minimum and downward in all other states, where funds are reduced in order to pay the costs of applying the minimum.
Stage 2: Calculation of LEA EFIG Allocations
Step 1: Preliminary LEA Grant 1 = (WPF / ∑ WPF) * S_ALL, or L_HH, whichever is greater
In Step 1, the weighted population factor for each eligible LEA is divided by the total weighted population factor for all eligible LEAs in the state. If this amount is greater than the LEA's hold harmless amount, it is used. If it is less than the LEA's hold harmless level and sufficient funds are available, the hold harmless amount is used.
Step 2: Preliminary LEA Grant 2 = Preliminary LEA Grant 1 * L_HH_ADJ or L_HH, whichever is greater
In Step 2, the amount for each LEA is adjusted to account for the aggregate costs of raising LEAs in the state to their hold harmless levels. That is, when LEAs whose preliminary grant amounts are below their hold harmless levels are brought up to their hold harmless levels, the grant amounts for all other LEAs in the state are reduced by the same percentage (but not necessarily the same amount). If an LEA's new grant amount is less than the LEA's hold harmless level and sufficient funds are available, the latter amount is used.
It should be noted that in the grant allocation process, only Stage 1 and Steps 1 and 2 in Stage 2 are calculated by ED. Thus, all estimates produced by ED (and by CRS) are the grant amounts calculated in Step 2 of Stage 2.
Step 3: Final LEA Grant = Preliminary LEA Grant 2 * SCH_IMP_ADJ * S_ADMIN_ADJ * AWD_ADJ * DSS_AWD*OTR_ADJ
In the final step of calculating LEA grants under all Title I-A allocation formulas, LEA grants as calculated in Step 2 are further adjusted by the state for the school improvement and state administration reservations, possible state reservations for achievement awards (through FY2016), possible state reservations for direct student services (beginning in FY2017), and other possible adjustments (such as for grants to charter schools) discussed above.
Where:
PF = Population factor (formula child count)
EF = Expenditure factor
EFF = Effort factor
EQ = Equity factor
APP = Appropriation
S_MIN_ADJ = State minimum adjustment (proportional decrease in nonminimum grant states to account for the increase in grant amounts in minimum grant states)
S_MIN = State minimum
WPF = Weighted population factor
S_ALL = State total allocation
L_HH = LEA minimum or hold harmless level
L_HH_ADJ = LEA minimum or hold harmless adjustment (proportional decrease, in LEAs not benefitting from the LEA hold harmless, to apply the LEA minimum grant)
SCH_IMP_ADJ = Reservation by SEA for school improvement grants
S_ADMIN_ADJ = Reservation by SEA for state administration
AWD_ADJ = Possible reservation by SEA for achievement awards through FY2016
DSS_ADJ = Possible reservation by SEA for direct student services beginning in FY2017
OTR_ADJ = Other possible adjustments by the SEA
∑ = Sum (for all states in the nation in Stage 1, and for all eligible LEAs in the state in Stage 2)
Allocations at the School Level
Unlike other federal elementary and secondary education programs, most Title I-A funds are subsequently allocated to individual schools by formula, although LEAs retain substantial discretion to control the use of a significant share of Title I-A grants at a central district level. While there are several rules related to school selection, LEAs must generally rank their public schools by their percentages of students from low-income families, and serve them in rank order. This must be done without regard to grade span for any eligible school attendance area35 in which the concentration of children from low-income families exceeds 75%. Below this point, an LEA can choose to serve schools in rank order at specific grade levels (e.g., only serve elementary schools in order of their percentages of children from low-income families). Beginning in FY2017, LEAs will have the option to serve elementary and middle schools with more than 75% of their children from low-income families and high schools with more than 50% of their children from low-income families before choosing to serve schools in rank order by specific grade levels. All participating schools must generally have a percentage of children from low-income families that is higher than the LEA's average, or 35%, whichever of these two figures is lower, although LEAs have the option of setting school eligibility thresholds higher than the minimum in order to concentrate available funds on a smaller number of schools.
In a large majority of cases, the data used to determine which students are from low-income families for the distribution of funds to schools are not the same as those used to identify school-age children in poor families for purposes of calculating allocations to states and LEAs. This is because data are not typically available on the number of school-age children enrolled in a school, or living in a residential school attendance zone, with income below the standard federal poverty threshold. Such "population in poverty" estimates, as used in the formulas for allocation of funds to states and LEAs (discussed above), are usually available only for LEAs, counties, and states.
Thus, LEAs must use available proxies for low-income status. The Title I-A statute allows LEAs to use the following low-income measures: (1) the number of children ages 5 through 17 in poverty counted in the most recent Census data approved by the Secretary; (2) eligibility for free and reduced-price school lunches; (3) eligibility for Temporary Assistance to Needy Families (TANF); or (4) eligibility for Medicaid.36 At the level of individual schools, the most commonly used criterion for determining whether students are from low-income families is eligibility for free and reduced-price school lunches.37 The income eligibility thresholds for free and reduced-price lunches are higher than the poverty levels used in the allocation formulas to states and LEAs: 130% of poverty for free lunches, 185% for reduced-price lunches.38
Funds are allocated among schools in proportion to their number of students from low-income families, although grants to eligible schools per student from a low-income family need not be equal for all schools. LEAs may choose to provide higher grants per child from a low-income family to schools with higher percentages of such students (e.g., higher grants per child to a school where 70% of students are from low-income families than to a school where 40% of students are from low-income families). If an LEA provides Title I-A funds to schools with low-income child percentages below 35%, then it must provide a minimum amount of funds per child from a low-income family—equal to at least 125% of the LEA's Title I-A grant per child from a low-income family—to each participating school.
Similarly, the share of funds to be used by each recipient LEA to serve educationally disadvantaged students attending private schools is determined on the basis of the number of children from low-income families living in the attendance areas served by public schools selected to receive Title I-A grants. For this purpose, LEAs may use either the same source of data used to select and allocate funds among public schools (usually free/reduced-price school lunch data) or one of a specified range of alternatives.39
Appendix A. Title I-A Formula Characteristics
|
Current Law |
||||
|
Formula Characteristic |
Basic Grants |
Concentration Grants |
Targeted Grants |
Education Finance Incentive Grants (EFIG) |
|
Formula child count |
Children ages 5-17: (1) in poor families; (2) in institutions for neglected or delinquent children or in foster homes; and (3) in families receiving Temporary Assistance for Needy Families (TANF) payments above the poverty income level for a family of four |
Same as Basic Grants |
Same as Basic Grants |
Same as Basic Grants |
|
Formula child eligibility threshold for LEAsa |
10 or more formula children AND a formula child rate of more than 2% |
More than 6,500 formula children OR a formula child rate of more than 15% AND must meet the eligibility requirements for Basic Grants |
10 or more formula children AND a formula child rate of 5% or more |
Same as Targeted Grants |
|
Weighting of formula child count |
None |
None |
At all stages of the allocation process, formula children are assigned weights on the basis of each LEA's number of formula children and formula child rate |
For allocation of funds within states only, formula children are assigned weights on the basis of each LEA's number of formula children and formula child rate |
|
Expenditure factor |
State average expenditures per pupil for public K-12 education, subject to a minimum of 80% and maximum of 120% of the national average, further multiplied by 0.40 |
Same as Basic Grants |
Same as Basic Grants |
Same as Basic Grants, except that the minimum is 85% and the maximum is 115% of the national average |
|
Minimum state grantb |
Up to 0.25% of total state grants, subject to a series of caps |
Same as Basic Grants |
Up to 0.35% of total state grants, subject to a series of caps |
Same as Targeted Grants |
|
LEA hold harmless |
85%–95% of the previous-year grant, depending on the LEA's formula child rate, applicable only to LEAs meeting the formula's eligibility thresholds |
Same as Basic Grants except that LEAs are eligible for the hold harmless for up to four years after they no longer meet the eligibility threshold |
Same as Basic Grants |
Same as Basic Grants |
|
Stages in the grant calculation process |
Grants are calculated at the LEA level, subject to state minimum provisions |
Same as Basic Grants |
Same as Basic Grants |
Grants are first calculated for states overall, then state total grants are allocated to LEAs in a separate process |
|
Additional formula factors |
None |
None |
None |
State effort and equity factors are applied in the calculation of state total grantsc,d |
|
Funding trigger |
None |
None |
Receives a share of Title I-A appropriations that are in excess of the amount of funds provided for Basic Grants and Concentration Grants in FY2001; for FY2016, appropriators determined how to divide these funds between Targeted Grants and EFIG;e beginning in FY2017, statutory provisions require that all funds in excess of FY2001 levels be divided evenly between Targeted Grants and EFIG |
Receives a share of Title I-A appropriations that are in excess of the amount of funds provided for Basic Grants and Concentration Grants in FY2001; for FY2016, appropriators determined how to divide these funds between Targeted Grants and EFIG;e beginning in FY2017, statutory provisions require that all funds in excess of FY2001 levels be divided evenly between Targeted Grants and EFIG |
Source: Table prepared by CRS based on an analysis of the ESEA.
a. The formula child rate is the percentage of children ages 5-17 residing in a given LEA who are formula children. It is calculated by dividing the number of formula children in an LEA by the number of children ages 5-17 who reside in the LEA.
b. Formula child counts are used to determine the caps on the minimum grants under all four formulas. Under Basic Grants, Concentration Grants, and Targeted Grants only formula children in LEAs eligible for Title I-A are included in the determination of the state minimum grant amounts. Under EFIG, all formula children, regardless of whether or not they reside in an LEA eligible for Title I-A, are included in the determination of the state minimum grant amounts.
c. The effort factor is calculated based on average per pupil expenditures for public K-12 education compared to personal income per capita for each state compared to the nation as a whole.
d. The equity factor is determined based on variations in average per pupil expenditures among the LEAs in each state.
e. Funds provided to Basic Grants and Concentration Grants have fallen below their FY2001 levels, due in part to across-the board reductions and rescissions. In recent years, appropriators have divided funds not appropriated for Basic Grants and Concentration Grants evenly between Targeted Grants and EFIG.
Appendix B. ESEA Title I-A Appropriations
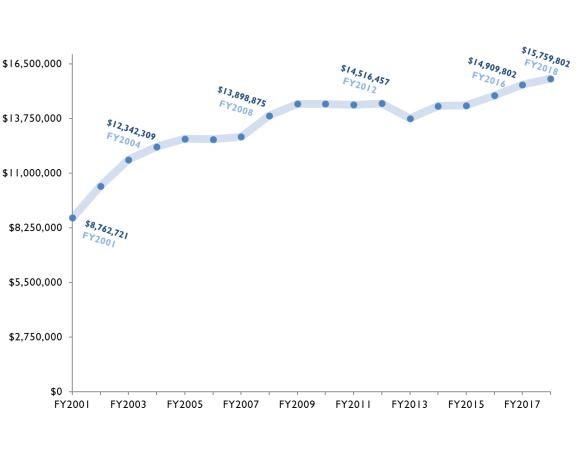
Figure B-1 and Table B-1 detail the appropriations levels for Title I-A since FY2001. Overall, after the No Child Left Behind Act of 2001 (NCLB; P.L. 107-110) reauthorized the ESEA, there was a steady increase in Title I-A appropriations through FY2005, and a second period of increasing appropriations from FY2007 to FY2009. There has also been an increase in appropriations from FY2013 through FY2018.
Table B-2 provides the appropriations level and share by Title I-A formula since FY2001. As previously discussed, all post-FY2001 increases in Title I-A appropriations have been divided between Targeted Grants and EFIG. Thus, the share of appropriations allocated via the Targeted Grant and EFIG formulas has been steadily increasing while the share of appropriations allocated via the Basic Grant formula has been steadily decreasing.
|
Figure B-1. ESEA Title I-A Appropriations Levels, FY2001-FY2018 Dollars in thousands |
 |
|
Source: Figure prepared by CRS, based on data available from the U.S. Department of Education, Budget Service. Notes: Appropriations provided in current (not constant) dollars. The appropriations level for FY2009 does not reflect the additional $10 billion for Title I-A appropriated through the American Recovery and Reinvestment Act (ARRA; P.L. 111-5). |
|
Current Dollars |
Constant FY2018 Dollars |
|||||
|
Fiscal Year |
Appropriations Level |
Difference from Prior Year |
Percentage Difference from Prior Year |
Appropriations Level |
Difference from Prior Year |
Percentage Difference from Prior Year |
|
2001 |
$8,762,721 |
― |
― |
$12,391,005 |
― |
― |
|
2002 |
$10,350,000 |
$1,587,279 |
18.11% |
$14,419,401 |
$2,028,396 |
16.37% |
|
2003 |
$11,688,664 |
$1,338,664 |
12.93% |
$15,910,864 |
$1,491,462 |
10.34% |
|
2004 |
$12,342,309 |
$653,645 |
5.59% |
$16,419,500 |
$508,637 |
3.20% |
|
2005 |
$12,739,571 |
$397,262 |
3.22% |
$16,408,631 |
-$10,869 |
-0.07% |
|
2006 |
$12,713,125 |
-$26,446 |
-0.21% |
$15,793,066 |
-$615,565 |
-3.75% |
|
2007 |
$12,838,125 |
$125,000 |
0.98% |
$15,582,918 |
-$210,148 |
-1.33% |
|
2008 |
$13,898,875 |
$1,060,750 |
8.26% |
$16,152,695 |
$569,777 |
3.66% |
|
2009a |
$14,492,401 |
$593,526 |
4.27% |
$16,897,218 |
$744,523 |
4.61% |
|
2010 |
$14,492,401 |
$0 |
0.00% |
$16,617,274 |
-$279,944 |
-1.66% |
|
2011 |
$14,442,927 |
-$49,474 |
-0.34% |
$16,132,493 |
-$484,781 |
-2.92% |
|
2012 |
$14,516,457 |
$73,530 |
0.51% |
$15,832,241 |
-$300,252 |
-1.86% |
|
2013 |
$13,760,219 |
-$756,238 |
-5.21% |
$14,767,027 |
-$1,065,214 |
-6.73% |
|
2014 |
$14,384,802 |
$624,583 |
4.54% |
$15,191,248 |
$424,221 |
2.87% |
|
2015 |
$14,409,802 |
$25,000 |
0.17% |
$15,170,517 |
-$20,731 |
-0.14% |
|
2016 |
$14,909,802 |
$500,000 |
3.47% |
$15,552,550 |
$382,033 |
2.52% |
|
2017 |
$15,459,802 |
$550,000 |
3.69% |
$15,802,080 |
$249,531 |
1.60% |
|
2018 |
$15,759,802 |
$300,000 |
1.94% |
$15,759,802 |
-$42,278 |
-0.27% |
Source: Table prepared by CRS, based on data available from the U.S. Department of Education, Budget Service.
Notes: Appropriations provided in current and constant dollars. Constant dollars are based on the Consumer Price Index—All Urban Consumers (CPI-U) for FY2018 using data available through July 2018.
a. Does not include the additional $10 billion for Title I-A appropriated through the American Recovery and Reinvestment Act (ARRA; P.L. 111-5).
|
Fiscal Year |
Appropriations Level or Share of Total Appropriations |
Basic Grants |
Concentration Grants |
Targeted Grants |
Education Finance Incentive Grants (EFIG) |
|
2001 |
Appropriations |
$7,397,690 |
$1,365,031 |
― |
― |
|
Share of Total |
84.42% |
15.58% |
― |
― |
|
|
2002 |
Appropriations |
$7,172,971 |
$1,365,031 |
$1,018,499 |
$793,499 |
|
Share of Total |
69.30% |
13.19% |
9.84% |
7.67% |
|
|
2003 |
Appropriations |
$7,111,635 |
$1,365,031 |
$1,670,239 |
$1,541,759 |
|
Share of Total |
60.84% |
11.68% |
14.29% |
13.19% |
|
|
2004 |
Appropriations |
$7,037,592 |
$1,365,031 |
$1,969,843 |
$1,969,843 |
|
Share of Total |
57.02% |
11.06% |
15.96% |
15.96% |
|
|
2005 |
Appropriations |
$6,934,854 |
$1,365,031 |
$2,219,843 |
$2,219,843 |
|
Share of Total |
54.44% |
10.71% |
17.42% |
17.42% |
|
|
2006 |
Appropriations |
$6,808,408 |
$1,365,031 |
$2,269,843 |
$2,269,843 |
|
Share of Total |
53.55% |
10.74% |
17.85% |
17.85% |
|
|
2007 |
Appropriations |
$6,808,408 |
$1,365,031 |
$2,332,343 |
$2,332,343 |
|
Share of Total |
53.03% |
10.63% |
18.17% |
18.17% |
|
|
2008 |
Appropriations |
$6,597,946 |
$1,365,031 |
$2,967,949 |
$2,967,949 |
|
Share of Total |
47.47% |
9.82% |
21.35% |
21.35% |
|
|
2009a |
Appropriations |
$6,597,946 |
$1,365,031 |
$3,264,712 |
$3,264,712 |
|
Share of Total |
45.53% |
9.42% |
22.53% |
22.53% |
|
|
2010 |
Appropriations |
$6,597,946 |
$1,365,031 |
$3,264,712 |
$3,264,712 |
|
Share of Total |
45.53% |
9.42% |
22.53% |
22.53% |
|
|
2011 |
Appropriations |
$6,579,151 |
$1,359,726 |
$3,252,025 |
$3,252,025 |
|
Share of Total |
45.55% |
9.41% |
22.52% |
22.52% |
|
|
2012 |
Appropriations |
$6,577,904 |
$1,362,301 |
$3,288,126 |
$3,288,126 |
|
Share of Total |
45.31% |
9.38% |
22.65% |
22.65% |
|
|
2013 |
Appropriations |
$6,232,639 |
$1,293,919 |
$3,116,831 |
$3,116,831 |
|
Share of Total |
45.29% |
9.40% |
22.65% |
22.65% |
|
|
2014 |
Appropriations |
$6,459,401 |
$1,362,301 |
3,281,550 |
3,281,550 |
|
Share of Total |
44.90% |
9.47% |
22.81% |
22.81% |
|
|
2015 |
Appropriations |
$6,459,401 |
$1,362,301 |
$3,294,050 |
$3,294,050 |
|
Share of Total |
44.83% |
9.45% |
22.86% |
22.86% |
|
|
2016 |
Appropriations |
$6,459,401 |
$1,362,301 |
$3,544,050 |
$3,544,050 |
|
Share of Total |
43.32% |
9.14% |
23.77% |
23.77% |
|
|
2017 |
Appropriations |
$6,459,401 |
$1,362,301 |
$3,819,050 |
$3,819,050 |
|
Share of Total |
41.78% |
8.81% |
24.70% |
24.70% |
|
|
2018 |
Appropriations |
$6,459,401 |
$1,362,301 |
$3,969,050 |
$3,969,050 |
|
Share of Total |
40.99% |
8.64% |
25.18% |
25.18% |
Source: Table prepared by CRS, based on data available from the U.S. Department of Education, Budget Service.
Notes: Appropriations provided in current (not constant) dollars. Percentages based on unrounded numbers.
a. Does not include the additional $10 billion for Title I-A appropriated through the American Recovery and Reinvestment Act (ARRA; P.L. 111-5).