Federal spending is divided into three broad categories: discretionary spending, mandatory spending, and net interest. Those categories are procedural—that is, how Congress provides or has provided spending authority differs among those categories. The Budget Enforcement Act of 1990 (BEA; P.L. 101-508) provides a statutory definition for those terms, which are therefore referred to as BEA categories. To large extent, however, the type of spending differs across those categories.
Discretionary spending, by and large, funds operations of federal agencies. Net interest spending is the government's interest payments on debt held by the public, offset by interest income that the government receives.
Major entitlement programs such as Social Security, Medicare, and Medicaid make up the bulk of mandatory spending. Other mandatory spending funds various income support programs, including Supplemental Security Income (SSI), unemployment insurance, and the Supplemental Nutrition Assistance Program (SNAP), as well as federal employee and military retirement and some veterans' benefits. In recent decades, mandatory spending has been the largest component of the federal budget.
What Is Mandatory Spending?
Mandatory spending is composed of budget outlays controlled by laws other than appropriations acts, including federal spending on entitlement programs.1 By contrast, discretionary spending is provided and controlled through appropriations acts.
Mandatory spending typically is provided in permanent or multi-year appropriations contained in an authorizing law. Authorizing legislation establishes or continues the operation of a federal program or agency, either indefinitely or for a specified period. Such funding becomes available automatically each year, without further legislative action by Congress. Some entitlement spending, such as for Medicaid, the Supplemental Nutrition Assistance Program (SNAP; formerly Food Stamps), and certain veterans' programs, is funded, but not controlled, in annual appropriations acts. Such entitlement spending is referred to as appropriated entitlements.
Mandatory spending tends to rise during economic downturns when incomes of many households fall. That increased spending can help stabilize aggregate demand in the economy, thus promoting macroeconomic stability.
Funding for Mandatory Spending
How mandatory programs are funded varies. Social Security is supported by payroll taxes paid by employers and employees, which are earmarked for trust funds from which benefits are paid. Medicare is funded by a combination of payroll taxes, beneficiary premiums, and general federal revenues.2 Medicaid is a joint federal-state program, in which the federal cost share is determined by a statutory formula.3 Retirement programs for those in federal service are supported by payroll deductions and contributions, as well as general revenues.4 Some other mandatory programs, such as veterans' income security benefits and agricultural subsidies, are typically funded from general revenues. Administrative costs of federal benefits programs are generally supported by discretionary funding, even if the benefits are paid out of mandatory funds.
Composition of Mandatory Spending
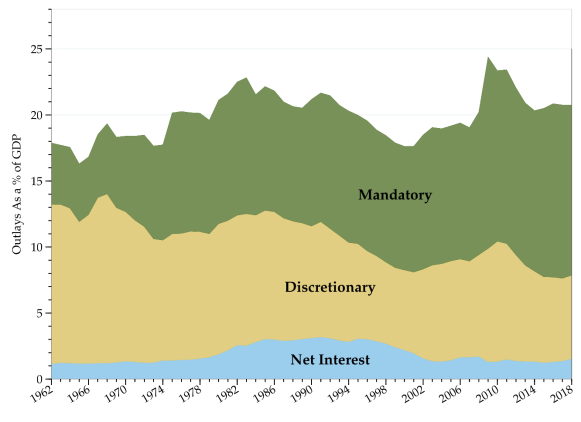
Figure 1 shows trends in mandatory, discretionary, and net interest spending since FY1962 as a share of gross domestic product (GDP). Spending trends are often shown as a share of GDP, which provides a simple way to adjust for inflation, population growth, and rising per capita income. In FY2018, mandatory spending was estimated to total $2,546 billion, which equaled 12.7% of gross domestic product (GDP). The estimated proportion for discretionary spending in FY2018 was 6.4%, or about half the level of mandatory spending.
|
Figure 1. Federal Outlays by Category Since FY1962 As a Percentage of GDP |
 |
|
Source: CRS calculations based on OMB data from the FY2019 budget submission. Notes: Outlays for FY2018 are estimated. |
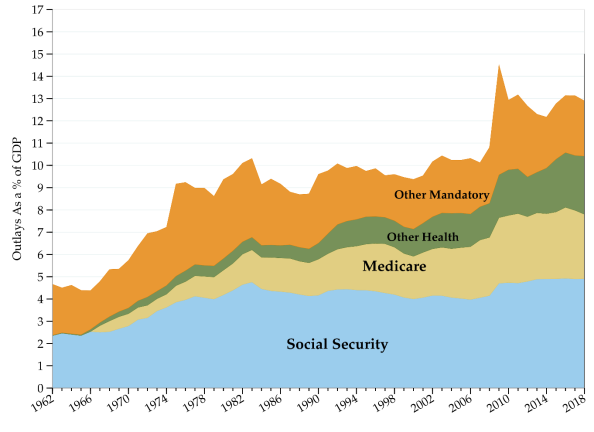
Figure 2 shows trends among major categories of mandatory spending. The growth in Social Security spending as a percentage of GDP reflects an expansion of the proportion of workers covered by the program, demographic changes, and changes in benefits. Medicare and Medicaid spending as a proportion of GDP has risen consistently since those programs were established in 1965. The Other Health category contains a variety of public health and related programs. Other mandatory spending includes costs of income security programs, such as the federal portion of unemployment insurance, along with certain veterans' programs, federal retirement, and several other smaller programs.
Mandatory Spending as Share of Total Federal Spending
In FY2018, mandatory spending accounts for an estimated 63% of total federal spending. Social Security alone accounts for about 24% of federal spending. Medicare and the federal share of Medicaid together account for another 26% of federal spending. Therefore, spending on Social Security, Medicare, and Medicaid now makes up about half of total federal spending.
In previous decades, mandatory spending accounted for a smaller share of federal outlays. In 1962, before the creation of Medicare and Medicaid, mandatory spending was less than 30% of all federal spending. At that time, Social Security accounted for about 13% of total federal spending or about half of all mandatory spending.
Baseline Projections of Mandatory Spending in the Next Decade
The Congressional Budget Office (CBO) calculates a current-law baseline which projects federal spending and receipts over a 10-year window. Projected mandatory spending trends reflect eligibility requirements, benefit formulas, economic trends, and changes in demographics. Table 1 presents a breakdown of mandatory spending in recent years along with April 2018 CBO current-law baseline projections.
|
|
|
|
|
|
|
|
|
|
|
|
|
|
|
|
|
||||||||||||||||
|
|
|
|
|
|
|
|
|
|
|
|
|
|
|
|
|
||||||||||||||||
|
|
|
|
|
|
|
|
|
|
|
|
|
|
|
|
|
||||||||||||||||
|
|
|
|
|
|
|
|
|
|
|
|
|
|
|
|
|
||||||||||||||||
|
|
|
|
|
|
|
|
|
|
|
|
|
|
|
|
|
||||||||||||||||
|
|
|
|
|
|
|
|
|
|
|
|
|
|
|
|
|
||||||||||||||||
|
|
|
|
|
|
|
|
|
|
|
|
|
|
|
|
|
||||||||||||||||
|
|
|
|
|
|
|
|
|
|
|
|
|
|
|
|
|
||||||||||||||||
|
|
|
|
|
|
|
|
|
|
|
|
|
|
|
|
|
||||||||||||||||
|
|
|
|
|
|
|
|
|
|
|
|
|
|
|
|
|
||||||||||||||||
|
|
|
|
|
|
|
|
|
|
|
|
|
|
|
|
|
||||||||||||||||
|
|
|
|
|
|
|
|
|
|
|
|
|
|
|
|
|
||||||||||||||||
|
|
|
|
|
|
|
|
|
|
|
|
|
|
|
|
|
||||||||||||||||
|
|
|
|
|
|
|
|
|
|
|
|
|
|
|
|
|
||||||||||||||||
|
|
|
|
|
|
|
|
|
|
|
|
|
|
|
|
|
||||||||||||||||
|
|
|
|
|
|
|
|
|
|
|
|
|
|
|
|
|
||||||||||||||||
|
|
|
|
|
|
|
|
|
|
|
|
|
|
|
|
|
||||||||||||||||
|
|
|
|
|
|
|
|
|
|
|
|
|
|
|
|
|
||||||||||||||||
|
|
|
|
|
|
|
|
|
|
|
|
|
|
|
|
|
||||||||||||||||
|
|
|
|
|
|
|
|
|
|
|
|
|
|
|
|
|
||||||||||||||||
|
|
|
|
|
|
|
|
|
|
|
|
|
|
|
|
|
||||||||||||||||
|
|
|
|
|
|
|
|
|
|
|
|
|
|
|
|
|
||||||||||||||||
|
Other |
|
|
|
|
|
|
|
|
|
|
|
|
|
|
|
||||||||||||||||
|
|
|
|
|
|
|
|
|
|
|
|
|
|
|
|
|
||||||||||||||||
|
|
|
|
|
|
|
|
|
|
|
|
|
|
|
|
|
||||||||||||||||
|
|
|
|
|
|
|
|
|
|
|
|
|
|
|
|
|
||||||||||||||||
|
|
|
|
|
|
|
|
|
|
|
|
|
|
|
|
|
||||||||||||||||
|
|
|
|
|
|
|
|
|
|
|
|
|
|
|
|
|
||||||||||||||||
|
|
|
|
|
|
|
|
|
|
|
|
|
|
|
|
|
||||||||||||||||
|
|
|
|
|
|
|
|
|
|
|
|
|
|
|
|
|
||||||||||||||||
|
|
|
|
|
|
|
|
|
|
|
|
|
|
|
|
|
||||||||||||||||
|
|
|
|
|
|
|
|
|
|
|
|
|
|
|
|
|
||||||||||||||||
|
|
|
|
|
|
|
|
|
|
|
|
|
|
|
|
|
||||||||||||||||
|
|
|
|
|
|
|
|
|
|
|
|
|
|
|
|
|
||||||||||||||||
|
|
|
|
|
|
|
|
|
|
|
|
|
|
|
|
|
||||||||||||||||
|
|
|
|
|
|
|
|
|
|
|
|
|
|
|
|
|
||||||||||||||||
|
|
|
|
|
|
|
|
|
|
|
|
|
|
|
|
|
||||||||||||||||
|
|
|
|
|
|
|
|
|
|
|
|
|
|
|
|
|
Source: CBO, Budget and Economic Outlook: 2018 to 2028, April 2018, previous Budget and Economic Outlook editions, and Office of Management and Budget data.
Notes: Items may not sum to totals due to rounding. Figures for FY2013-FY2017 are actual; figures for FY2018 are estimated; figures for FY2019-FY2027 are projected.
a. Excludes offsetting receipts.
b. Includes outlays for the American Opportunity credit and other tax credits.
c. Includes Temporary Assistance for Needy Families (TANF), the Child Support Enforcement program, the Child Care Entitlement program, and other programs.
d. Includes Civil Service, Foreign Service, Coast Guard, and other, smaller retirement programs as well as annuitants' health benefits.
e. Income security includes veterans' compensation, pensions, and life insurance programs. Other benefits are primarily education subsidies.
f. MERHCF is the Department of Defense Medicare-Eligible Retiree Health Care Fund, including TRICARE For Life.
g. The Administration records cash payments from Fannie Mae and Freddie Mac to the Treasury as offsetting receipts, while Treasury's payments to those entities are recorded as outlays (if any). CBO, however, treats the operations of these entities similar to other federal credit agencies and estimates their net lifetime cost (i.e., a subsidy cost adjusted for market risk) and records that as outlays for the program. The above table reflects the Administration's methodology for FY2014 and FY2015. Beginning in 2016, the table reflects CBO's estimate of net lifetime costs of the guarantees that those entities will issue and of the loans that they will hold.
h. Includes Medicare premiums and amounts paid by states from savings on Medicaid prescription drug costs.
Over the next decade, mandatory spending is projected to continue rising. By FY2022, if current trends continue, the sum of Medicare and Medicaid outlays would exceed all discretionary outlays.5 Moreover, Social Security outlays would also exceed discretionary outlays by FY2025, according to CBO baseline projections.6 By FY2028, mandatory spending is projected to reach 15% of GDP, while discretionary spending is projected to fall to 5.4% of GDP, its lowest level in modern history.
Much of the projected increase in mandatory spending stems from rising per capita health care costs and the demographic effects of an aging population.7 Baby Boomers—those born after World War II and before the early 1960s—are now retiring in large numbers. For instance, the number of retired workers receiving Social Security (Old Age and Survivors Insurance) benefits is projected to increase from 42.5 million in 2017 (latest actual data) to almost 55 million in 2025.8 In addition, the proportion of retirees over age 85—whose health care needs are typically greater than younger retirees—has been rising steadily, thus increasing the expected flow of federal benefits.
Health care costs per beneficiary have moderated in recent years. In both the public and private sectors, health care costs rose more slowly in the past decade relative to prior projections and average historical trends.9 While the moderation in growth of health care costs per beneficiary has improved the federal government's fiscal situation, concerns remain that health care cost growth could rebound.10
Mandatory Spending in Coming Decades
Over the long term, projections suggest that if current policies remain unchanged, the United States could face major fiscal imbalances. According to CBO's extended baseline projections, Social Security would grow from 4.9% of GDP in FY2018 to 6.0% of GDP by FY2028 and 6.3% by FY2048. Federal mandatory spending on health care is projected to expand from about 5.2% of GDP in FY2018 to 6.8% in FY2028 and to 9.2% by FY2048.11 CBO's extended baseline projections imply that the fiscal adjustment needed to stabilize the level of federal debt held by the public as a percentage of GDP at its current level (78%) would be about 1.9% of GDP for each future year. That adjustment in FY2019 would be equivalent to an 18% increase in federal revenues or a 14% cut in outlays, but could be made by a combination of revenue and spending policies.
Some federal trust funds, according to trustees' projections, would be exhausted in the next two decades. The Social Security Old Age and Survivors Insurance (OASI) trust fund would be exhausted in 2034 and the Social Security Disability Insurance (DI) trust fund would be exhausted by 2032 under current policies according to those projections.12 The Medicare Health Insurance (HI) trust fund, which supports Part A benefits, is projected to be exhausted in 2026.13 After trust funds were exhausted, programs would pay reduced levels of benefits supported by current revenues.14 The Medicare Supplemental Medical Insurance (SMI; Part B) trust fund is not vulnerable to exhaustion because of the structure of its funding, although rising Part B premiums and costs to the general fund could present other challenges.
Policy Options
Because discretionary spending is a smaller proportion of total federal outlays compared to mandatory spending, some budget experts contend that significant reductions in federal spending would have to include cuts in mandatory spending programs. Some contend that further reductions in discretionary spending—now at historically low levels as a share of the economy—would hinder federal agencies' ability to meet national priorities. In addition, some policymakers argue that higher taxes needed to finance projected future mandatory spending trajectories would slow economic growth.
Other budget and social policy experts contend that changes in social insurance programs should be considered on their own merits, and should not bear the burden of larger budgetary adjustments. Many mandatory programs—including Social Security, Medicare, and Medicaid—play key roles in individuals' retirement. Sudden changes in such programs could disrupt retirement plans of many citizens. Reflecting the long-term perspective inherent in retirement decisionmaking, Social Security finances were designed so that benefits are paid from federal trust funds derived from payroll taxes rather than general revenues. More generally, in that view, curtailing entitlement program eligibility or benefits would compromise program goals: the economic security of the elderly and the poor.