Figure 1. Number of Days from Nomination to Final Vote
(Nominees Receiving a Final Vote from 1975 to 2017)
Source: Congressional Research Service.
After the Senate Judiciary Committee reports a Supreme Court nomination, it is placed on the Senate Executive Calendar (to be considered in executive session). Senate consideration of a Supreme Court nomination includes floor debate on the nomination, as well as a final vote by the Senate on whether to approve it. When floor debate on a nomination ends, the presiding officer puts the question of confirmation to a vote. A roll call vote to confirm requires a simple majority of Senators present and voting, a quorum being present. Since 1967, beginning with the confirmation of Thurgood Marshall, every Senate vote on whether to confirm a Supreme Court nomination has been by roll call (prior to 1967, most confirmation votes were by voice vote).
This Insight provides an overview of several issues related to final confirmation votes by the Senate on Supreme Court nominations. For additional information on these and other issues (including floor procedures for considering a nomination), see CRS Report R44234, Supreme Court Appointment Process: Senate Debate and Confirmation Vote.
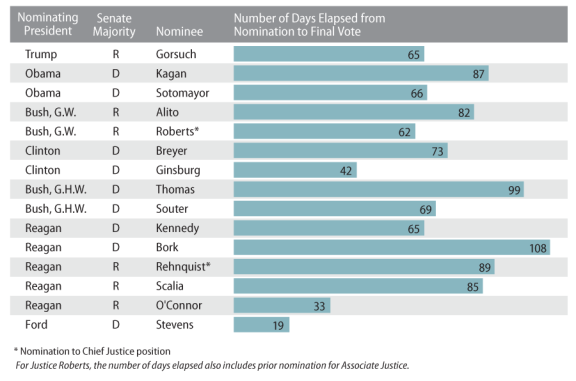
Historically, there has been variation in the length of time from a President nominating a person to fill a Supreme Court vacancy to a final Senate vote on that nomination. For nominees since 1975 who have received a final vote, Figure 1 shows the number of calendar days that elapsed from the date on which the nomination was formally submitted to the Senate to the date on which the Senate voted whether to approve the nomination.
Of the 15 nominees listed in the figure, Robert Bork waited the greatest number of days (108) from nomination to a final Senate vote—followed by Clarence Thomas (99). John Paul Stevens waited the fewest number of days (19)—followed by Sandra Day O'Connor (33).
Overall, the average number of days from nomination to final Senate vote for these nominees is 69.6 days (or approximately 2.3 months), while the median is 69.0 days.
From the date that Judge Brett Kavanaugh was nominated to the publication date of this Insight (September 13, 2018), the Kavanaugh nomination has been pending in the Senate for 65 days.
|
Figure 1. Number of Days from Nomination to Final Vote (Nominees Receiving a Final Vote from 1975 to 2017) |
|
|
Source: Congressional Research Service. |
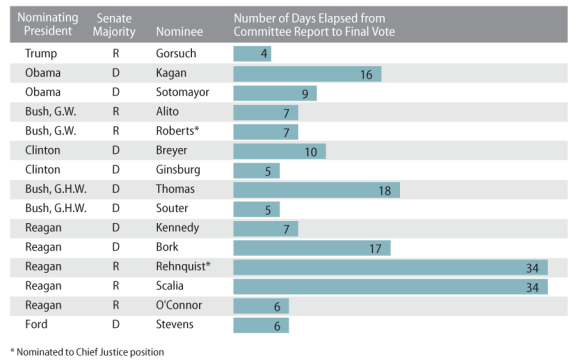
There has also been variation in the length of time nominees to the Court have waited for a final vote after being reported by the Judiciary Committee. Figure 2 shows, for nominees since 1975 who received a final floor vote, the number of calendar days that elapsed from the date on which the nomination was reported by the Judiciary Committee to the date on which the Senate voted whether to approve the nomination.
Of the 15 nominees listed in the figure, William Rehnquist and Antonin Scalia waited the greatest number of days (34) from committee report to a final Senate vote, while Neil Gorsuch waited the fewest number of days (4). The Rehnquist and Scalia nominations were reported by the committee the day before the start of the August recess in 1986, which likely lengthened the amount of time from committee report to final vote for both nominations.
Overall, the average number of days from committee report to final Senate vote for these nominees is approximately 12 days, while the median is 7 days.
|
Figure 2. Number of Days from Committee Report to Final Vote (Nominees Reported by Judiciary Committee from 1975 to 2017) |
 |
|
Source: Congressional Research Service. |
The first roll call vote that resulted in a Supreme Court nominee being approved by the Senate occurred in 1796 (the nine successful nominations to the Court prior to 1796 were approved by voice vote). Overall, from 1796 to 2017 there have been 50 nominations approved by roll call vote (with all other successful nominations approved by voice vote). Of the 50 nominations, 18 (36%) were approved from 1796 to 1899; 13 (26%) from 1900 to 1966; and 19 (38%) from 1967 to 2017.
From 1796 to 2017, the Senate varied in size from 32 to 100 seats. For the purposes of this Insight, the percentage of Senators voting in opposition to a nomination is calculated as a percentage of all Senators voting on a nomination (not as a percentage of the number of Senate seats, although for practical purposes the number of Senators voting on a nomination was typically the same as or similar to the number of Senate seats).
The level of opposition to Supreme Court nominations approved by the Senate, as measured by the percentage of Senators voting against a nomination, has been relatively greater in recent years than in the past.
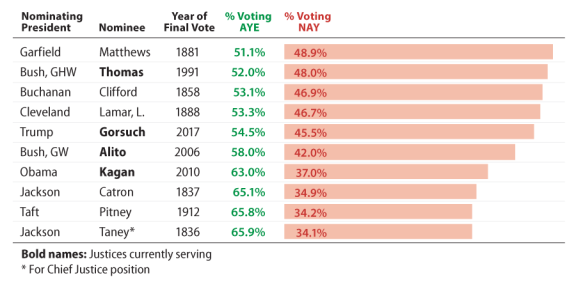
Of the 50 nominations, Figure 3 identifies the 10 for which the greatest percentage of Senators voted to oppose it. Of the 10 nominees listed in the figure, 4 are currently serving on the Court. The nominations of Justices Thomas, Gorsuch, Alito, and Kagan were opposed by 48.0%, 45.5%, 42.0%, and 37.0% of Senators, respectively. Additionally, the nominations of two other current Justices, Sonia Sotomayor and John Roberts Jr., rank among the 20 nominations (of 50) that received the most opposition from Senators.
|
Figure 3. Ten U.S. Supreme Court Nominations Approved by the Senate That Had Greatest Percentage of Senators Voting Against Nomination (1796-2017) |
 |
|
Source: Congressional Research Service. |
For the 50 nominations, the median percentage of Senators voting "nay" on a nomination was 16.6% (with 6 nominations not receiving any nay votes—including the nomination of former Justice Kennedy). The Senate vote in 1988 on the nomination of Anthony Kennedy was the sole occurrence, of the 10 Supreme Court nominees approved by roll call from 1988 to 2017, of a nominee whose nomination did not receive any nay votes at the time of confirmation.