Introduction
The Department of Defense (DOD) has long relied on contractors to provide the U.S. military with a wide range of goods and services, including weapons, vehicles, food, uniforms, and operational support. Without contractor support, the United States would not be able to arm and field an effective fighting force. Costs and trends associated with contractor support provide Congress more information upon which to make budget decisions and weigh the relative costs and benefits of different force structures and different military operations—including contingency operations and maintaining bases around the world.
This report examines (1) how much money DOD obligates on contracts, (2) what DOD is buying, and (3) where that money is being spent. This report also examines the extent to which these data are sufficiently reliable to use as a factor when developing policy or analyzing government operations.
Related CRS products include CRS In Focus IF10887, The FY2019 Defense Budget Request: An Overview, by Brendan W. McGarry, and CRS Report R44329, Using Data to Improve Defense Acquisitions: Background, Analysis, and Questions for Congress, by Moshe Schwartz.
How Much DOD Spends on Contract Obligations
When Congress appropriates money, it provides budget authority—the authority to enter into obligations. Obligations occur when agencies enter into contracts, submit purchase orders, employ personnel, or otherwise legally commit to spending money. Outlays occur when obligations are liquidated (primarily through the issuance of checks, electronic fund transfers, or the disbursement of cash).1
|
How Are Government Contract Data Tracked? The Federal Procurement Data System—Next Generation (FPDS)—is a central database of U.S. government-wide procurement. The purpose of FPDS is to provide data that can be used as "a basis for recurring and special reports to the President, the Congress, the Government Accountability Office, Federal executive agencies, and the general public."2 The contract data in this report come from the FPDS database. FPDS generally reports information on contracts that exceed the micro-purchase threshold, defined in 48 C.F.R. §2.101.3 The micro-purchase threshold is generally $10,000 (meaning that contract actions above this amount must be reported to FPDS).4 FPDS does not include data from judicial branch agencies, the legislative branch, certain DOD components, or select executive branch agencies—such as the Central Intelligence Agency and National Security Agency.5 Unless otherwise indicated, all data in this report are derived from FPDS. Due to concerns over data reliability (see below) and what information is submitted to the system, data from FPDS are used in this report to identify broad trends and rough estimations. FPDS contains data from 1978 to the present. For a more detailed discussion on how FPDS operates, see Appendix A. |
In FY2017, the U.S. federal government obligated $507 billion for contracts for the acquisition of goods, services, and research and development. The $507 billion obligated on contracts was equal to approximately 13% of total FY2017 federal budget outlays of $3.98 trillion.6 As noted in Figure 1, in FY2017 DOD obligated more money on federal contracts ($320 billion) than all other federal agencies combined. DOD's obligations were equal to 8% of all federal spending.
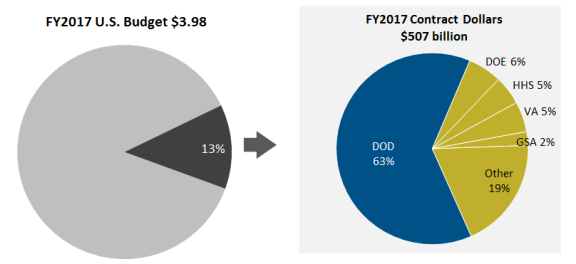
From FY2010 to FY2017, the federal government obligated both a smaller amount of money and a smaller percentage of the overall budget to contract acquisitions. In addition, the DOD share of overall contract obligations decreased relative to the rest of the federal government (see Table 1).
|
FY2010 |
FY2017 |
|
|
Total government contract obligations |
$618 billion |
$507 billion |
|
Total contract obligations as percent of budget |
16% |
13% |
|
DOD share of contract obligations |
65% |
63% |
|
DOD contract obligations as percentage of federal spending |
10% |
8% |
Trends in DOD Contract Obligations
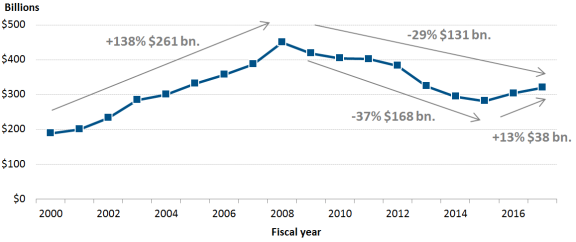
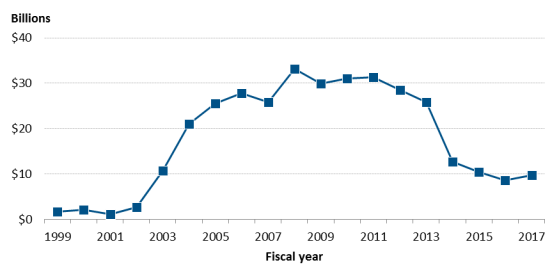
From FY2000 to FY2017, adjusted for inflation (FY2017 dollars), DOD contract obligations increased from $189 billion to $320 billion. However, the increase in spending has not been steady. DOD contracting was marked by a steep increase in obligations from FY2000 to FY2008 (an increase of $261 billion or 138%), followed by a drop in obligations (a decrease of $131 billion or 29%) from FY2008 to FY2017 (see Figure 2).
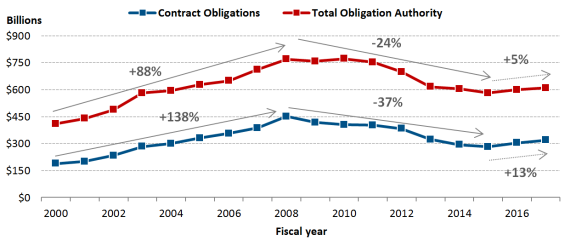
Contract obligation trends are generally consistent with—but still steeper than—overall DOD obligation authority trends. For example, DOD total obligation authority (including contracts as well as all other obligations) increased significantly from FY2000 to FY2008, and decreased from FY2008 to FY2015, and then increased again from FY2015-FY2017 (see Figure 3).
Some analysts believe that this trend of rapid contract spending increases (averaging 11.5% annual increases), followed by a relatively sharp cut in contract spending from FY2008-FY2015 (averaging 6.5% annual decreases), puts DOD at increased risk of making short-term budget decisions (aimed at meeting budget caps) that could cause long-term harm.7 Limits on DOD funding resulting from the Budget Control Act required DOD to implement significant spending cuts that were not the result of deliberate and strategic planning.8 A more gradual reduction in spending, or additional funding in select budget categories, could help DOD make more gradual spending reductions and more considered choices. This could potentially minimize hazardous, long-term effects of budget cuts.9
DOD vs. Rest of Government Contracting Trends
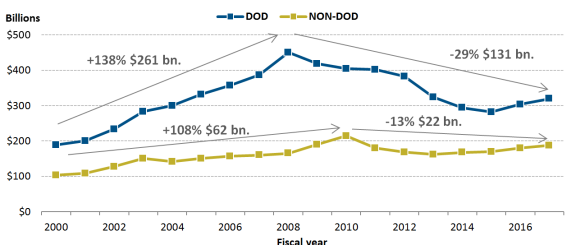
The rise and fall of DOD contract spending may make budgeting more difficult than in the rest of the federal government, which has had more gradual increases and less drastic cuts (see
Figure 4).10
|
Figure 4. DOD vs. Rest of Government Contract Obligations, FY2000-FY2017 FY2017 Dollars |
 |
|
Source: CRS analysis of Federal Procurement Data System-Next Generation, January 2018. |
What DOD Buys
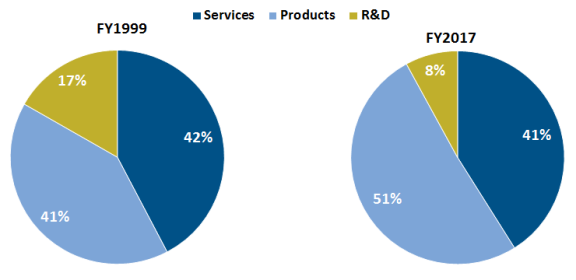
In FY2017, 41% of total DOD contract obligations were for services, 51% for goods, and 8% for research and development (R&D). This is in contrast to the rest of the federal government (excluding DOD), which obligated a significantly larger portion of contracting dollars on services (71%) than on goods (21%) or research and development (8%).
|
How Are Contracts Categorized? FPDS categorizes contracts by product or service codes. According to FPDS, "These product/service codes are used to record the products and services being purchased by the Federal Government. In many cases, a given contract/task order/purchase order will include more than one product and/or service. In such cases, the product or service code data element code should be selected based on the predominant product or service that is being purchased. For example, a contract for $1000 of lumber and $500 of pipe would be coded under 5510, Lumber & Related Wood Materials." Because FPDS contracts are associated with only a single product or service code—even when the contract involves substantial deliveries of other products or services—the analysis in this report should be used only to identify broad overall trends. |
Source: U.S. General Services Administration Office of Governmentwide Policy, Federal Procurement Data System Product and Service Codes Manual, October 1, 2015, p. 6, at https://www.fpds.gov/downloads/top_requests/PSC_Manual_FY2016_Oct1_2015.pdf. This is the most recent version of the manual.
For almost 20 years, DOD has dedicated an ever-smaller share of contracting dollars to R&D, with such contracts dropping from 17% of total contract obligations in FY1999 to 8% in FY2017. (See Figure 5. For a breakout of obligations trends by product service code, see Appendix B.)
 |
|
Source: CRS analysis of Federal Procurement Data System-Next Generation, January 2018. |
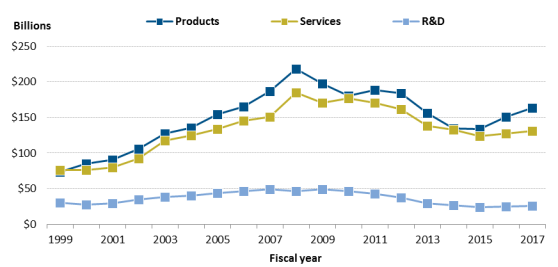
The relative decrease in R&D contracts manifests as both a percentage of overall spending and in terms of constant dollars. Despite increased spending on R&D from FY2000 to FY2007, adjusted for inflation (in FY2017 dollars), DOD obligated less money on R&D contracts in FY2017 ($25 billion) than it invested more than 15 years earlier ($28 billion in FY2000). In contrast, over the same period, DOD obligations to acquire both goods and services are substantially higher (see Figure 6).
|
Figure 6. DOD Contract Obligations Dedicated to R&D, FY1999-FY2017 FY2017 Dollars |
 |
|
Source: CRS analysis of Federal Procurement Data System-Next Generation, January 2018. |
DOD Spending on Research, Development, Test, and Evaluation (RDT&E)
Research and Development contracting is but a portion of overall DOD investment in developing technology. For example, DOD uses grants to support much of its research at universities. More than half of DOD's basic research budget is spent at universities and represents the major contribution of funds in some areas of science and technology.11 Taken as a whole, the R&D picture looks somewhat different.12
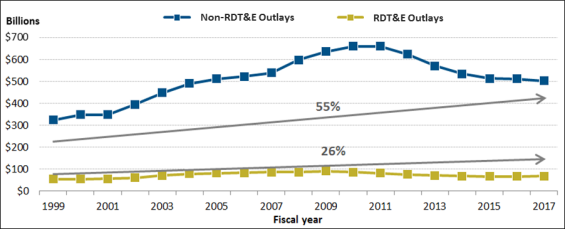
Total outlays for RDT&E increased 67% in constant dollars from FY1999 to FY2009, before dropping 24% from FY2009 to FY2017. However, as reflected in Figure 7, since FY1999, RDT&E outlays increased at a much slower rate (26%) than non-RDT&E (55%).
Where DOD Obligates Contract Dollars
DOD relies on contractors to support operations worldwide, including operations in Afghanistan, permanently garrisoned troops overseas, and ships docking at foreign ports. Because of its global footprint, this report will look at where DOD obligates contract dollars in two ways:
- 1. by geographic region, and
- 2. domestic vs. overseas.
|
What Is Place of Performance? FPDS defines place of performance as "the location of the principal plant or place of business where the items will be produced, supplied from stock, or where the service will be performed."13 Foreign place of performance is defined as work produced, supplied, or performed primarily outside of the United States or its territories. According to DOD, FPDS is required to collect only the predominant place of performance for contract actions. Because FPDS lists only one country for place of performance, contracts listed as being performed in one country can also involve substantial performance in other countries. In 2012, GAO noted that FPDS's inability to provide more granular data entry and analysis limited the "utility, accuracy, and completeness" of the data.14 In more recent years, however, GAO has determined that FPDS data are "sufficiently reliable for examining trends" in DOD contracting.15 |
By Geographic Region
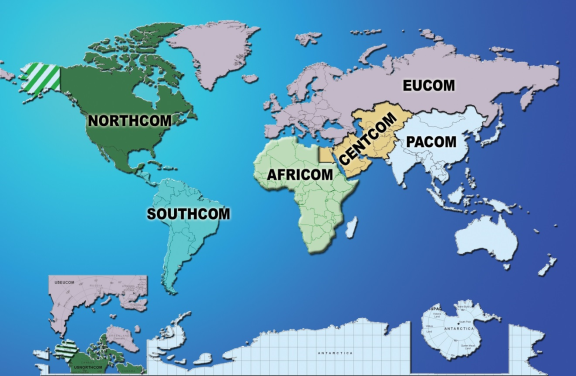
DOD divides its geographic responsibilities among six Unified Combatant Commands:16
- 1. U.S. Northern Command (NORTHCOM),17
- 2. U.S. Africa Command (AFRICOM),
- 3. U.S. Central Command (CENTCOM),18
- 4. U.S. European Command (EUCOM),
- 5. U.S. Indo-Pacific Command (INDOPACOM), which includes Hawaii and a number of U.S. territories,19 and
- 6. U.S. Southern Command (SOUTHCOM).20
 |
|
Source: Map published by Defense Procurement and Acquisition Policy, "Areas of Responsibility" at http://www.acq.osd.mil/dpap/pacc/cc/areas_of_responsibility.html. Map published prior to the renaming of PACOM. Note: As indicated in this report, PACOM is now INDOPACOM. |
These commands do not control all DOD contracting activity that occurs within their respective geographic regions. For example, Transportation Command (TRANSCOM), headquartered at Scott Air Force Base, IL, may contract with private companies to provide transportation services within CENTCOM's Area of Responsibility (AOR). For purposes of this report, DOD contract obligations are categorized by the place of performance, not the DOD component that signed the contract or obligated the money. For example, all contract obligations for work in the CENTCOM AOR will be allocated to CENTCOM, regardless of which DOD organization signed the contract.
In FY2017, 92.8% of DOD contracts were performed in NORTHCOM (which includes the Bahamas, Canada, and Mexico). DOD obligated 3.1% of total contract work in CENTCOM, followed by INDOPACOM (2.1%), EUCOM (1.7%), AFRICOM (0.1%), and SOUTHCOM (0.1%).
Domestic vs. Overseas
Since 2008, DOD obligations for domestic contracts dropped by 26% from a high of $401 billion in FY2008 to some $299 billion in FY2017 dollars; obligations for overseas contracts (in non-US or US affiliated territories) dropped by 58%, from $49 billion in FY2008 to $21 billion in FY2017. The drop in overseas obligations stems primarily from drawdowns in the Iraq and Afghanistan theaters, where contract obligations decreased from $33 billion in FY2008 to $10 billion in FY2017 (Figure 9).21
|
Figure 9. Contract Obligations in Iraq and Afghanistan Theaters FY2017 Dollars |
 |
|
Source: CRS analysis of Federal Procurement Data System-Next Generation, January 2018. |
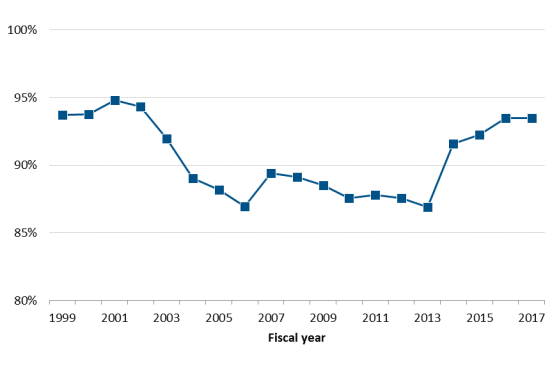
Concurrent with the drawdowns in Iraq and Afghanistan, in recent years the share of DOD contract obligations performed in the United States has increased. In FY2017, 93% of DOD contract obligations were for work performed in the United States, the highest percentage since FY2002 (see Figure 10).22
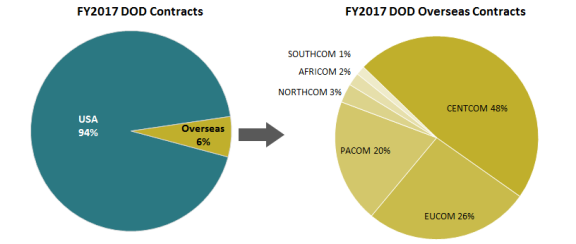
Despite the drawdown in Iraq and Afghanistan, in FY2017 DOD contract obligations for workperformed overseas were still primarily steered to CENTCOM (48%), followed by EUCOM(26%), INDOPACOM (20%), NORTHCOM (3%), AFRICOM (2%), and SOUTHCOM (1%) (Figure 11). Of the top 20 countries where DOD contractors perform work abroad, eight were in CENTCOM, eight were in EUCOM, three were in INDOPACOM, and one was in NORTHCOM (Appendix C).
|
Figure 11. DOD Contract Obligations for Work Performed in Combatant Command Areas of Responsibility |
 |
|
Source: CRS analysis of Federal Procurement Data System-Next Generation, January 2018.. |
However, a significant shift in where contracting dollars are allocated appears to be under way. Action obligations for CENTCOM and EUCOM have declined since FY2008, while INDOPACOM and AFRICOM dollars have increased (see Table 2).
|
Unified Combatant Command |
FY2008 |
FY2017 |
Change |
|
CENTCOM |
$33,294 |
$9,875 |
-70% |
|
EUCOM |
$10,504 |
$5,455 |
-48% |
|
INDOPACOM |
$3,030 |
$4,084 |
35% |
|
NORTHCOM |
$1,336 |
$625 |
-53% |
|
AFRICOM |
$317 |
$427 |
35% |
|
SOUTHCOM |
$423 |
$297 |
-30% |
The trend of dedicating more resources to INDOPACOM began under the Obama Administration and has continued under the Trump Administration. This is consistent with the release of the 2018 National Military Strategy, which states
Long-term strategic competitions with China and Russia are the principal priorities for the department, and require both increased and sustained investment, because of the magnitude of the threats they pose to U.S. security and prosperity today, and the potential for those threats to increase in the future. 23
DOD Overseas Obligations vs. Rest of Government
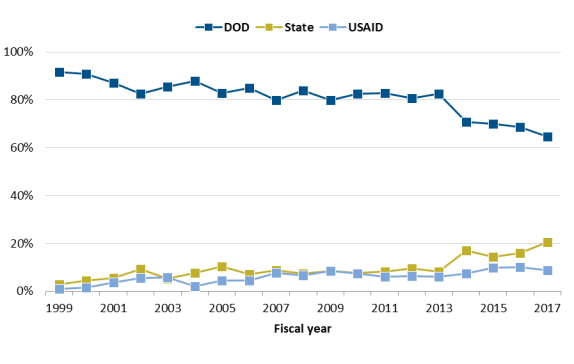
DOD's share of total government obligations for contracts performed abroad has trended down from 92% in FY1999 to 65% in FY2017. Over the same period, combined Department of State and USAID contract obligations increased from 4% to 29% of all U.S. government overseas obligations (see Figure 12).
A number of analysts have argued that as a result of its larger budget and workforce, DOD often undertakes traditionally civilian missions because other agencies do not have the necessary resources to fulfill those missions.24 Some argue that more resources should be invested into civilian agencies to allow them to play a larger role in conflict prevention, post-conflict stabilization, and reconstruction. In 2010, the Senate Foreign Relations Committee majority staff wrote, "The civilian capacity of the U.S. Government to prevent conflict and conduct post-conflict stabilization and reconstruction is beset by fragmentation, gaps in coverage, lack of resources and training, coordination problems, unclear delineations of authority and responsibility, and policy inconsistency."25
Many of these analysts have argued that to achieve its foreign policy goals, the United States needs to take a more whole-of-government approach that brings together the resources of, among others, DOD, the Department of State, and USAID—and government contractors.26 Contract obligations since FY2000 may indicate a shift toward a whole-of-government approach to achieving foreign policy objectives.
Reliability of Data on Contract Obligations
The GAO, CRS, and other organizations have raised some concerns about the accuracy of procurement data retrieved from the Federal Procurement Data System (FPDS). For detailed information on the history of FPDS data validity concerns, see Appendix A.
Appendix A. FPDS Background, Accuracy Issues, and Future Plans
According to the Federal Acquisition Regulation, FPDS can be used to measure and assess "the effect of Federal contracting on the Nation's economy and ... the effect of other policy and management initiatives (e.g., performance based acquisitions and competition)."27 FPDS is also used to meet the requirements of the Federal Funding Accountability and Transparency Act of 2006 (P.L. 109-282), which requires all federal award data to be publicly accessible.
Congress, legislative and executive branch agencies, analysts, and the public all rely on FPDS as the primary source of information for understanding how and where the federal government spends contracting dollars. Congress and the executive branch rely on the information to help make and oversee informed policy and spending decisions. Analysts and the public rely on the data in FPDS to conduct analysis and gain visibility into government operations.
Data reliability is essential to the utility of FPDS. As GAO has stated, "[R]eliable information is critical to informed decision making and to oversight of the procurement system."28 According to officials within the White House's Office of Federal Procurement Policy, "[c]omplete, accurate, and timely federal procurement data are essential for ensuring that the government has the right information when planning and awarding contracts and that the public has reliable data to track how tax dollars are being spent."29 If the data contained in FPDS are not sufficiently reliable, the data may not provide an appropriate basis for measuring or assessing federal contracting, making policy decisions, or providing transparency into government operations. The result could be the implementation of policies that squander resources and waste taxpayer dollars. According to GAO, "[f]ederal agencies are responsible for ensuring that the information reported in [the FPDS] database is complete and accurate."30
History of FPDS
On August 30, 1974, Congress enacted the Office of Federal Procurement Policy Act, which established an Office of Federal Procurement Policy (OFPP) within OMB and required the establishment of "a system for collecting, developing, and disseminating procurement data which takes into account the needs of Congress, the executive branch, and the private sector."31 One of the goals of establishing a system for tracking procurement data was to "promote economy, efficiency, and effectiveness in the procurement of property and services."32
In February 1978, the OFPP issued a government-wide memorandum that designated the Department of Defense as the executive agent to operate the Federal Procurement Data System.33 Agencies were instructed to begin collection of procurement data on October 1, 1978, and to report the data to DOD in February 1979.34 Since 1982, the GSA has operated the system on behalf of the OFPP.35 Today, FPDS is the only government-wide system that contains all publicly available federal procurement data. FPDS data are used by other federal-spending information resources, including USASpending.gov.
Almost from FPDS's inception, the GAO expressed concerns about the accuracy of the information in the database.36 OMB attempted to eliminate many of the errors in FPDS by introducing a successor system—the Federal Procurement Data System-Next Generation (FPDS), which began operation on October 1, 2003.37 FPDS was to "rely less on manual inputs and more on electronic 'machine-to-machine' approaches."38 Despite the systems update, GAO said "[i]nformation in FPDS can only be as reliable as the information agencies enter though their own systems."39
In September 29, 2009, testimony before the Senate Homeland Security and Governmental Affairs Subcommittee on Contracting Oversight, William T. Woods, GAO's Director of Acquisition and Sourcing Management, said the following about FPDS information:
Our past work has found that federal contracting data systems, particularly FPDS-NG, contain inaccurate data. FPDS-NG is the primary government contracting data system for obligation data. Despite its critical role, GAO and others have consistently reported on FPDS-NG data quality issues over a number of years.40
A 2012 GAO report reiterated its finding that DOD needs to "obtain better data on its contracted services to enable it to make more strategic workforce decisions and ensure that it maintains appropriate control of government operations."41 And a 2015 report by the Inspector General of the Department of Commerce found that "the Department needs to improve (a) its process for entering accurate and reliable data into FPDS-NG."42
Data Reliability Concerns Persist
According to GSA, agencies are required to validate their data annually. Agency statements regarding data accuracy are independent of the FPDS systems and outside the authority of GSA. For DOD specifically, components (at the service branch level) are required to submit to Defense Procurement and Acquisition Policy (DPAP) an annual certification of reported data, summary of data verification and validation efforts, and Agency FPDS Data Quality Certifications.43
Continued concerns raised over the reliability of data have prompted many analysts to rely on FPDS primarily to identify broad trends and make rough estimations. According to one GAO report
DOD acknowledged that using FPDS-NG as the main data source for the inventories has a number of limitations. These limitations include that FPDS-NG does not provide the number of contractor FTEs performing each service, identify the requiring activity, or allow for the identification of all services being procured.44
Officials from the GSA, the agency that administers FPDS, stated that data errors in FPDS do not substantively alter the larger context of 1.4 million actions and billions of dollars of obligations entered into the system by DOD every year. Officials have also indicated that whenever possible and feasible, steps are taken to improve the reliability and integrity of the data contained in FPDS. For example, in early 2016, CRS noted discrepancies in reported contract obligations associated with public-private competitions under OMB Circular A-76.45 Despite a prohibition on new public-private competitions under Circular A-76 (see P.L. 111-8, the FY2009 Omnibus Appropriations Bill), FPDS reported a large number of contracts in this category in each subsequent fiscal year. DOD reported that A-76 contracts, for example, represented approximately 1% of all contract obligations in FY2013, FY2014, and FY2015 (roughly $3 billion in each fiscal year).46 When asked for clarification, DOD's Defense Procurement and Acquisition Policy office stated that the majority of these contract obligations were in fact coding errors in FPDS.47 That same year, CRS observed that DOD's FPDS-reported A-76 obligations were restated, to approximately $150 million per year from FY2013 to FY2015.
Despite the limitations of FPDS, imperfect data may be better than no data. Some observers say that despite its shortcomings, FPDS is one of the world's leading systems for tracking government procurement data. FPDS data can be used to identify some broad trends and rough estimations, or to gather information about specific contracts. Understanding the limitations of data—knowing when, how, and to what extent to rely on data—could help policymakers incorporate FPDS data more effectively into their decisionmaking process.
Appendix B. Obligations Trends by PSC
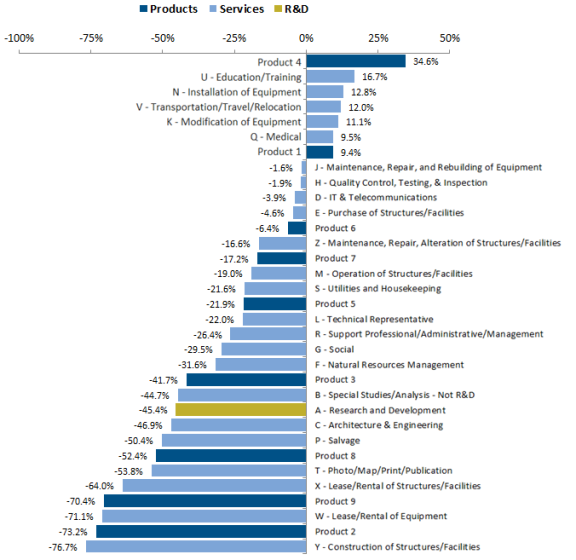
Product and service codes (PSCs) are used "to describe the products, services, and research and development (R&D) purchased by the federal government."48 FPDS sorts contract obligations into 33 overarching PSCs: nine product codes, 23 service codes, and one R&D code. Each of the nine product codes are represented by numbers from 1-9. Each of the service codes is represented by a single letter, and R&D is represented by the letter "A." Figure B-1 depicts changes in DOD contract obligations by PSC, from FY2008-FY2015.
Each of the 33 PSCs for services has a description identifying the types of contracts contained in the category; the nine PSCs for products do not have a description. Without a clear and logical system for categorizing products into overarching PSC categories—including descriptions for each category—sorting such data is of limited value. To better understand what is contained in each product category, see the notes for Figure B-1.
Appendix C. Top 20 Foreign Countries Where DOD Obligates Contracting Dollars
Table C-1. Top 20 Foreign Countries (FY2017) by Action Obligations
and Place of Performance
FY2017 Dollars in Millions
|
Country |
COCOM |
FY2017 (Top 20) |
FY2008 |
|
Afghanistan |
CENTCOM |
$3,027 |
$6,861 |
|
Japan |
INDOPACOM |
$2,198 |
$985 |
|
Germany |
EUCOM |
$2,006 |
$3,310 |
|
Kuwait |
CENTCOM |
$1,963 |
$4,786 |
|
South Korea |
INDOPACOM |
$1,312 |
$1,701 |
|
United Arab Emirates |
CENTCOM |
$1,309 |
$1,287 |
|
Iraq |
CENTCOM |
$1,133 |
$17,447 |
|
United Kingdom |
EUCOM |
$958 |
$2,102 |
|
Saudi Arabia |
CENTCOM |
$954 |
$364 |
|
Canada |
NORTHCOM |
$562 |
$1,244 |
|
Qatar |
CENTCOM |
$486 |
$455 |
|
Bahrain |
CENTCOM |
$401 |
$1,293 |
|
Italy |
EUCOM |
$362 |
$756 |
|
Spain |
EUCOM |
$305 |
$244 |
|
Greece |
EUCOM |
$271 |
$898 |
|
Israel |
CENTCOM |
$257 |
$199 |
|
Belgium |
EUCOM |
$251 |
$101 |
|
Turkey |
EUCOM |
$192 |
$187 |
|
France |
EUCOM |
$158 |
$274 |
|
Hong Kong (China) |
INDOPACOM |
$152 |
$16 |
Source: CRS analysis of Federal Procurement Data System-Next Generation, January 2018.
Notes: Table provides FY2008 amounts for comparison. FY2008 column does not include all top 20 countries (by action obligation) for that year.