Figure 1. Net Growth in U.S. Private-Sector Credit
Annual, 1998-2017
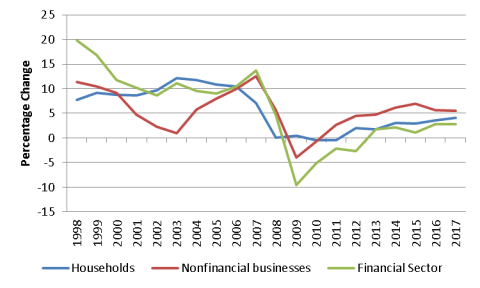
Source: Federal Reserve, Financial Accounts of the United States, Table D. 1.
Credit (debt) plays a crucial role in economic performance by funneling the funds of savers to borrowers. Up to a point, credit growth is necessary for healthy economic growth. But if credit grows too quickly, it can exacerbate economic instability by amplifying a financial boom and bust cycle. For example, the credit boom associated with the last decade's housing bubble was followed by the 2007-2009 financial crisis, which featured a sharp contraction in credit that was both a cause and symptom of the Great Recession and the sluggish economic recovery that followed. As the economy has improved in recent years, this Insight examines to what extent credit has rebounded from the financial crisis.
Private-sector borrowers can be divided into three groups—households, nonfinancial businesses, and the financial sector. As shown in Figure 1, net credit (new debt less repaid debt) to these three groups grew fairly rapidly during the 2001-2007 economic expansion. Credit then shrank for several years—well into the current economic expansion, which began in June 2009. This decline can be contrasted to the milder 2001 recession, when credit continued increasing.
Credit growth has resumed in recent years. But debt levels did not surpass their previous peak until 2015 for households and 2012 for nonfinancial businesses, and they are still about $2 trillion below their previous peak for the financial sector. At present, credit growth for all three sectors remains below average rates in the previous expansion and the post-World War II period. Some view this as a factor holding back economic growth in this expansion, but an alternative view is that financial markets are now on a more sustainable trajectory for maintaining future financial stability.
|
Figure 1. Net Growth in U.S. Private-Sector Credit Annual, 1998-2017 |
|
|
Source: Federal Reserve, Financial Accounts of the United States, Table D. 1. |
Overall credit to households (and nonprofits) grew by about 10% a year from 2001 to 2007, as seen in Figure 1. It was then flat from 2008 to 2011, averaging only -0.1% a year. (None of these data are adjusted for inflation, which means it fell faster in real terms over that period.) Credit to households did not fall as much as to businesses and the financial sector during the crisis. After four years of stagnation, credit has grown by about 3% a year since 2012—less than a third of its growth rate in the previous expansion.
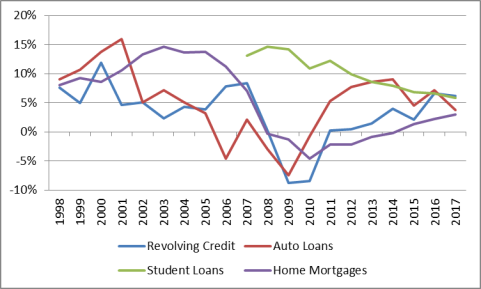
Households use credit to finance the purchase of housing (through mortgages), durable goods (such as automobiles through auto loans), education (through student loans), and general consumption (through credit card purchases). These different types of credit to households followed different patterns over time, as shown in Figure 2
|
Figure 2. Percentage Change in Selected Types of Household Debt Annual, 1998-2017 |
 |
|
Source: Congressional Research Service calculations using Federal Reserve, Financial Accounts of the United States, Tables L. 218 and L. 222. |
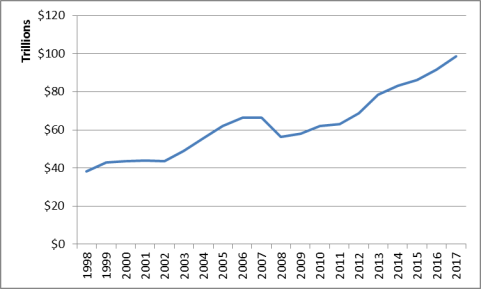
Although household debt has increased in this expansion, overall household net worth has increased each year since 2009 because the value of household assets has risen faster than household liabilities, as shown in Figure 3. By contrast, during the financial crisis, net worth fell because asset values declined faster than debt.
|
Annual, 1998-2017 |
 |
|
Source: Federal Reserve, Financial Accounts of the United States, Table B.1. |
Businesses use credit, among other things, to finance capital investment in plant and equipment. Business investment, in turn, is a key source of economic growth.
Credit to nonfinancial businesses grew by more than 6% from 2001 to 2008, as shown in Figure 1. It shrank by more than 2% a year from 2009 to 2010. It has grown by more than 5% a year from 2011 to 2017. Of the three groups, businesses faced the shortest disruption to credit (two years) during the recession and had the most similar growth rates between the current and previous expansions.
Borrowing is a key part of the business model of many financial institutions. For the financial sector to channel the funds of savers to borrowers, financial-sector participants must also take on debt. Thus, the financial sector is both a borrower and lender in debt markets.
Credit to the U.S. financial sector grew by more than 9% a year from 2001 to 2008, as shown in Figure 1. It then fell by almost 5% a year from 2009 to 2012—the largest decline of the three sectors. From 2013 to 2017, it grew by 2% a year. The financial sector was the last of the three to recover in the current expansion, and it has had the lowest growth rate during the recovery period.
Changes in credit outstanding are determined by factors influencing supply and demand. These factors may have a mixed effect on future credit growth. As the current expansion has strengthened, debt default rates have fallen and economic growth prospects have somewhat improved, which may boost credit growth. Alternatively, borrowers have benefited from a low interest rate environment over the last decade. Interest rates have started rising, and they may continue to rise if the Federal Reserve continues its plans to raise short-term rates and financial conditions continue to "normalize." In the future, this could curb credit growth and potentially make existing debt more difficult to service.