Figure 1. Real GDP Growth by Expansion
Post-WWII Period
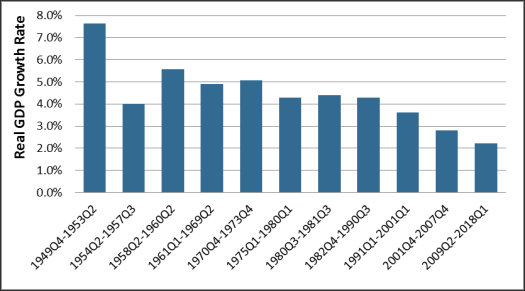
Source: CRS calculations based on data from the Bureau of Economic Analysis (BEA).
Note: Economic expansions as identified by the National Bureau of Economic Research.
The current economic expansion has been characterized by slower economic growth than the preceding 10 expansions. At 2.2%, average annual growth in this expansion has been slower than in the preceding 10 expansions (see Figure 1). President Trump has pledged to increase growth to 3%, an increase of 0.8 percentage points. This Insight examines recent economic growth and factors that could foster or hinder a higher rate in the future.
Economic growth is the predominant measure of the change in material living standards. It is the increase in the production of goods and services in the economy (called gross domestic product or GDP), and by definition is equal to growth in gross domestic income. Thus, slower economic growth generally means slower growth in income and living standards.
|
Figure 1. Real GDP Growth by Expansion Post-WWII Period |
|
|
Source: CRS calculations based on data from the Bureau of Economic Analysis (BEA). Note: Economic expansions as identified by the National Bureau of Economic Research. |
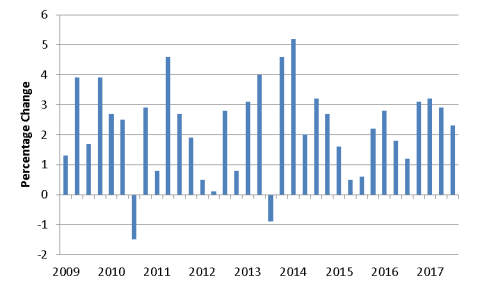
Many economists have predicted that growth would accelerate in 2018, but after growth was around 3% for the last three quarters of 2017, growth declined to 2.3% in the first quarter of 2018. The first quarter slowdown was mainly attributable to weak consumer spending. As shown in Figure 2, this is not the first time that has happened in this expansion—2013 and 2014 also featured two consecutive quarters of high growth that did not persist. This is the first time in the expansion that growth has exceeded 2% for four consecutive quarters.
 |
|
Source: BEA. |
As Figure 2 indicates, growth is volatile from quarter to quarter, so one quarter of low or high growth does not necessarily mark the beginning of a longer-lasting trend. First quarter growth has been the weakest quarter of the year in six out of the past nine years. Although GDP is adjusted for seasonal factors, some economists have speculated that inadequate seasonal adjustment is to blame for some of the first quarter weakness. If true, then the first quarter weakness in 2018 may be partially illusory.
Different factors influence growth in the short run and the long run. In the short run, growth is heavily influenced by the business cycle. If aggregate demand (spending) accelerates, economic output can temporarily grow faster, but growth will eventually return to its underlying trend rate. If growth exceeds this trend rate by too much or for too long, the economy may overheat and subsequently enter a recession.
Many economists expected U.S. growth to temporarily accelerate this year because of "tailwinds," such as the 2017 tax cuts and the increase in discretionary spending, that are temporarily boosting spending. Because the economy is already close to full employment, any boost to spending is unlikely to be long lasting. Additionally, as 2018 has progressed, tailwinds have been partly offset by new potential "headwinds," such as a more volatile and declining stock market and possible trade "wars." The Congressional Budget Office (CBO) projects that growth will be around 3% in 2018 (despite the weaker first quarter) and 2019, and then decline to an average of 1.7% over the next nine years—lower than in the current expansion.
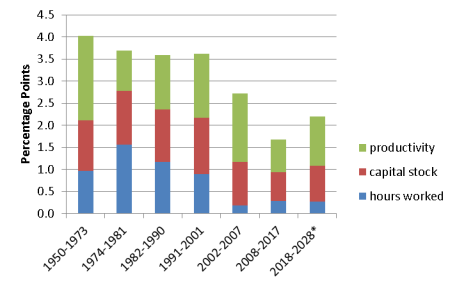
In the long run, trend growth is attributable to increases in the labor force, increases in the capital stock, and productivity growth (how efficiently labor and capital can be used). Since 2008, growth has been historically low because all three sources of growth have been growing relatively slowly, as shown in Figure 3.
|
Figure 3. Contributions to Trend Growth Nonfarm business sector |
 |
|
Source: CBO. Note: *CBO projection. |
Can trend growth be improved? As Figure 1 illustrates, growth of 3% or higher has not been uncommon in the past. Growth was below 3% in both this and the previous expansion, but above 3% in the eight preceding expansions. However, the structural changes to the economy that explain why growth decelerated may be difficult to reverse. CBO projects that trend growth will continue to be restrained by the aging of the population, which is reducing labor supply growth; low rates of capital investment; and the slowdown in productivity growth that started in the last decade. As a result, CBO forecasts that trend growth will be 1.9% in the next 10 years—a modest increase over the past 10 years, but well below the 1950-2017 average of 3.2%.
The aging of the population is inherently difficult for policy to influence, and economists have struggled to explain or predict productivity growth trends. CBO projects that total hours worked will contribute 0.3 percentage points to growth annually in the next 10 years. Based on this estimate, capital and productivity growth would have to contribute at least 2.7 percentage points annually to growth to hit the 3% target. Capital and productivity were at least that high in the 1950-1973 and 1991-2001 periods, but were lower from 1974 to 1990 and 2002 to 2017.
CBO's projections also assume that actual growth would be close to its potential over the next 10 years, which would rule out any recessions (or would require enough above trend growth to cancel out any recessions). However, were the economy to avoid a recession over the next 10 years, it would be nearly twice as long as the longest expansion ever.
Some believe that the recent tax cuts will significantly boost long-run growth, but CBO projects that they will increase annual real GDP growth on average by 0.2 percentage points between 2018 and 2022, before the legislation begins to reduce economic growth by an average 0.1 percentage points between 2023 and 2028. (These effects are already incorporated in CBO's 10-year growth projection.) CBO also presents several private-sector forecasters' projections of the effects of the tax cuts; none of the nine forecasts project an increase in growth high enough to boost projected growth over the next 10 years to 3% (assuming that CBO's current growth projection is correct).