Figure 1. U.S. Steel and Aluminum Imports subject to Section 232 Tariff
(2008-2017, U.S. dollars)
Source: Created by CRS using data from Census Bureau and Global Trade Atlas on HTS products included in the Section 232 proclamations.
On March 23, the United States began applying 25% and 10% tariffs, respectively, on certain steel and aluminum imports. The Administration has stated it is open to discussing terms for permanent exemptions from the tariffs for U.S. trading partners, based on addressing the perceived threat to national security. Pending such negotiations, U.S. imports of steel and aluminum from Argentina, Australia, Brazil, Canada, Mexico, South Korea, and the European Union were initially exempt from the tariffs until May 1. On April 30, the President extended for 30 days the temporary exemption from the steel and aluminum tariffs for Canada, Mexico, and the European Union, to allow for further negotiation, and at the same time granted indefinite exemptions to Argentina, Australia, and Brazil given agreements in principle reached with those trading partners. South Korea also received a permanent exemption from the steel tariffs, having negotiated instead an absolute quota equivalent to 70% of 2015-2017 imports. South Korea has not negotiated an exemption for its aluminum exports.
These tariffs are expected to affect various stakeholders in the U.S. economy, prompting reactions from several Members of Congress, some in support and others voicing concerns. In general, the tariffs are expected to benefit the domestic steel and aluminum industries, leading to potential higher steel and aluminum prices and expansion in production in those sectors, while potentially negatively affecting consumers and downstream domestic industries (e.g., manufacturing and construction) through higher costs.
For more information on the Section 232 case, see CRS Insight IN10872, The President Acts to Impose Tariffs on Steel and Aluminum Imports, by [author name scrubbed] and [author name scrubbed]; and CRS Legal Sidebar LSB10097, UPDATE: Threats to National Security Foiled? A Wrap Up of New Tariffs on Steel and Aluminum, by [author name scrubbed].
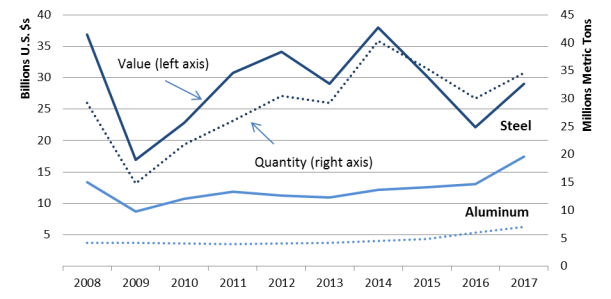
In 2017, U.S. imports of steel and aluminum products covered by the Section 232 tariffs totaled $29.0 billion and $17.4 billion, respectively (Figure 1). Over the past decade, steel imports by value and quantity have fluctuated significantly, while imports of aluminum have increased steadily. The potential for permanent exclusions from the tariffs for the seven trading partners listed above is economically significant as these countries respectively accounted for 67% and 55% of relevant U.S. steel and aluminum imports in 2017 (Table 1). Among countries currently facing the additional import tariff, the top three suppliers of steel in 2017 were Japan, Russia, and Taiwan; the top three suppliers of aluminum were China, Russia, and the United Arab Emirates
|
Steel |
Aluminum |
||||||||||
|
Trading Partner |
Import Value (million U.S. $s) |
Import Share |
Trading Partner |
Import Value (million U.S. $s) |
Import Share |
||||||
|
Currently Exempted |
Currently Exempted |
||||||||||
|
European Union |
|
|
Canada |
|
|
||||||
|
Canada |
|
|
European Union |
|
|
||||||
|
South Korea |
|
|
Argentina |
|
|
||||||
|
Mexico |
|
|
Mexico |
|
|
||||||
|
Brazil |
|
|
Australia |
|
|
||||||
|
Argentina |
|
|
Brazil |
|
|
||||||
|
Australia |
|
|
South Korea |
|
|
||||||
|
Total Exempted |
|
|
Total Exempted |
|
|
||||||
|
Not Currently Exempted |
Not Currently Exempted |
||||||||||
|
Japan |
|
|
China |
|
|
||||||
|
Russia |
|
|
Russia |
|
|
||||||
|
Taiwan |
|
|
United Arab Emirates |
|
|
||||||
|
Turkey |
|
|
Bahrain |
|
|
||||||
|
China |
|
|
India |
|
|
||||||
|
India |
|
|
South Africa |
|
|
||||||
|
Vietnam |
|
|
Qatar |
|
|
||||||
|
Thailand |
|
|
Japan |
|
|
||||||
|
South Africa |
|
|
Indonesia |
|
|
||||||
|
United Arab Emirates |
|
|
Venezuela |
|
|
||||||
|
*Total Non-exempted |
|
|
*Total Non-exempted |
|
|
||||||
|
U.S. Total (All Countries) |
|
|
U.S. Total (All Countries) |
|
|
||||||
Source: Created by CRS using data from the Census Bureau on HTS products included in the Section 232 proclamations.
Notes: European Union includes 28 member states. (*) Total non-exempted includes all U.S. trading partners except the 7 trading partners currently exempted.
Changes in tariffs affect economic activity directly by influencing the price of imported goods and indirectly through changes in exchange rates and real incomes. The extent of the price change and its impact on trade flows, employment, and production in the United States and abroad depend on resource constraints and how various economic actors (foreign producers of the goods subject to the tariffs, producers of domestic substitutes, producers in downstream industries, and consumers) may respond as the effects of the increased tariffs reverberate throughout the economy. The following outcomes are expected at the microeconomic (individual firms and consumers) level:
Aggregating these microeconomic effects, tariffs also have the potential to affect macroeconomic variables, although these impacts may be limited in the case of the Section 232 tariffs, given their focus on two specific commodities with potential exemptions, relative to the size of the U.S. economy. With regard to the value of the U.S. dollar, as demand for foreign goods potentially falls in response to the tariff, U.S. demand for foreign currency may also fall, putting upward pressure on the relative exchange value of the dollar. Tariffs may also affect national consumption patterns, depending on the how the shift to higher cost domestic substitutes affects consumers' discretionary income and therefore aggregate demand. Finally, given the ad hoc nature, these tariffs, in particular, are also likely to increase uncertainty in the U.S. business environment potentially placing a drag on investment.
From a global standpoint, tariff increases on steel and aluminum are likely to result in an unambiguous welfare loss due to what most economists consider is a misallocation of resources caused by shifting production from lower-cost to higher-cost producers. Looking solely at the domestic economy, the net welfare effect is unclear, but also likely negative. Generally, economic models would suggest the negative impact of higher prices on consumers and industries using the imported goods is likely to outweigh the benefit of higher profits and expanded production in the import-competing industry and the additional government revenue generated by the tariff. It is theoretically plausible to generate an overall positive welfare effect for the domestic economy if the foreign producers absorb a large enough portion of the tariff increase. Given the current excess capacity and intense price competition in the global steel and aluminum industries, however, this level of tariff absorption by foreign firms seems unlikely. Moreover, any potential retaliation by foreign governments would erode this welfare gain. China has placed retaliatory tariffs on roughly $3 billion of U.S. exports in response to the Section 232 tariffs.
The direct economic effects of the Section 232 tariffs may be limited due to the relatively small share of economic activity directly affected. Excluding the currently exempted countries, U.S. imports of covered steel and aluminum were $9.7 billion and $7.8 billion, respectively, accounting for less than 1% of all U.S. imports in 2017. According to the U.S. Bureau of Labor Statistics, steel and aluminum producers employ approximately 200,000 workers in the United States, less than 1% of total U.S. private employment (120 million). Various stakeholder groups have prepared quantitative estimates of the costs and benefits across the economy. Specific estimates from these studies should be interpreted with caution given their sensitivity to modeling assumptions and techniques, but generally they suggest a small negative overall effect on U.S. gross domestic product (GDP) from the tariffs with employment shifts into the domestic steel and aluminum industries and away from other sectors in the economy.
Ultimately the economic significance of the tariffs will largely depend on two variables which remain in flux, namely: