Congressional deliberations about the National Aeronautics and Space Administration (NASA) often focus on the availability of funding. This fact sheet provides data on past, current, and proposed NASA appropriations. No bills have yet been introduced in the 115th Congress proposing future-year authorizations of NASA appropriations.
Additional information on appropriations legislation affecting NASA is provided in CRS Report R44877, Overview of FY2018 Appropriations for Commerce, Justice, Science, and Related Agencies (CJS) and similar reports for prior years.1 NASA issues of congressional interest are discussed further in CRS Report R43144, NASA: Issues for Authorization, Appropriations, and Oversight in the 114th Congress.
Table 1 shows appropriations for NASA from FY2013 through FY2018. The data for FY2013 through FY2016 include supplemental appropriations, rescissions, transfers, reprogramming, and, in the case of FY2013, sequestration. They are taken from NASA's congressional budget justifications for FY2014 through FY2018.2 Congressional budget justifications are available on the NASA budget website (http://www.nasa.gov/news/budget/) for the current year and for past years back to FY2002. The table data for FY2017 are as enacted by the Consolidated Appropriations Act, 2017 (P.L. 115-31). For amounts not specified in that act, see pages H3374-H3375 of the explanatory statement, published in the Congressional Record on May 3, 2017. The table data for FY2018 are as enacted by the Consolidated Appropriations Act, 2018 (P.L. 115-141). For amounts not specified in that act, see pages H2094-H2096 of the explanatory statement, published in the Congressional Record on March 22, 2018.
The Trump Administration's budget request for FY2019 adopted a new account structure for NASA. It presented FY2017 amounts adjusted for comparability with the new structure, but not FY2018 amounts, because final FY2018 appropriations had not yet been enacted at the time the FY2019 budget was released. Table 2 shows FY2017 appropriations, adjusted for comparability, and the Administration's request for FY2019. Additional columns will be added to this table as Congress acts on FY2019 authorization and appropriations legislation for NASA.
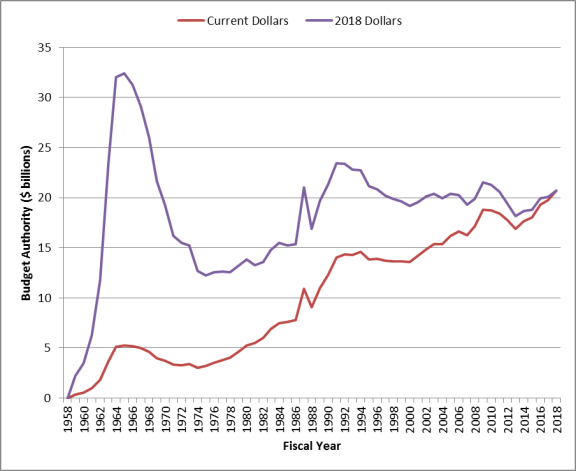
Figure 1 shows NASA's total annual budget authority from the agency's establishment in FY1958 to FY2018, in both current dollars and inflation-adjusted FY2018 dollars.
|
FY2013 |
FY2014 |
FY2015 |
FY2016 |
FY2017 |
FY2018 |
|||||||
|
Science |
|
|
|
|
|
|
||||||
|
Earth Science |
|
|
|
|
|
|
||||||
|
Planetary Science |
|
|
|
|
|
|
||||||
|
Astrophysics |
|
|
|
|
|
|
||||||
|
James Webb Space Telescope |
|
|
|
|
|
|
||||||
|
Heliophysics |
|
|
|
|
|
|
||||||
|
Aeronautics |
|
|
|
|
|
|
||||||
|
Space Technology |
|
|
|
|
|
|
||||||
|
Exploration |
|
|
|
|
|
|
||||||
|
Exploration Systems Development |
|
|
|
|
|
|
||||||
|
Orion |
|
|
|
|
|
|
||||||
|
Space Launch System |
|
|
|
|
|
|
||||||
|
Exploration Ground Systems |
|
|
|
|
|
|
||||||
|
Commercial Spaceflight |
|
|
|
|
|
|
||||||
|
Exploration R&D |
|
|
|
|
|
|
||||||
|
Space Operations |
|
|
|
|
|
|
||||||
|
Space Shuttle |
|
|
|
|
|
|
||||||
|
International Space Station |
|
|
|
|
|
|
||||||
|
Space Transportation |
|
|
|
|
|
|
||||||
|
Space and Flight Support |
|
|
|
|
|
|
||||||
|
Education |
|
|
|
|
|
|
||||||
|
Space Grant |
|
|
|
|
|
|
||||||
|
EPSCoR |
|
|
|
|
|
|
||||||
|
MUREP |
|
|
|
|
|
|
||||||
|
Other |
|
|
|
|
|
|
||||||
|
Safety, Security, and Mission Services |
|
|
|
|
|
|
||||||
|
Construction and EC&R |
|
|
|
|
|
|
||||||
|
Inspector General |
|
|
|
|
|
|
||||||
|
Total |
|
|
|
|
|
|
Sources: FY2013-FY2016 from NASA FY2015-FY2018 congressional budget justifications. FY2017 from P.L. 115-31 and explanatory statement, Congressional Record, May 3, 2017, pp. H3374-H3375. FY2018 from P.L. 115-141 and explanatory statement, Congressional Record, March 22, 2018, pp. H2094-H2096. See text for details.
Notes: Some totals may not add because of rounding. R&D = Research and Development. EPSCoR = Established Program to Stimulate Competitive Research. MUREP = Minority University Research and Education Program. EC&R = Environmental Compliance and Remediation. n/s = not specified.
a. Included in Space Transportation under Space Operations.
b. Commercial Crew funded under Exploration. Remainder of Space Transportation included in International Space Station.
c. Includes up to $1,185 million for Commercial Crew.
d. Includes $14 million (after sequestration) of supplemental funding from the Disaster Relief Appropriations Act, 2013 (P.L. 113-2) that is not shown in the NASA FY2015 congressional budget justification.
e. Includes $109 million in emergency funding (from Sec. 540 of P.L. 115-31) for repairs at NASA facilities damaged by natural disasters.
|
FY2017 |
FY2019 |
||||||||||
|
Request |
House |
Senate |
Enacted |
||||||||
|
Science |
|
|
|
|
|
||||||
|
Earth Science |
|
|
|
|
|
||||||
|
Planetary Science |
|
|
|
|
|
||||||
|
Astrophysicsa |
|
|
|
|
|
||||||
|
Heliophysics |
|
|
|
|
|
||||||
|
Aeronautics |
|
|
|
|
|
||||||
|
Exploration Research and Technologyb |
|
|
|
|
|
||||||
|
Deep Space Exploration Systemsc |
|
|
|
|
|
||||||
|
Exploration Systems Development |
|
|
|
|
|
||||||
|
Orion |
|
|
|
|
|
||||||
|
Space Launch System |
|
|
|
|
|
||||||
|
Exploration Ground Systems |
|
|
|
|
|
||||||
|
Advanced Exploration Systems |
|
|
|
|
|
||||||
|
Exploration R&D |
|
|
|
|
|
||||||
|
LEO and Spaceflight Operations |
|
|
|
|
|
||||||
|
International Space Station |
|
|
|
|
|
||||||
|
Space Transportation |
|
|
|
|
|
||||||
|
Space and Flight Support |
|
|
|
|
|
||||||
|
Commercial LEO Development |
|
|
|
|
|
||||||
|
Education |
|
|
|
|
|
||||||
|
Space Grant |
|
|
|
|
|
||||||
|
EPSCoR |
|
|
|
|
|
||||||
|
MUREP |
|
|
|
|
|
||||||
|
Other |
|
|
|
|
|
||||||
|
Safety, Security, and Mission Services |
|
|
|
|
|
||||||
|
Construction and EC&R |
|
|
|
|
|
||||||
|
Inspector General |
|
|
|
|
|
||||||
|
Total |
|
|
|
|
|
||||||
Sources: FY2019 NASA congressional budget justification and P.L. 115-31. See text for details.
Notes: Some totals may not add because of rounding. For account structure changes, see table notes and discussion in text. R&D = Research and Development. LEO = Low Earth Orbit. EPSCoR = Established Program to Stimulate Competitive Research. MUREP = Minority University Research and Education Program. EC&R = Environmental Compliance and Remediation. n/s = not specified.
a. Includes the James Webb Space Telescope, formerly a separate item.
b. Formerly Space Technology, plus elements formerly in Exploration.
c. Formerly Exploration, minus elements now in Exploration Research and Technology.
d. Includes $109 million in emergency funding (from Sec. 540 of P.L. 115-31, not shown in the FY2019 NASA congressional budget justification) for repairs at NASA facilities damaged by natural disasters.
 |
|
Source: Compiled by CRS. FY1958-FY2008 from National Aeronautics and Space Administration, Aeronautics and Space Report of the President: Fiscal Year 2008 Activities, http://history.nasa.gov/presrep2008.pdf, Table D-1A. FY2009-FY2012 from NASA congressional budget justifications, FY2011-FY2014. FY2013-FY2018 as in Table 1. Current dollars deflated to FY2018 dollars using GDP (chained) price index from President's budget for FY2019, Historical Table 10.1, https://www.whitehouse.gov/wp-content/uploads/2018/02/hist10z1-fy2019.xlsx. Note: Transition quarter between FY1976 and FY1977 not shown. |