Introduction
Small businesses have always been of interest to Congress when discussing tax policies to promote economic growth and job creation. Within these discussions it is common to equate, or at least associate, "small" businesses with pass-through businesses (e.g., sole proprietorships, partnerships, limited liability companies, S corporations). An obvious question is then, are all small businesses also pass-throughs? Relatedly, are all large businesses also C corporations? Answering these questions may help to better target particular tax, and nontax, policies.
This report uses 2015 U.S. Census data to investigate how the size of businesses varies by legal form (corporate and pass-through), as well as the distribution of employment across firm types. Firm size is measured by using employment. The majority of both corporations and pass-throughs in 2011 had fewer than five employees (55% of C corporations and 64% of pass-throughs). Nearly 99% of both corporations and pass-throughs had fewer than 500 employees, the most common employment-based threshold used by the Small Business Administration (SBA).1 Thus, it appears that based on an employment-based measure of size most businesses were small, with the exact share depending on the definition chosen.
Looking further into the data reveals that while the majority of firms were small, the largest firms accounted for the majority of employment. For example, about 53% of all employees worked at firms with 500 or more employees. This statistic is being driven mostly, but not wholly, by corporate employment. Roughly 76% of corporate employees worked at firms with more than 500 employees. In contrast, 25% of pass-through employees worked at firms with more than 500 employees. Thus, a nontrivial share of pass-through workers were employed at the largest firms, but not to the same degree as in the corporate sector.
This report may prove useful to Congress when considering tax and nontax policies directed at businesses based on size. This report does not analyze questions related to the economics of providing preferential tax treatment for small businesses, or the extent to which small businesses are responsible for job creation in the economy.
Tax Treatment of Business Income
Before discussing the data in greater detail it may be helpful to briefly review the tax treatment of business income. In the United States, how a business is taxed at the federal level is partly dependent on how it is organized. The income of C corporations, often referred to as simply corporations, is taxed once at the corporate level according to the corporate tax system, and then a second time at the individual-shareholder level according to the individual tax system when corporate dividend payments are made or capital gains are realized.2 This leads to the so-called double taxation of corporate profits. The income of pass-through businesses is, in general, taxed only once at individual income tax rates. That is, the income of certain businesses passes through to the individual business owners and is taxed according to individual income tax rates. The most popular forms of these alternative pass-through forms of organization are sole proprietorships, partnerships, limited liability companies (LLCs), and subchapter S corporations.3
While this report relies on data from tax year 2015, it is important to note that the 2017 tax revision (P.L. 115-97) made significant changes to the federal tax system that affected corporations and pass-throughs. A detailed discussion of these changes is beyond the scope of this report; however, it is worth highlighting two changes starting in 2018. First, the revision permanently reduced the top corporate tax rate from 35% to 21%. Second, the revision provided pass-throughs, depending on their size and line of business, with a special deduction equal to up to 23% of their income. The deduction reduces the amount of income subject to tax at the individual income tax rates, thus reducing the effective tax rate on qualifying pass-throughs. This change is scheduled to expire after 2025.
Comparing the Size of Pass-Throughs and Corporations
Comparing the size of pass-throughs and corporations is complicated by the fact that there are several different ways to measure firm size. Size could be measured by employment, profits, assets, or a variety of other statistics. Additionally, two different industries may require different measures of size. For example, one industry may be more capital intensive (i.e., more machines and equipment per worker) than another, leading firms in that industry to naturally have more capital assets, whereas firms in another industry may generally have fewer capital assets while employing a large number of workers. Still, given the association of small businesses with pass-throughs, and small businesses with job creation, particularly startups, the presentation below relies on an employment-based measure of firm size.4
Settling on an employment-based metric to measure size still leaves another unresolved issue: what is the employment threshold between small businesses and large businesses? A business with only a handful of employees would constitute being a small business in nearly all cases. But what if a business has 50, 100, 200, or even 500 employees? Currently, there is no consensus on a single criterion that determines the threshold between large and small businesses. For most industries the Small Business Administration (SBA) considers a business small if it has 500 or fewer employees, although this threshold can reach 1,500 employees in some cases. This report does not attempt to resolve the debate over what exactly constitutes a small business.5
The data presented below are from the Census Bureau's 2015 Statistics of U.S. Businesses, the most recent Census data by legal form. The Census provides data separately for businesses with no employees (their nonemployer data) and businesses with at least one employee (their employer data) at some point in the year. This report uses employer data only, mainly because nonemployers generate less than 4% of all business sales and receipts according to Census, and because Census excludes nonemployers from the majority of its own statistics.6 It could also be argued that many nonemployers likely represent individuals involved in side work or short-term contract work, which can be viewed as distinct from the more traditional businesses captured in the employer data.
In 2015, 124.1 million people were employed by employer firms. C corporations accounted for approximately 54.9 million employees (44.2%), S corporations accounted for 32.6 million employees (26.2%), partnerships accounted for 14.3 million employees (11.6%), sole proprietors accounted for 4.7 million employees (3.8%), nonprofits accounted for 15.7 million employees (12.6%), governments accounted for 1.3 million employees (1.0%), and 0.5 million employees were categorized as being employed at "other" entities (0.4%). Corporations and pass-throughs account for a combined 96.5 million workers, with 55% employed at corporations and 45% employed at pass-throughs.
In 2015, there were 5.5 million corporations and pass-throughs with at least one employee at some point during the year. There were 2.9 million S corporations, 1.0 million C corporations, 0.9 million sole proprietorships, and 0.7 million partnerships. As a percentage of the total, C corporations accounted for 18.1% of firms while pass-throughs accounted for 81.9%, with 52.9% of all firms being S corporations, 16.3% being sole proprietorships, and 12.7% being partnerships.
Distribution of Firms by Number of Employees
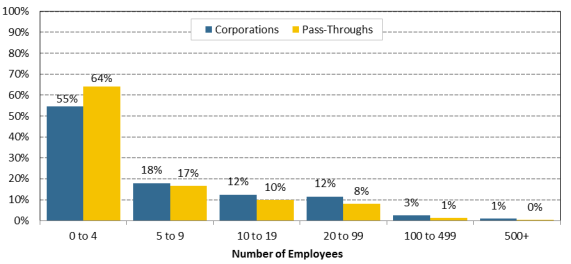
Figure 1 displays the distribution of corporations and pass-throughs by firm size. The employment categories used to create the distributions are the same as those used by the Census to present the data.7 Figure 1 shows a key fact about the size of corporations and pass-throughs: the majority of both (55% of corporations and 64% of pass-throughs) had fewer than five employees in 2015. Naturally, as the definition of small is expanded to include more employees, the share of businesses that fall into this classification increases. For example, 73% of corporations and 81% of pass-throughs had fewer than 10 employees; 85% of corporations and 91% of pass-throughs had fewer than 20 employees; 97% of corporations and 99% of pass-throughs had fewer than 100 employees; and 99% of corporations and 99.7% of pass-throughs had fewer than 500 employees—the most common employee-based threshold used by the SBA for small business determination.
|
Figure 1. Distribution of Firm Size by General Legal Structure, 2015 |
 |
|
Source: CRS Analysis of U.S. Census Bureau, 2015 Statistics of U.S. Businesses, "U.S., NAICS sectors, legal form of organization (LFO)," https://www.census.gov/data/tables/2015/econ/susb/2015-susb-annual.html. Note: The "0%" figures are the result of rounding down figures less than 0.5%. No category had a true 0%. |
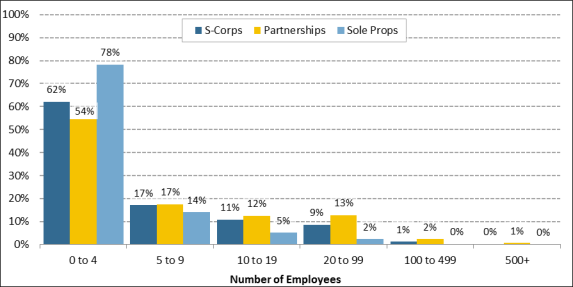
The general pattern displayed in Figure 1 holds across the various pass-through types. Figure 2 displays the distribution of sole proprietors, partnerships, and S corporations by firm size. The greatest concentration of pass-throughs is found in the 0 to 4 employees category, with the number of firms dropping off rather quickly as firm size increases. This relationship is the most pronounced with sole proprietorships, which had the greatest proportion of small firms; almost 78% of sole proprietorships had 0 to 4 employees, with the remaining proportion of firms decreasing more rapidly than partnerships and S corporations. Interestingly, comparing corporations (Figure 1) and partnerships (Figure 2) reveals they have nearly the same size distributions.
 |
|
Source: CRS Analysis of U.S. Census Bureau, 2015 Statistics of U.S. Businesses, "U.S., NAICS sectors, legal form of organization (LFO)," https://www.census.gov/data/tables/2015/econ/susb/2015-susb-annual.html. Note: The "0%" figures are the result of rounding down figures less than 0.5%. No category had a true 0%. |
Distribution of Employees by Firm Size
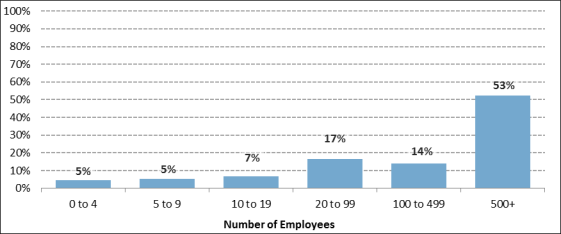
An alternative way to analyze the data is to examine the distribution of employment by firm size. This approach reveals that while the majority of firms had fewer than 500 employees in 2015 (see Figure 2), the largest firms account for the majority of employment. Figure 3 shows that just over 53% of employees worked at firms with 500 or more employees. Firms with fewer employees employ a smaller share of the overall workforce. About 14% of employees worked at firms with 100 to 499 employees; 17% worked at firms with 20 to 99 employees; 7% worked at firms with 10 to 19 employees; 5% worked at firms with 5 to 9 employees; and 5% worked at firms with fewer than 5 employees.
 |
|
Source: CRS Analysis of U.S. Census Bureau, 2015 Statistics of U.S. Businesses, "U.S., NAICS sectors, legal form of organization (LFO)," https://www.census.gov/data/tables/2015/econ/susb/2015-susb-annual.html. |
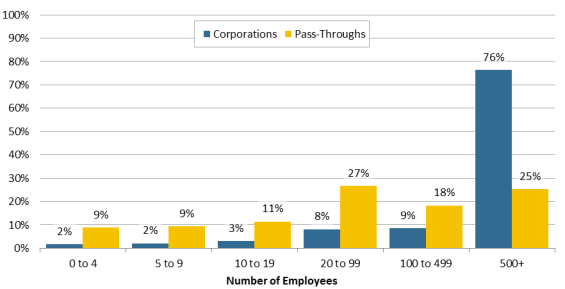
The picture changes somewhat when employee distributions are plotted separately for the corporations and pass-throughs as in Figure 4. Two features of the data are immediately apparent. First, employment in the corporate sector was heavily skewed toward the largest firms. Roughly 76% of corporate employees worked at firms with more than 500 employees in 2015. No other size category accounts for more than 10% of corporate employment. Second, employment in the pass-through sector was more evenly distributed across the employee size categories. For example, about 25% of employees at pass-throughs worked at firms with more than 500 employees, which is less than the portion who worked at firms with 20-99 employees (27%), but more than double the share who worked at firms with either 0-4 employees, or 5-9 employees (with 9% each). Thus, nearly a quarter of pass-through workers were employed at the largest firms, while in the corporate sector the share was nearly 76%.
|
Figure 4. Relative Employment by Firm Size and Legal Form, 2015 |
 |
|
Source: CRS Analysis of U.S. Census Bureau, 2015 Statistics of U.S. Businesses, "U.S., NAICS sectors, legal form of organization (LFO)," https://www.census.gov/data/tables/2015/econ/susb/2015-susb-annual.html. |
Average Number of Employees at the Largest Firms
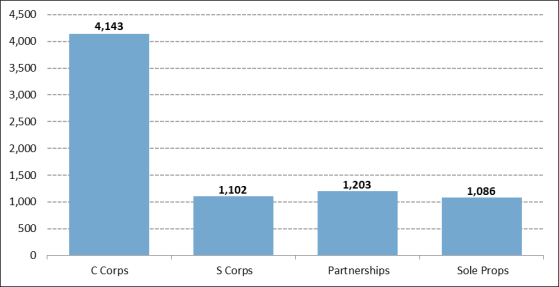
Observing the average number of employees at large firms (more than 500 employees) offers insight into how large the largest firms were in 2015. Among firms with more than 500 employees the average number of employees differs quite significantly between corporations and pass-throughs (see Figure 5). The average number of employees at the largest C corporations (500 or more employees) was slightly above 4,100, while the average number of employees for pass-throughs was just over 1,100. Among large pass-throughs, partnerships tended to have the most employees on average with 1,203, S-corporations fall in the middle with 1,102 employees on average, and sole proprietorships have the fewest with 1,086 employees on average.
|
Figure 5. Average Number of Employees at Firms with 500+ Employees, 2015 |
 |
|
Source: CRS Analysis of U.S. Census Bureau, 2015 Statistics of U.S. Businesses, "U.S., NAICS sectors, legal form of organization (LFO)," https://www.census.gov/data/tables/2015/econ/susb/2015-susb-annual.html. |
Conclusion
The analysis presented here sheds light on the distribution of small and large businesses, the distribution of employment across businesses of various sizes, and differences in the employment patterns and sizes of corporations and pass-throughs. Understanding these data may help policymakers when considering tax policy. For example, particular attention is often given to the effect tax policy may have on pass-throughs under the assumption that pass-throughs and small business are synonymous. But the analysis presented here shows this is not the case. Additionally, 99% (968,134) of C corporations have less than 500 employees, which is the most common employment-based threshold used by the SBA. Not considering the ramifications of particular policies on small C corporations could result in a large share of small businesses being overlooked. Additionally, when formulating policy it may be useful to keep in mind the distribution of employment across firm size. While the vast majority of corporate and pass-through businesses are small in terms of number of employees, the 0.4% (21,561) of firms with more than 500 employees account for over 50% of all employees.