Ongoing congressional deliberations over whether to maintain, alter, or eliminate the diversity immigrant visa program1 (also known as the "lottery" or DV program) include an interest in the geographical origins of immigrants who have been admitted through this program. This fact sheet provides data on the regional and national origins of diversity immigrants (DV immigrants) and how they have shifted over time.
Diversity Immigrant Visa Program
The purpose of the DV program is to provide an avenue for immigration from countries other than the major sending countries2 of current immigrants to the United States. It was added to the Immigration and Nationality Act (INA) by the Immigration Act of 1990 (P.L. 101-649) to stimulate "new seed" immigration (i.e., to foster new, more varied migration from other parts of the world). DV immigrants account for about 5% of all immigrants admitted to the United States annually. The program went into full effect in 1995.
The DV program makes 50,000 visas available annually to natives of countries from which immigrant admissions were lower than a total of 50,000 over the preceding five years.3 The formula for allocating visas is based on statutory specifications; visas are divided among six global geographic regions according to the relative populations of the regions, with their allocation weighted in favor of countries in regions that were underrepresented among immigrant admissions to the United States during the past five years. The INA limits each country to 7% of the total.4
Region of Origin
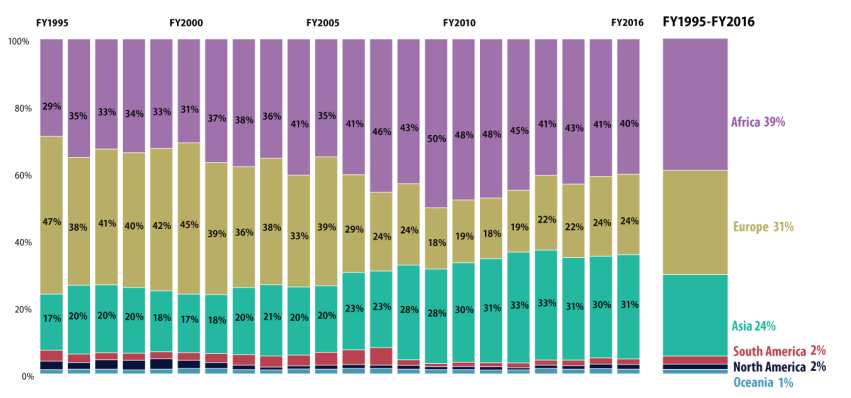
Figure 1 shows the region of birth for DV immigrants admitted from 1995 through 2016. Since its inception, the geographic origins of DV immigrants have shifted away from Europe toward Africa and Asia.
In FY1995, foreign nationals from Europe garnered the most diversity visas (47%) and maintained a plurality share until FY2001. In the early 2000s, the number of DV immigrants from Africa was on par with those from Europe. But since 2006, Africa has maintained the largest proportion, garnering as much as 50% of diversity visas in FY2009, while Europe's share fell to a low of 18% in FY2009 and FY2011. Meanwhile, the share of DV immigrants from Asia grew steadily over time, surpassing Europe's share in FY2008 and remaining second to Africa since then. South America, Oceania, and North America combined accounted for less than 8% each year. In total, from FY1995 to FY2016 immigrants from Africa accounted for 39% of DV immigrants, Europeans 31%, and Asians 24%.5
 |
|
Source: CRS presentation of data from U.S. Department of Homeland Security, Office of Immigration Statistics, Yearbook of Immigration Statistics, multiple fiscal years. Notes: Percentages may not add to 100% due to rounding. |
Country of Origin
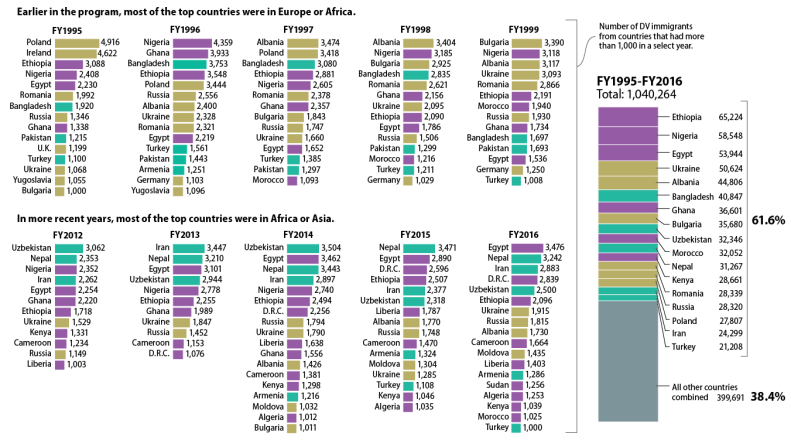
Figure 2 presents the countries of birth from which at least 1,000 diversity visa recipients were admitted in the first five years that the program was in full effect (FY1995-FY1999) and the most recent five years for which data are available (FY2012-FY2016). Early in the program, most of the top countries in which DV immigrants were born were in Europe (particularly Eastern Europe) and Africa. In more recent years, there has been a shift in most of the top countries in which DV immigrants were born toward Africa and Asia. In total, from FY1995 to FY2016, six countries accounted for at least 40,000 diversity visas: Ethiopia (65,224), Nigeria (58,548), Egypt (53,944), Ukraine (50,624), Albania (44,806), and Bangladesh (40,847).6
 |
|
Source: CRS presentation of data from U.S. Department of Homeland Security, Office of Immigration Statistics, Yearbook of Immigration Statistics, multiple fiscal years. Note: The colors of the bars correlate to the regions depicted in Figure 1. Purple = Africa; Gold = Europe; Green = Asia.
|