Background
The United States has approximately 614,000 bridges on public roads subject to the National Bridge Inspection Standards (NBIS) mandated by Congress. About 48% of these bridges are owned by state governments, and 50% are owned by local governments. State governments generally own the larger and more heavily traveled bridges, such as those on the Interstate Highway system. Less than 2% of highway bridges are owned by the federal government, primarily those on federally owned land.1
About 9% of all bridges carry Interstate Highways, and another 14% serve principal arterial highways other than Interstates.2 Interstate and other principal arterial bridges carry almost 80% of average daily bridge traffic. The highest traffic loads are on Interstate Highway bridges in urban areas; these account for only 5% of all bridges but carried 36% of average daily traffic in 2016.3
Bridge Conditions
Federal law requires states to inspect public road bridges periodically and to report their findings to the Federal Highway Administration (FHWA). This information permits FHWA to characterize the existing condition of bridges as good, fair, or poor, and to identify those bridges that are structurally deficient.4
A bridge is considered in good condition if the deck, superstructure, and substructure are rated at least 7 on a 0-to-9 scale. If any of these bridge elements is rated 5 or 6, a bridge is considered in fair condition. A bridge is considered in poor condition if any element is rated 4 or less.
Bridges are considered structurally deficient "if significant load-carrying elements are in poor condition due to deterioration or damage. They are also considered structurally deficient if the waterway opening of the bridge causes intolerable roadway traffic interruptions."5 A bridge classified as structurally deficient is not necessarily unsafe, but may require the posting of a vehicle weight restriction. When officials determine that a bridge is unsafe, they close it to traffic immediately.
In 2016, 47.4% of bridges were considered good, 44.6% fair, and 7.9% poor. Bridge condition has improved since 2012, particularly in the reduction in the percent of poor bridges (Table 1). Data from 2012 are the earliest available from FHWA.
|
Year |
Good |
Fair |
Poor |
|
2012 |
47.3 |
43.3 |
9.4 |
|
2013 |
47.3 |
43.7 |
9.0 |
|
2014 |
47.1 |
44.2 |
8.7 |
|
2015 |
47.3 |
44.4 |
8.3 |
|
2016 |
47.4 |
44.6 |
7.9 |
Source: Federal Highway Administration, National Bridge Inventory, Highway Bridge Condition by Highway System 2016, https://www.fhwa.dot.gov/bridge/britab.cfm.
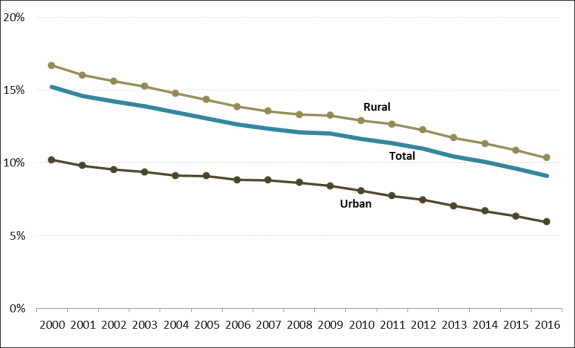
The number of bridges classified as structurally deficient declined from 89,000 in 2000 to about 56,000 in 2016, and fell each year over that period. As of December 2016, about 9% of all bridges were classified as structurally deficient, down from 15% in 2000 (see Figure 1).
In terms of the number of bridges, structural deficiency is principally a problem affecting rural areas, particularly bridges on rural minor roads. In 2016, 82% of structurally deficient bridges were in rural areas and 54% of structurally deficient bridges were on local rural roads. However, structurally deficient bridges in urban areas are generally much larger and, therefore, more expensive to fix. In 2016, 57% of the deck area of structurally deficient bridges was on urban bridges, with 39% on urban Interstates and other principal arterials.6
Nevertheless, bridges on Interstate Highways are generally in better condition than those on more lightly traveled routes: 3.5% of urban Interstate Highway bridges were considered structurally deficient in 2016, less than half of the 8.5% structural deficiency rate of urban bridges on local roads.7 Likewise, 3.0% of rural Interstate Highway bridges were structurally deficient in 2016, about a fifth of the 14.7% structural deficiency rate of rural bridges on local roads.
Bridges on local roads are usually owned by local governments. These bridges had more than twice the structural deficiency rate of state-owned bridges in 2016. Some 12.4% of locally owned bridges were categorized as structurally deficient in 2016, versus 5.6% of state-owned bridges. For bridge deficiency and condition rates by state, see Appendix A.
Future Bridge Funding Needs
Every two years or so, FHWA assesses the condition and performance of the nation's highways and bridges, documents current spending by all levels of government, and estimates future spending needs to maintain or improve current conditions and performance.8 As with any attempt to forecast future conditions, a host of simplifying assumptions, omissions, and data problems influence these estimates. Among other things, the estimates rely on forecasts of travel demand. Despite such uncertainties and assumptions, these estimates provide a way to assess the level of current spending compared with what would be needed in the future under different scenarios.
The 2015 needs assessment, the most recent available, shows that $17.5 billion was spent on bridge construction by governments at all levels in 2012.9 The vast majority of that amount, $16.4 billion, went to rehabilitate or replace existing bridges, with the remainder devoted to construction of new bridges.10 The $16.4 billion spent on bridge rehabilitation or replacement in 2012 was an increase of 22% over the $13.5 billion spent in 2008, but a decrease of 7% from the $17.7 billion spent in 2010 (in 2012 dollars). Bridge construction and rehabilitation spending in 2009 and 2010 was higher than in prior or subsequent years due largely to one-time funding under the American Recovery and Reinvestment Act of 2009 (ARRA; P.L. 111-5).11
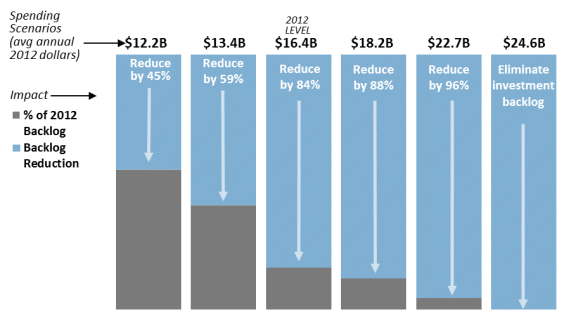
Because of the modeling involved, FHWA's future needs estimates for bridges are limited to fixing deficiencies in existing bridges only when the benefits outweigh the costs. It estimated that fixing all bridge deficiencies existing in 2012 would cost $123.1 billion (in 2012 dollars), which was almost eight times the level of spending in 2012 and over nine times the spending level of 2008, when no ARRA money was available.12
Of course, fixing all deficient bridges overnight is not feasible. FHWA, therefore, estimated how this investment backlog may change at various levels of spending over the 2013-2032 period, taking into account the deterioration of existing bridges over that period. The results of this analysis are seen in Figure 2. To eliminate the backlog by 2032 would require an investment of $24.6 billion annually (in 2012 dollars). If the $16.4 billion spending level of 2012 were to continue, the total bridge reconstruction backlog would decline by roughly 84% by 2032.
Federal and State Roles
Federal assistance for the maintenance, rehabilitation, and construction of highway bridges comes principally through the Federal-Aid Highway Program administered by FHWA. FHWA, however, does not determine which bridges should benefit from federal funding. Almost all funding under the Federal-Aid Highway Program is distributed to state departments of transportation, which determine, for the most part, where and on what the money is spent. States must comply with detailed federal planning guidelines and performance management measures as part of the decisionmaking process, but otherwise they are free to spend their federal highway funds in any way consistent with federal laws and regulations.13 Bridge projects are developed at the state level, and state departments of transportation let the contracts, oversee the construction process, and provide for the inspection of bridges.14
The Highway Bridge Program, a stand-alone program for highway bridges that was formerly part of the Federal-Aid Highway Program, was terminated at the end of FY2012.The current law authorizing highway spending, the 2015 Fixing America's Surface Transportation Act (FAST Act; P.L. 114-94), does not include a program specifically targeting bridges.15 Instead, the law makes bridge projects eligible for funding from three programs that distribute funds to the states under formulas specified in law: the National Highway Performance Program (NHPP), the Surface Transportation Block Grant Program (STBG), and the National Highway Freight Program (NHFP). Under all three programs, the states determine how much of their federal funding is spent on bridges as opposed to other uses, primarily highway construction and improvement. These funds may also be used for the seismic retrofitting of bridges to reduce earthquake failure risk.16
Depending on the specific use, funding from other formula programs may also be used on bridge projects on a case-by-case basis. In addition, states are allowed to transfer ("flex") up to 50% of each formula program's apportioned funds to other formula programs.17 A related discretionary grant program, the Nationally Significant Freight and Highway Projects Program, also may provide funding for large bridge projects that benefit freight movement, on a competitive grant basis.18
FHWA is involved in the project decisionmaking process in two significant ways. First, FHWA, in consultation with states and other federal agencies, is required to classify public road bridges according to "serviceability, safety, and essentiality for public use ... [and,] based on that classification, assign each a risk-based priority for systematic preventive maintenance, replacement or rehabilitation."19 In addition to developing this metric, FHWA imposes certain performance measures that states must meet to avoid funding penalties. For example, if more than 10% of the deck area of a state's bridges on the National Highway System (which consists of the Interstate Highway System and most other principal arterial roads) is structurally deficient, the state is subject to a penalty requiring it to dedicate an amount of its NHPP funds equal to 50% of its FY2009 spending under the former Highway Bridge Program to bridge projects.20
Table 2 shows the total obligation of federal funding for bridges, including both funds from the former Highway Bridge Program and those from all other programmatic sources, from FY2009 through FY2017. The table also compares obligations from all programs in current dollars and adjusts these totals to show the impact of project cost inflation during this period.
Table 2. Trends in Federal Bridge Obligations, FY2009-FY2017
(current and inflation-adjusted dollars in millions)
|
FY2009 |
FY2010 |
FY2011 |
FY2012 |
FY2013 |
FY2014 |
FY2015 |
FY2016 |
FY2017 |
|
|
Total (Current $) |
$9,386 |
$8,472 |
$7,043 |
$6,014 |
$6,484 |
$6,803 |
$6,804 |
$7,095 |
$6,644 |
|
% Change from Previous Year |
NA |
-10% |
-17% |
-15% |
+8% |
+5% |
0.0% |
+4% |
-6% |
|
Highway Bridge Program |
$4,212 |
$4,284 |
$4,193 |
$3,575 |
$961 |
$221 |
$243 |
$80 |
$69 |
|
All Other Programs |
$5,174 |
$4,188 |
$2,850 |
$2,439 |
$5,523 |
$6,582 |
$6,561 |
$7,015 |
$6,575 |
|
Total (Inflation Adjusted, 2009 $) |
$9,386 |
$8,380 |
$6,705 |
$5,452 |
$5,695 |
$5,884 |
$5,866 |
$6,103 |
NA |
|
% Change from Previous Year |
NA |
-11% |
-20% |
-19% |
+4% |
+3% |
0.0% |
+4% |
NA |
|
Highway Bridge Program |
$4,212 |
$4,238 |
$3,992 |
$3,241 |
$844 |
$191 |
$210 |
$69 |
NA |
|
Other Programs |
$5,174 |
$4,142 |
$2,713 |
$2,211 |
$4,851 |
$5,693 |
$5,675 |
$6,034 |
NA |
Sources: FHWA; FY2009-FY2011 total obligations reflect obligation of stimulus funds under the American Recovery and Reinvestment Act of 2009 (P.L. 111-5). Cost adjustments calculated by CRS using Bureau of Economic Analysis, Price Indexes for Gross Government Fixed Investment by Type, National Income and Product Accounts Table 5.9.4B, Line 40: State and local highways and streets. Weighted average used to approximate fiscal years.
Notes: For a detailed table of bridge obligations for these years, see Appendix B. Totals reflect ongoing obligations of funds under prior authorizations. Totals may not add due to rounding. Highway Bridge Program funding for FY2013-FY2017 reflects funds unobligated when the program was discontinued at the end of FY2012.
Bridge obligation figures from all programs are elevated for FY2009 through FY2011 because of the additional funding provided under ARRA. In FY2012, after most ARRA spending was obligated, the obligation of federal funds for bridges fell 23% below the pre-ARRA (FY2008) obligations after adjusting for inflation. The obligation of funds for bridges grew at or slightly faster than inflation in FY2013 and FY2016. Even so, total obligations for bridges in FY2017, $6.644 billion, were slightly lower than those prior to ARRA (FY2008, $6.837 billion) in current-dollar terms and probably about 15% below obligations in FY2008 after adjusting for inflation.
Bridge Inspection
Under the National Bridge Inspection Program, all bridges longer than 20 feet on public roads must be inspected by qualified inspectors, based on federally defined requirements. Federal agencies are subject to the same requirements for federally owned bridges, such as those on federal lands. Data from these inspections are reported to FHWA, which uses them to compile a list of structurally deficient bridges. States may use this information to identify which bridges need replacement or repair.21
FHWA sets the standards for bridge inspection through the National Bridge Inspection Standards (NBIS).22 The NBIS set forth how, with what frequency, and by whom bridge inspection is to be completed. The standards provide the following:
- Each state is responsible for the inspection of all public highway bridges within the state except for those owned by the federal government or Indian tribes. Although the state may delegate some bridge inspection responsibilities to smaller units of government, the responsibility for having the inspections done in conformance with federal requirements remains with the state.
- Inspections can be done by anyone qualified under the NBIS. The inspectors may be state employees, consultants to the states, or others.
- Inspection of a federally owned bridge is the responsibility of the federal agency that owns the bridge.
- The NBIS set forth the standards for the qualification and training of bridge inspection personnel.
- In general, the required interval of inspection is every 24 months. States are to identify bridges that require less than a 24-month interval. States can also, however, request FHWA approval to inspect certain bridges at intervals as long as 48 months. The interval for an underwater inspection is generally 60 months but may be increased to 72 months with FHWA permission. Fracture-critical members must undergo a hands-on inspection at intervals not to exceed 24 months.23
- The most common on-site inspection is a visual inspection by trained inspectors, one of whom must meet the additional training requirements of a team leader. Damage and special inspections do not require the presence of a team leader.
- Load rating of a bridge must be under the responsibility of a registered professional engineer. Structures that cannot carry maximum legal loads for the roadway must be posted.
The vast majority of inspections are done by state employees or consultants working for the states. FHWA bridge engineers do, at times, perform field reviews to assure that states are complying with the bridge inspection requirements. FHWA also provides on-site engineering expertise in the examination of the reasons for a catastrophic bridge failure. However, FHWA bridge engineers have only limited time available for audits and other bridge oversight.
FHWA's Emergency Relief Program
The Emergency Relief Program24 provides funding for bridges damaged in natural disasters or that are subject to catastrophic failures from an outside source. The program provides funds for emergency repairs immediately after the failure to restore essential traffic, as well as for longer-term permanent repairs.
Emergency Relief is authorized at $100 million per year, nationwide. Funding beyond this amount is commonly provided for in supplemental appropriations acts. In the case of most large disasters, additional emergency relief funds are provided in an appropriations bill, usually a supplemental appropriations bill.
The federal share of emergency repairs to restore essential travel during the first 180 days following a disaster is 100%. Later repairs, as well as permanent repairs such as reconstruction or replacement of a collapsed bridge, are reimbursed at the same federal share that would normally apply to the federal-aid highway facility. Recently, Congress has sometimes legislatively raised the federal share under the Emergency Relief Program to 100% (as happened following the 2007 collapse of a bridge on Interstate-35W in Minnesota). As is true with other FHWA programs, the Emergency Relief Program is administered through state departments of transportation in close coordination with FHWA's division office in each state.
Issues for Congress
Both the washout of the Interstate 10 bridge and the use restriction imposed in 2016 on the Arlington Memorial Bridge, a federally owned bridge between Arlington, VA, and Washington, DC, led to warnings that the large number of structurally deficient bridges indicates an incipient crisis.25 FHWA data do not substantiate this assertion. The number of bridges classified as structurally deficient has fallen consistently since 1990, and the proportion of all highway bridges identified as structurally deficient is the lowest in decades.
The condition of roads, in particular urban roads, has not experienced the same degree of improvement as the condition of bridges.26 This disparity raises the policy question of what priority should go to bridge repairs as opposed to roadway repairs. In the Moving Ahead for Progress in the 21st Century Act (MAP-21; P.L. 112-141), enacted in 2012, Congress implicitly addressed this issue by giving states greater flexibility to use federal funding for roads or for bridges, at their discretion. In doing so, Congress chose not to mandate any specific level of spending on bridges. Instead, responsibility for determining the amount that should be spent on bridges each year was assigned to the states.
A related issue is one of efficiency. Structurally deficient bridges are not unsafe bridges, and an effort to eliminate all structurally deficient bridges could quickly lead to spending on relatively low-priority projects that do not present major safety problems. The act also requires FHWA to develop performance measures in regard to bridges. The speed and effectiveness of implementation, and whether the measures fulfill the intent of Congress, may be oversight issues.27
Federal Pressure for State Bridge Spending
To encourage state spending on structurally deficient bridges, current law sets a penalty threshold under the NHPP. According to this penalty threshold, any state whose structurally deficient bridge deck area on the National Highway System exceeds 10% of its total National Highway System bridge deck area for three years in a row must devote NHPP funds equal to 50% of the state's FY2009 Highway Bridge Program apportionment to improve bridge conditions during the following fiscal year and each year thereafter until the deck area of structurally deficient bridges falls to 10% or below. Even if a state were required to spend more of its federal highway funding on bridges (and therefore less on roadway projects) due to this penalty, its mandated spending on deficient bridges would be less than was required prior to expiration of the Highway Bridge Program in FY2012.
Providing More Money for Bridges
The passage of the FAST Act, which funds the Federal-Aid Highway program through FY2020, provided for an increase of 2.4% above the amount authorized under previous legislation, adjusted for expected inflation. This increased funding is the most important aspect of the FAST Act in regard to bridges. As it conducts oversight of the implementation of the FAST Act, Congress may want to monitor states' patterns of bridge spending. The underlying question is whether the policy of allowing the states to decide how much of their federal-aid highway funding to spend on bridges, with only modest penalties for underfunding, is accomplishing the congressional policy of systematically rehabilitating or replacing deficient bridges.28
Tolling of Non-tolled Bridges
Wider use of tolling could allow for more rapid improvement of major bridges. Heavily traveled bridges can be attractive targets for conversion to toll facilities; many bridges have no convenient alternatives, so drivers may find it difficult to avoid paying whatever toll is imposed. The revenue stream provided by tolls can make bridge building and reconstruction an attractive investment for private entities that are interested in participating in a public-private partnership. Tolling can also help projects become eligible for a federal Transportation Infrastructure Finance and Innovation Act loan. Bridge tolls, however, are often very unpopular, and their acceptance varies greatly from region to region. Some states have sought to make bridge tolls more acceptable within a state by charging out-of-state users at a much higher rate than in-state residents, a practice that may face legal challenges.29
Currently, any bridge on the federal-aid highway system, including Interstate Highway bridges, may be converted to a toll facility if the conversion is related to the reconstruction or replacement of the previously non-tolled bridge. 30 New bridges, including bridges on new segments of Interstate Highways, may be tolled as well. Added lane capacity on a bridge may be tolled as long as the number of free lanes remains the same. Any bridge owner (a state, public authority, or other eligible entity) has the right to implement tolling, provided the facility is eligible to be tolled under 23 U.S.C. Sections 129 or 166, or under congressionally authorized pilot toll programs. FHWA does not regulate the toll rates users pay on toll roads. Setting toll rates is the responsibility of the toll road owner or operator of the facility. However, federal law does impose restrictions on the use of toll revenue.
Tolling Bridges Between States
Establishing tolls on bridges that connect two states is generally done with the agreement of the states on both ends of the bridge. This does not always have to be the case, as such bridges are not always jointly owned. In the case of a bridge between two states that is owned by one of the states, the bridge owner might be able to impose tolls unilaterally; if such a bridge is on the Interstate Highway system, the state could impose tolls only through participation in the Value Pricing Pilot Program.31 Congress might consider providing guidance on the process of imposing tolls on bridges between two states.
Spending on Off-System Bridges
Historically, nearly all federal highway funding was restricted to roads and bridges on the federal-aid highway system. The Surface Transportation Assistance Act of 1978 (P.L. 95-599) stipulated that not less than 15% of a state's bridge apportionments nor more than 35% be spent "off-system," that is, on relatively small bridges on roads that are not part of the 1.02 million-mile federal-aid system.32 Off-system spending of federal bridge funds has been required in every highway authorization bill since 1978. Under current law, STBG funds equal to at least 15% of the amounts apportioned to a state for the Highway Bridge Program in FY2009 are to be obligated for off-system bridge projects.
Off-system bridges, by definition, are inherently local in nature. By eliminating the set-aside for off-system bridges, Congress could enable states to spend more of their federal funds on bridges that are more heavily used, but states would not be required to spend funds for that purpose without additional legislation. However, 54% of structurally deficient bridges are on local rural roads, which are off-system. The set-aside for off-system projects has been strongly supported by predominantly rural states and by many county and municipal governments.
The FAST Act made a change in bridge project eligibility under the NHPP program. Previously, NHPP funds were limited to bridges on the 221,919-mile National Highway System. The FAST Act allows NHPP funds to be used for bridge projects on a much larger network, the 1.02 million-mile federal-aid highway system. Allowing these bridges to be funded from NHPP rather than STBG funds should make it easier for states to use their STBG funds for bridges that are not on the federal-aid highway system.
Bridge Improvement Type
Of the funds both authorized and obligated for bridges in FY2014 from all FHWA sources, 9% were obligated for new bridges, 51% were obligated for bridge replacement, 7% were for major rehabilitation, and 33% were for minor bridge work. These funds supported projects on 5,173 bridges. The 60% combined share obligated for both new and replacement bridges was less than in the late 1990s, when it approached 70%.The share of spending for major bridge rehabilitation has also fallen since the late 1990s. Meanwhile, four times the proportion of federal funding went to minor bridge work in FY2014 as in the 1990s.33
The shift in spending of federal funds from large bridge construction projects to minor rehabilitation projects could be due to the falling number of deficient bridges, but it also could indicate that states are favoring less expensive projects and delaying some new bridges or bridge replacements because of the higher cost of these projects. Examining the trends in spending by improvement type could reveal state bridge priorities.
Federal Lands and Tribal Bridges
Funding for bridges owned by the federal government or by Indian tribes does not come from the regularly apportioned programs discussed above. Funding is authorized separately, primarily from two stand-alone programs: the Tribal Transportation Program34 and the Federal Lands Transportation Program. The Tribal Transportation Program funds are under the control of the tribes, in cooperation with the Department of the Interior and the Department of Transportation. The Federal Lands Transportation Program funds are under the control of the federal land management agencies, with assistance and oversight from the Department of Transportation. A third program, the Federal Lands Access Program, funds facilities that provide access to federal lands. Its funding decisions are made by a state committee that includes representatives of FHWA, the state department of transportation, and a political subdivision of the state.
Compared to the core formula programs, these programs are small. Under the FAST Act, an average of $485 million annually is available to the Tribal Transportation Program. The $355 million annual average Federal Lands Transportation program authorization is divided among the National Park Service ($284 million), the Fish and Wildlife Service ($30 million), the U.S. Forest Service ($17 million), and other federal land management agencies ($24 million). These funds must cover both road and bridge needs as well as any public transportation funding. These programs are paid for from the Highway Trust Fund.
The structure for funding bridges on federal and tribal land has given rise to some complications, such as those relating to the rehabilitation of Arlington Memorial Bridge. The bridge is owned by the National Park Service. Therefore, the work would logically be paid out of the Park Service's funding under the Federal Lands Transportation Program, but the cost is expected to be $227 million, nearly as much as the Park Service receives each year for all highway needs. To complete the project the Park Service is combining $107 million of its transportation and general construction funds with a discretionary grant of $90 million from the Department of Transportation's Infrastructure for Rebuilding America (INFRA) program and a transfer of $30 million in federal highway formula funds from Virginia and the District of Columbia.35 The FAST Act established the Nationally Significant Federal Lands and Tribal Projects Program, authorized at $100 million annually, to provide an extra source of funds for large projects on federal or tribal lands, but this money is subject to appropriation each year. To date, no funds have been appropriated for this program. Congress may wish to consider the adequacy of funding for large federal lands bridge projects such as Arlington Memorial Bridge.
Oversight and Inspection Issues36
Risk-Based Approach to Federal Bridge Oversight
MAP-21 required that the National Bridge Inventory classify bridges according to serviceability, safety, and essentiality for public use, and based on this classification assign each bridge a risk-based priority for systematic preventive maintenance, replacement, or rehabilitation. This risk-based approach is still under development by FHWA.37 Two issues have arisen during the process of developing the classification and prioritization metrics. First, the law does not explain how the prioritized list of projects is to be used. Second, the classification system could conflict with the state risk-based asset management plans. MAP-21 requires that all states develop these plans but does not require that the state plans conform to the classification system and risk-based priority setting being developed by FHWA.38
Once the national classification and risk-based prioritization metric is developed, Congress could consider making its use by the states an eligibility requirement for bridge project funding under NHPP and STP. A major oversight question is whether or not the state asset management plans align with the national level prioritization.
Inspection Auditing
FHWA could be directed to take a more active role in ensuring that inspections performed by the states or their contractors are done in conformance with the NBIS. This step might involve a requirement for more on-site field reviews of state inspections or increased review or inspection paperwork. At some division offices FHWA might have to hire more engineers and support personnel to carry out the increased workload; at others FHWA might be able to dedicate more of its existing resources to oversight of the inspection program.
Inspector Training and Personnel Qualifications
Current law includes requirements for the establishment of minimum inspection standards and an annual review of state compliance with the standards established in MAP-21. Under the act, the Secretary of Transportation is to update the NBIS, including those governing the methodology, training, and qualifications of inspectors. The rule is expected to be issued in February of 2018.39 Congress may wish to oversee implementation of these provisions and to monitor their effectiveness.
Appendix A. Bridge Condition by State
(data as of December 2016)
|
State |
All Bridges (number) |
Structurally Deficient (number) |
Structurally Deficient (percent) |
Condition Rating (percent) |
||
|
Good |
Fair |
Poor |
||||
|
Alabama |
16,098 |
1,229 |
7.6 |
44 |
52 |
4 |
|
Alaska |
1,488 |
144 |
9.7 |
43 |
47 |
9 |
|
Arizona |
8,154 |
214 |
2.6 |
60 |
37 |
2 |
|
Arkansas |
12,871 |
811 |
6.3 |
54 |
41 |
5 |
|
California |
25,431 |
1,388 |
5.5 |
66 |
29 |
5 |
|
Colorado |
8,682 |
497 |
5.7 |
44 |
50 |
5 |
|
Connecticut |
4,214 |
338 |
8.0 |
30 |
62 |
8 |
|
Delaware |
877 |
43 |
4.9 |
30 |
65 |
5 |
|
District of Columbia |
245 |
9 |
3.7 |
27 |
69 |
4 |
|
Florida |
12,313 |
256 |
2.1 |
69 |
29 |
2 |
|
Georgia |
14,835 |
700 |
4.7 |
47 |
49 |
4 |
|
Hawaii |
1,132 |
64 |
5.7 |
39 |
56 |
5 |
|
Idaho |
4,445 |
411 |
9.2 |
27 |
64 |
8 |
|
Illinois |
26,704 |
2,243 |
8.4 |
52 |
40 |
8 |
|
Indiana |
19,245 |
1,533 |
8.0 |
41 |
51 |
8 |
|
Iowa |
24,184 |
4,968 |
20.5 |
38 |
43 |
19 |
|
Kansas |
25,013 |
2,151 |
8.6 |
56 |
39 |
6 |
|
Kentucky |
14,265 |
1,157 |
8.1 |
38 |
54 |
7 |
|
Louisiana |
12,915 |
1,739 |
13.5 |
51 |
37 |
12 |
|
Maine |
2,450 |
352 |
14.4 |
32 |
55 |
14 |
|
Maryland |
5,321 |
308 |
5.8 |
33 |
61 |
6 |
|
Massachusetts |
5,171 |
483 |
9.3 |
27 |
64 |
9 |
|
Michigan |
11,156 |
1,234 |
11.1 |
42 |
47 |
11 |
|
Minnesota |
13,355 |
800 |
6.0 |
63 |
31 |
6 |
|
Mississippi |
17,068 |
2,098 |
12.3 |
65 |
26 |
9 |
|
Missouri |
24,468 |
3,195 |
13.1 |
45 |
46 |
9 |
|
Montana |
5,276 |
465 |
8.8 |
35 |
58 |
7 |
|
Nebraska |
15,334 |
2,361 |
15.4 |
52 |
39 |
10 |
|
Nevada |
1,933 |
31 |
1.6 |
51 |
48 |
1 |
|
New Hampshire |
2,486 |
304 |
12.2 |
53 |
37 |
10 |
|
New Jersey |
6,730 |
609 |
9.0 |
28 |
64 |
8 |
|
New Mexico |
3,972 |
258 |
6.5 |
38 |
56 |
6 |
|
New York |
17,462 |
1,928 |
11.0 |
36 |
53 |
11 |
|
North Carolina |
18,099 |
1,790 |
9.9 |
43 |
47 |
10 |
|
North Dakota |
4,400 |
661 |
15.0 |
53 |
36 |
12 |
|
Ohio |
28,284 |
1,942 |
6.9 |
56 |
37 |
7 |
|
Oklahoma |
23,053 |
3,460 |
15.0 |
47 |
40 |
12 |
|
Oregon |
8,118 |
429 |
5.3 |
38 |
57 |
5 |
|
Pennsylvania |
22,791 |
4,506 |
19.8 |
29 |
52 |
19 |
|
Rhode Island |
772 |
192 |
24.9 |
17 |
59 |
25 |
|
South Carolina |
9,358 |
964 |
10.3 |
45 |
46 |
9 |
|
South Dakota |
5,849 |
1,147 |
19.6 |
32 |
50 |
18 |
|
Tennessee |
20,123 |
998 |
5.0 |
50 |
46 |
5 |
|
Texas |
53,488 |
900 |
1.7 |
53 |
46 |
1 |
|
Utah |
3,039 |
95 |
3.1 |
58 |
39 |
3 |
|
Vermont |
2,766 |
155 |
5.6 |
53 |
44 |
3 |
|
Virginia |
13,892 |
935 |
6.7 |
35 |
59 |
6 |
|
Washington |
8,178 |
392 |
4.8 |
53 |
43 |
4 |
|
West Virginia |
7,217 |
1,247 |
17.3 |
37 |
46 |
17 |
|
Wisconsin |
14,230 |
1,232 |
8.7 |
52 |
40 |
8 |
|
Wyoming |
3,128 |
344 |
11.0 |
25 |
65 |
10 |
|
Puerto Rico |
2,308 |
297 |
12.9 |
19 |
69 |
12 |
|
Total |
614,386 |
56,007 |
9.1 |
47 |
45 |
8 |
Source: Federal Highway Administration, National Bridge Inventory, Count of Deficient Bridges by Functional Classification 2016, and Highway Bridge Condition by Highway System 2016, https://www.fhwa.dot.gov/bridge/britab.cfm.
Appendix B. Bridge Obligations by Program: FY2009-FY2017 (current dollars)
|
Program |
FY2009 |
FY2010 |
FY2011 |
FY2012 |
FY2013 |
FY2014 |
FY2015 |
FY2016 |
FY2017 |
|
Interstate Maintenance |
456,257,769 |
659,096,900 |
583,304,527 |
755,656,556 |
129,051,722 |
40,227,615 |
11,385,907 |
2,406,944 |
2,133,879 |
|
National Highway System |
597,997,506 |
863,300,679 |
836,649,803 |
680,253,396 |
88,777,186 |
55,653,947 |
55,928,169 |
37,274,844 |
29,941,503 |
|
Surface Transportation Program |
708,246,051 |
603,721,498 |
586,685,394 |
558,073,243 |
1,662,455,267 |
2,211,511,901 |
2,254,453,670 |
2,409,636,146 |
2,106,608,538 |
|
National Highway Performance Program |
— |
— |
— |
— |
3,018,008,912 |
3,673,113,345 |
3,638,484,037 |
3,910,107,620 |
3,928,875,041 |
|
Transportation Alternatives |
— |
— |
— |
— |
138,881 |
4,620,618 |
2,368,351 |
6,332,735 |
3,967,387 |
|
Bridge Programs |
4,211,724,679 |
4,283,730,495 |
4,193,314,245 |
3,575,482,507 |
960,648,620 |
220,620,109 |
243.314,396 |
79,924,642 |
69,344,767 |
|
Congestion Mitigation and Air Quality |
8,579,895 |
47,636,428 |
91,470,609 |
(10,213,853) |
72,343,225 |
41,677,322 |
62,542,855 |
38,121,580 |
44,430,292 |
|
Appalachian Development Highway System |
61,133,266 |
30,653,664 |
28,236,759 |
5,436,959 |
24,767,784 |
16,374,183 |
51,015,156 |
158,589,439 |
63,980,429 |
|
High Priority Projects |
226,877,040 |
150,934,801 |
224,452,978 |
61,045,589 |
— |
31,470,461 |
10,125,976 |
17,908,671 |
9,089,847 |
|
Minimum Guarantee— |
(5,295,640) |
(14,994,995) |
(16,498,678) |
12,053,469 |
9,919,033 |
2,720,538 |
10,404,647 |
10,711287 |
1,828,744 |
|
Equity Bonus Exempt Lim |
96,050,658 |
35,326,437 |
14,007,551 |
59,268,059 |
451,407,959 |
220,471,325 |
211,958,856 |
8,778,554 |
16,978,609 |
|
Coordinated Border Infrastructure Program |
23,208,473 |
23,039,215 |
30,457,277 |
10,461,126 |
3,049,907 |
84,377,062 |
2,569,474 |
(3,142,320) |
6,169,284 |
|
Safe Routes to School |
— |
— |
— |
— |
— |
__ |
694,649 |
— |
— |
|
Planning and Research |
— |
— |
— |
(200,000) |
— |
__ |
— |
— |
— |
|
All Others |
3,000,825,716 |
1,789,136,040 |
470,519,916 |
306,635,541 |
63,018,956 |
200,128,997 |
248,261,223 |
418,356,493 |
361,085,145 |
|
Total |
9,385,605,414 |
8,471,581,163 |
7,042,600,382 |
6,013,952,592 |
6,483,587,452 |
6,802,967,421 |
6,803,507,367 |
7,095,006,638 |
6,644,433,364 |
Source: Federal Highway Administration (FHWA). Displays funds from the Fixing America's Surface Transportation Act (FAST Act; P.L. 114-94), as well as ongoing obligation of funds from earlier authorization acts.