Figure 1. Daily Federal Balances, October 3-December 12, 2017
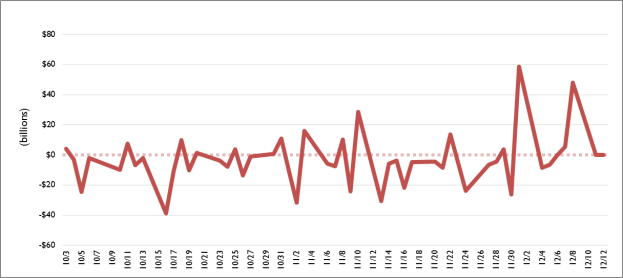
Source: U.S. Department of Treasury, Daily Treasury Statement (various).
Notes: Positive numbers indicate daily surpluses, while negative numbers indicate daily deficits.
The statutory debt limit was reinstated on December 9, 2017, at a level that precisely accommodated the federal borrowing undertaken to that date. On December 11 and 12, 2017, Secretary Mnuchin announced that the Treasury would implement "extraordinary measures" that delay when the debt limit will bind. Additionally, on December 8, 2017, the Bureau of the Fiscal Service suspended sales of certain Treasury securities to extend the Treasury's ability to meet statutory spending requirements without defaulting on its debt obligations. This Insight briefly examines the debt limit and the use of extraordinary measures, and will be updated periodically to reflect changes in the status of federal borrowing.
As part of its "power of the purse," Congress uses the statutory debt limit (codified in 31 U.S.C. §3101) as a means of restricting federal debt. Debt subject to the limit is more than 99% of total federal debt, and includes debt held by the public (which is used to finance budget deficits) and debt issued to federal government accounts (which is used to meet federal obligations). The debt limit acts as a congressional check on recent revenue and expenditure trends, though decisions affecting debt levels may have been agreed to by Congress and the Administration well in advance of debt limit deliberations. Some past debt limit legislation has linked debt limit increases with other fiscal policy proposals.
Extraordinary measures represent a series of actions that postpone when Congress must act on debt limit legislation. The authority for using extraordinary measures rests with the Treasury Secretary (codified in 5 U.S.C. §8348 and 5 U.S.C. §8909). Invoking extraordinary measures has delayed required action on the debt limit by periods ranging from a few weeks to several months, depending on when such measures were enacted (see the "How Long Do Extraordinary Measures Last?" section). Accounts and members of the public that are affected by extraordinary measures must be compensated for the delay in payment that resulted from such actions when the debt limit is subsequently modified.
On December 12, 2017, the Treasury announced the extraordinary measures that are currently available. The Fiscal Service suspended issuance of State and Local Government Securities on December 8. A Debt Issuance Suspension Period was invoked on December 11, suspending new investments and redeeming certain existing investments of the Civil Service Retirement and Disability Fund and the Postal Service Retiree Health Benefits Fund. On December 12, the Treasury suspended daily reinvestment of securities held in the G Fund. Similarly, the Treasury may suspend daily reinvestment of Treasury securities held in the Exchange Stabilization Fund.
Table 1 provides a description of the extraordinary measures used the last three times those measures were implemented. The Treasury estimates that the current implementation of extraordinary measures will provide $242.7 billion in headroom plus $7.3 billion every month that a Debt Issuance Suspension Period is declared.
|
Measure |
Headroom Added in December 2017 |
Headroom Added in March 2017 |
Headroom Added in March 2015 |
|
Suspension of reinvestment in Government Securities Investment Fund (G Fund) of the Federal Retirement System |
$208 billion |
$225 billion |
$195 billion |
|
Suspension of invested balance in Exchange Stabilization Fund |
$22 billion |
$23 billion |
$22 billion |
|
Declaration of a Debt Issuance Suspension Period |
$12.7 billion one-time and $7.3 billion per month |
$87 billion one-time and $7.3 billion per month |
$65 billion one-time and $6.8 billion per month |
|
Suspension of State and Local Government Securities |
$0 (prevents further increases in debt by $3 - $13 billion per month) |
$0 |
$0 |
Source: U.S. Department of Treasury, "Description of the Extraordinary Measures," December 12, 2017, available at https://www.treasury.gov/initiatives/Documents/Description-of-Extraordinary-Measures-2017_12_12_Final.pdf; "Description of Extraordinary Measures," March 16, 2017, available at https://www.treasury.gov/initiatives/Documents/Description_of_Extraordinary_Measures_2017_03_16.pdf; "Description of Extraordinary Measures," March 13, 2015, available at https://www.treasury.gov/initiatives/Documents/Debt%20Limit%20Letter%2020150313.pdf.
Short-term fluctuations in federal debt levels provide for substantial uncertainty in how long extraordinary measures can last. Federal balances fluctuate on a day-to-day basis in response to a number of factors, including the timing of payments for Social Security, military benefits, and other programs; interest payments on debt obligations; and the timing of certain receipts. Figure 1 shows federal daily balances to date in FY2018.
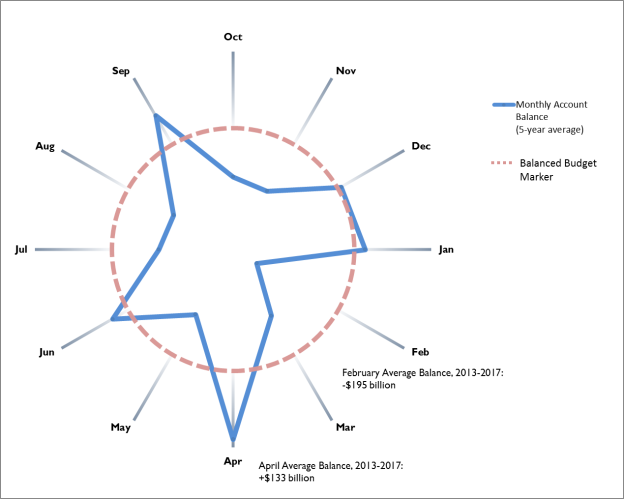
Monthly budget outcomes can also fluctuate with the timing of various activities. The federal government tends to record higher net budget surpluses in April (when many individual tax returns are filed) and September (as certain payments are due at the end of the fiscal year) while recording lower balances in other months. Figure 2 presents the average federal monthly account balances from the previous five fiscal years. Data points outside the circle indicate months that have recorded average surpluses from FY2013 through FY2017; points inside the circle represent months that have recorded average deficits in those years.
A November 30, 2017, CBO report stated that were extraordinary measures to be implemented upon reinstatement of the debt limit on December 9, such measures are forecasted to be exhausted in late March or early April 2018, while allowing for the possibility of an earlier or later date of exhaustion.