More than half of business income is generated by sole proprietorships, partnerships, and S corporations.1 Businesses that choose one of these organizational forms are often referred to as "pass-throughs" because the income they earn passes through the company to its owners without triggering a business-level tax. Pass-through owners then pay taxes on their share of the business's income according to the individual income tax rates. In contrast, the income of C corporations is taxed once at the corporate level according to the corporate tax system, and then a second time at the individual-shareholder level.
The fact that pass-throughs are responsible for more than half of business income is important because recent tax reform discussions have included the possibility of lowering the tax burden on these businesses. Proponents suggest that lowering taxes on pass-throughs may increase investment, output, and employment. On the other hand, lower taxes on pass-throughs could have important consequences on the income distribution and progressivity of the tax system, incentives to characterize labor income as business income, and federal tax revenues.
This report uses a nationally representative sample of individual tax returns to analyze who earns pass-through income.2 The report begins with examining who earns pass-through income generally. The analysis then summarizes the distribution of pass-through income for each type of organization. Recent tax reform proposals are then presented, followed by a review of several considerations that Congress may find useful as it continues to debate tax reform.
Who Earns Pass-Through Business Income?
Approximately 28.7 million (or one in five) taxpayers reported pass-through business income (or loss) totaling more than $687 billion in 2011.3 Among those earning pass-through income, the average amount reported was $26,011. These figures exclude capital gains income from pass-throughs and farming income. This section analyzes the distribution of pass-through income by adjusted gross income (AGI). When useful and possible, the analysis also distinguishes between sole proprietorship, partnership, and S corporation income, as well as active and passive income.
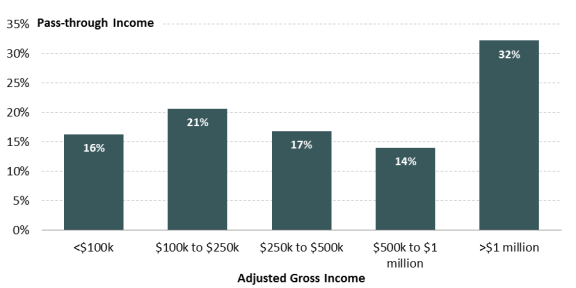
Figure 1 shows the distribution of pass-through income by several AGI groups. A more detailed distribution, along with the distribution of tax returns reporting pass-through income, may be found in Table A-1 of the Appendix. Taxpayers with an AGI of $100,000 or greater earned 84% of pass-through income, while accounting for roughly 23% of returns reporting pass-through income. Conversely, taxpayers with AGI less than $100,000 earned about 16% of pass-through income, but accounted for 77% of returns with pass-through income. A significant proportion of pass-through income was concentrated among upper-income earners. Taxpayers with an AGI over $250,000, for example, received 63% of pass-through income, but accounted for just over 6% of returns reporting such income. Those with an AGI in excess of $1 million earned about 32% of pass-through income, while filing roughly 1% of all returns reporting pass-through income.
|
Figure 1. Distribution of Net Pass-Through Income by AGI, 2011 |
 |
|
Source: CRS analysis of 2011 IRS Statistics of Income Public Use Files. |
Table 1 displays the distribution of pass-through income by business type. The distribution shows that sole proprietorship income was more evenly distributed across income groups than partnership and S corporation income. Partnership net income was more concentrated among upper income individuals with nearly all of it accruing to taxpayers with AGI in excess of $100,000, including nearly 48% accruing to those with AGI over $1 million. Nearly all of S corporation income was also earned by taxpayers with an AGI over $100,000, but a greater share of S corporation income than partnership income was earned by those with an AGI over $1 million—about 52%.
Table 1 also shows a concentration of net losses for partnerships and S corporations at the lower end of the income distribution. Pass-through income and losses are one component of AGI. Thus, if a taxpayer relies primarily on a partnership or S corporation for income, and the business realizes losses, the taxpayer's AGI will likely be negative. There are several scenarios which could explain the losses. A portion of these losses may be due to start-up businesses that are experiencing losses. It is also possible that a portion of these losses are due to failing businesses, both new and old. Lastly, some of the losses may be attributable to temporary business disruptions experienced at particular firms. Without more detailed data on the businesses associated with these losses, however, it is difficult to know for certain.
|
Adjusted Gross Income |
Sole Proprietorships |
Partnerships |
S Corporations |
|
< $10k |
2.65% |
-16.50% |
-8.95% |
|
$10k to $20k |
12.35% |
-0.17% |
0.14% |
|
$20k to $30k |
6.12% |
0.40% |
0.01% |
|
$30k to $40k |
4.09% |
0.34% |
0.51% |
|
$40k to $50k |
5.15% |
0.18% |
0.72% |
|
$50k to $75k |
9.42% |
1.52% |
2.46% |
|
$75 to $100k |
8.94% |
2.04% |
3.41% |
|
$100k to $250k |
25.44% |
17.20% |
17.51% |
|
$250k to $500k |
13.71% |
23.57% |
15.80% |
|
$500k to $1 million |
6.10% |
23.93% |
16.29% |
|
> $1 million |
6.01% |
47.50% |
52.11% |
|
Total |
100% |
100% |
100% |
|
Highest Earners |
|||
|
$1 million - $2 million |
2.95% |
18.68% |
14.53% |
|
$2 million - $5 million |
1.89% |
14.71% |
15.98% |
|
$5 million - $10 million |
0.72% |
6.33% |
9.45% |
|
> $10 million |
0.44% |
7.78% |
12.15% |
|
Total |
6.01% |
47.50% |
52.11% |
Source: CRS analysis of 2011 IRS Statistics of Income Public Use Files.
Partnership and S corporation income can be separated into active and passive income. The distinction between the two can be important because passive activity loss rules generally prevent passive losses from offsetting active income. Additionally, active income is exempt from the 3.8% net investment tax that was enacted as part of health care reform, but not imposed until the 2013 tax year.4 Active income is income resulting from active participation in a business, whereas passive income is income from a business in which the taxpayer did not materially participate. A business partner involved in the day to day management and operations of the business, for example, would earn active income, while a silent partner who has no involvement in the business outside of possibly financial commitments would earn passive income. Sole proprietorship income is not distinguished in the data used in this analysis. Most sole proprietors, however, will be actively involved in their business (since they are sole owner) suggesting that the overwhelming majority of sole proprietor income is active.
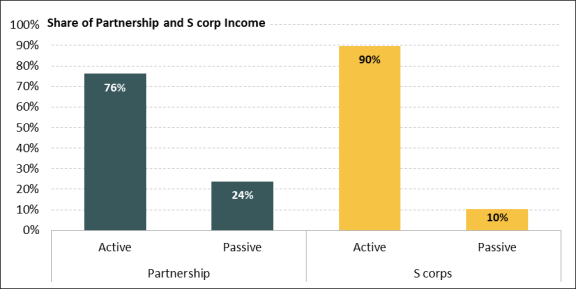
Figure 2 displays the distribution of active and passive income for partnerships and S corporations. Active income accounts for 76% of partnership income and 90% of S corporation income. Conversely, 24% of partnership income and 10% of S corporation income is passive. A significant share of passive income from either business type is concentrated among higher income individuals (see Table A-2 in the Appendix).
Tax Reform Considerations
Recent tax reform discussions have included lowering the tax rates and tax burden on pass-through income. Most recently, the majority party leaders of the House and Senate, along with the Trump Administration, issued the "Unified Framework for Fixing Our Broken Tax Code" on September 27, 2017, which proposes limiting the maximum tax rate on pass-through income to 25%. The House Republican Conference's "Better Way" tax reform blueprint, released on June 24, 2016, also proposes limiting the tax rate to 25%, but indicates that the lower rate will only apply to active pass-through income. Both proposals also include other changes that could potentially affect pass-throughs, such as the tax treatment of depreciable assets and business interest, as well as the restriction or repeal of other business deductions and credits. Because there is a great deal of uncertainty over exactly how these other changes may be implemented, the considerations presented below are reviewed within the context of reducing the tax rates and the general tax burden on pass-through income.
Economic Implications
Attention thus far appears to be primarily focused on the effect reducing taxes on pass-through income could have on the economy's performance, both in the short-run and long-run, the progressivity of the tax system, and small businesses. However, tax experts have also pointed out that the rate reduction could change the incentive for individuals to characterize labor income as business income. Additionally, there is the longer standing question of why the tax code treats businesses differently based on whether they are organized as a pass-through or C corporation, and what effect that has on the complexity of the tax system. This section discusses each of these issues in turn.
Lowering the maximum statutory tax rate on pass-through income would likely stimulate investment in the short-run. The rate reduction, however, may not stimulate as much new investment as other changes that have been discussed as part of tax reform. For example, both the Unified Framework and the Better Way propose allowing businesses to expense new investments.5 Expensing may be more stimulative, or at least better targeted, than a rate reduction since expensing would benefit new investments relatively more than rate reductions. A rate reduction would benefit all pass-through income and thus provide a windfall gain for old investments.
The longer-run effect on the economy from a rate reduction is less clear. This is particularly true if deficits are predicted to increase. Increased deficits may lead to higher future interest rates as the government competes with the private sector for financing. Additionally, policymakers in the future may grow concerned over the sustainability of deficits and raise taxes in response. A rise in interest rates or taxes could curtail or offset any positive effect from a tax rate reduction for pass-throughs or tax reform more generally. Still, without more details about the overall reform, it is difficult to determine more precisely what the impact would be in the short-run or the long-run from any changes. 6
While lowering the tax burden on pass-through income could potentially stimulate the economy, particularly in the short-run, it may also reduce the progressivity of the tax code. As previously stated, 62% of pass-through income was earned by taxpayers with an AGI over $250,000, and 32% was earned by individuals with an AGI in excess of $1 million. The distributions of partnership and S corporation income were more heavily skewed to the upper end of the income distribution. As a result, the benefit from lowering taxes on pass-through income is likely to accrue predominately to upper-income individuals. This would cause the tax system to become less progressive, all else equal.
Reducing the tax burden on pass-throughs seems to be partly driven by the assumption that pass-throughs and small business are synonymous. The data show that this is not the case; the majority of all businesses are small.7 For example, in 2011, more than 99% of both pass-throughs and C corporations had less than 500 employees, which is the most common employment-based threshold used by the Small Business Administration. Additionally, large firms are responsible for a non-trivial share of pass-through employment. About 24% of employees at pass-throughs worked at firms with more than 500 employees in 2011, which is more than the share who were employed at firms with 10 or fewer employees. If the goal of a particular tax policy is to assist small businesses, then basing the policy on a measure of firm size rather than legal form of organization may enhance its effectiveness.
Tax professionals have expressed concern that lowering the tax rate on pass-through business income may encourage some individuals to recharacterize the nature of their income to reduce their taxes. The Unified Framework and the Better Way both propose a maximum tax rate of 25% on pass-through business income. However, the Unified Framework would tax labor income at a maximum rate of at least 35%, and the Better Way would tax labor income at rate up to 33%.8 By taxing business income at a lower rate than labor income, employee-owners of pass-throughs may characterize labor income as business income to take advantage of the lower tax rate. Additionally, some individuals may create pass-through businesses through which to direct their compensation so as to benefit from the lower tax rate. The Unified Framework and Better Way plan recognize this potential challenge but do not lay out detailed steps that would be taken to prevent the recharacterization of income.9
Arguably, a comprehensive tax reform would address the discrepancy that exists in the taxation of corporate and non-corporate businesses. It is well known that this is not an easy task, but reducing the tax burden on pass-through income alone would not address this discrepancy or the inequity and inefficiencies that exist because two otherwise identical businesses are taxed differently because of their legal structure. Additionally, a rate reduction on pass-through (or corporate) income by itself does little to simplify the tax treatment of businesses. The majority of the complexity in the tax system is the result of special tax incentives such as exclusions, credits, and deductions. While policymakers have expressed a desire to pare back business tax incentives in exchange for a rate reduction there have not been any detailed proposals to do so during the most recent round of tax reform debates.
Budgetary and Revenue Impacts
The Joint Committee on Taxation (JCT) has not provided official revenue estimates for the Unified Framework or Better Way proposals as of the date of this writing. The Tax Policy Center (TPC), however, has conducted a preliminary analysis of the Unified Framework. The TPC has estimated that the proposal to limit the tax rate on pass-through income to 25% would generate a revenue loss of $769.6 billion over ten years.10 The TPC has also estimated that the rate reduction contained in the Better Way proposal would lose $412.8 billion over ten years.11 The difference in estimates is explained in part by the fact that the TPC assumed that under the Better Way proposal, characterization of labor income as pass-through income would not occur, whereas it did not make such an assumption for their analysis of the Unified Framework.
The Tax Foundation also analyzed the Better Way plan and found that the rate reduction on pass-through income would cost $515 billion over ten years using a "static" modeling approach, and $388 billion over ten years using a "dynamic" modeling approach.12 Dynamic revenue estimates incorporate economic feedback effects that can result in a portion of a tax rate reduction's static cost being offset by greater economic activity and thus greater tax revenues. The TPC also constructed a dynamic estimate for the Better Way plan, but not for individual provisions. As the date of this writing the Tax Foundation had not estimated the cost of the Unified Framework nor has the TPC conducted a dynamic analysis. It is important to emphasize that with any estimates made thus far by outside groups they must be interpreted with caution. Because detailed legislative language has not been released, estimators made assumptions about missing details needed to estimate the draft proposals. Changing these assumptions to reflect currently unavailable plan details would likely change revenue estimates, perhaps significantly.
Appendix. Detailed Distributions
Table A-1. Distribution of Individual Income Tax Returns and Pass-Through Income by Adjusted Gross Income, 2011
|
Adjusted Gross Income |
Returns Reporting Pass-Through Income |
% of Returns Reporting Pass-Through Income |
Total Pass-Through Income |
% of Total Pass-Through Income |
Average Pass-Through Income |
|
< $10k |
4,893,000 |
17.07% |
-$41.5 |
-6.04% |
-$8,488 |
|
$10k to $20k |
4,308,000 |
15.03% |
$34.6 |
5.04% |
$8,030 |
|
$20k - $30k |
2,611,000 |
9.11% |
$17.8 |
2.59% |
$6,814 |
|
$30k - $40k |
1,972,000 |
6.88% |
$13.2 |
1.92% |
$6,702 |
|
$40k - $50k |
1,792,000 |
6.25% |
$16.5 |
2.39% |
$9,182 |
|
$50k - $75k |
3,685,000 |
12.85% |
$34.8 |
5.07% |
$9,448 |
|
$75 - $100k |
2,728,000 |
9.52% |
$36.6 |
5.33% |
$13,429 |
|
$100k - $250k |
4,945,000 |
17.25% |
$141.9 |
20.66% |
$28,732 |
|
$250k - $500k |
1,096,000 |
3.82% |
$115.5 |
16.81% |
$105,511 |
|
$500k - $1 million |
401,652 |
1.40% |
$96.0 |
13.98% |
$239,319 |
|
> $1 million |
241,767 |
0.84% |
$221.4 |
32.23% |
$920,364 |
|
Total |
28,670,000 |
100% |
$686.9 |
100% |
$23,965 |
|
Highest Earners |
|||||
|
$1 million - $2 million |
148,001 |
0.52% |
$74.3 |
10.82% |
$502,427 |
|
$2 million - $5 million |
66,311 |
0.23% |
$68.3 |
9.94% |
$1,029,000 |
|
$5 million - $10 million |
16,960 |
0.06% |
$35.4 |
5.15% |
$2,084,000 |
|
> $10 million |
9,374 |
0.03% |
$43.5 |
6.33% |
$4,639,000 |
|
Total |
240,646 |
0.84% |
$221.4 |
32.23% |
$920,364a |
Table A-2. Distribution of Active and Passive Partnership and S Corporation Income by Adjusted Gross Income, 2011
|
Partnership |
S Corporation |
|||||||
|
Adjusted Gross Income |
Active |
Passive |
Active |
Passive |
||||
|
% of Total |
Average |
% of Total |
Average |
% of Total |
Average |
% of Total |
Average |
|
|
< $10k |
-19.48% |
-$75,693 |
-6.95% |
-$12,735 |
-9.77% |
-$61,666 |
-1.71% |
-$5,989 |
|
$10k to $20k |
-0.03% |
-$241 |
-0.62% |
-$2,571 |
0.09% |
$936 |
0.61% |
$2,617 |
|
$20k to $30k |
0.46% |
$4,124 |
0.18% |
$891 |
-0.02% |
-$235 |
0.25% |
$1,431 |
|
$30k to $40k |
0.35% |
$2,868 |
0.30% |
$1,412 |
0.52% |
$5,924 |
0.44% |
$2,224 |
|
$40k to $50k |
0.02% |
$194 |
0.68% |
$2,616 |
0.78% |
$8,278 |
0.19% |
$867 |
|
$50k to $75k |
1.35% |
$4,949 |
2.07% |
$2,808 |
2.49% |
$11,245 |
2.24% |
$4,018 |
|
$75 to $100k |
1.61% |
$6,709 |
3.43% |
$5,077 |
3.41% |
$15,449 |
3.41% |
$4,867 |
|
$100k to $250k |
15.68% |
$23,500 |
22.06% |
$11,698 |
18.65% |
$33,779 |
7.45% |
$3,867 |
|
$250k to $500k |
25.22% |
$90,207 |
18.30% |
$21,058 |
16.47% |
$97,779 |
9.97% |
$12,791 |
|
$500k to $1 million |
25.80% |
$184,720 |
17.95% |
$40,508 |
16.35% |
$224,629 |
15.67% |
$38,501 |
|
> $1 million |
49.04% |
$450,778 |
42.61% |
$122,342 |
51.04% |
$1,039,000 |
61.47% |
$210,185 |
|
Total |
100.00% |
$41,187 |
100.00% |
$15,582 |
100.00% |
$55,808 |
100.00% |
$17,328 |
|
Highest Earners |
||||||||
|
$1 million - $2 million |
19.69% |
$315,273 |
15.48% |
$76,700 |
14.61% |
$493,962 |
13.91% |
$79,532 |
|
$2 million - $5 million |
15.50% |
$488,934 |
12.20% |
$121,248 |
15.92% |
$1,146,000 |
16.44% |
$194,942 |
|
$5 million - $10 million |
6.51% |
$718,396 |
5.78% |
$203,757 |
9.23% |
$2,614,000 |
11.35% |
$535,222 |
|
> $10 million |
7.35% |
$1,314,000 |
9.15% |
$522,732 |
11.28% |
$5,332,000 |
19.79% |
$1,634,000 |
|
Total |
49.04% |
$450,778 |
42.61% |
$122,342 |
51.04% |
$1,039,000 |
61.47% |
$210,185 |
Source: CRS analysis of 2011 IRS Statistics of Income Public Use Files.
Note: Averages are conditional on having active or passive income from the respective business type.