Introduction
Each year when the Social Security trustees release their annual report, attention is focused on the projection of the year that the Social Security trust funds will become insolvent. In their 2017 report, the trustees project that, under their intermediate assumptions and under current law, the Federal Disability Insurance (DI) Trust Fund will become depleted in 2028 and the Federal Old-Age and Survivors Insurance (OASI) Trust Fund will do so in 2035.1 Although the two funds are legally separate, they are often described in combination. The trustees project that the combined Old-Age, Survivors, Disability Insurance (OASDI) trust funds will become depleted in 2034.
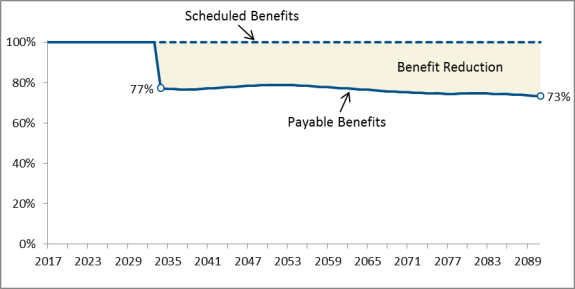
Some Americans may believe that if the trust funds were depleted, Social Security would be unable to pay any benefits. In fact, in 2034, the first year of projected insolvency of the combined Social Security trust funds, the program is projected to have enough tax revenue to pay about 77% of scheduled benefits; that percentage would decline to 73% by the end of the 75-year projection period.
Although benefits would be paid in some form, it is unclear how the necessary reductions would be implemented, because the Social Security Act does not specify what would happen to benefits if a trust fund became depleted. One option would be to pay full benefits on a delayed schedule; another would be to make timely but reduced payments.
This report explains what the Social Security trust funds are and how they work. It describes the historical operations of the trust funds and the Social Security trustees' projections of future operations. It explains what could happen if Congress allowed the trust funds to run out. It also analyzes two scenarios that assume Congress waits until the moment of insolvency to act, showing the magnitude of benefit cuts or tax increases needed and how such changes would affect beneficiaries.
The Social Security Trust Funds2
How the Trust Funds Work
Social Security is a work-related, federal insurance program that provides retirement, disability, and survivor benefits to qualifying workers and their eligible family members, provided the worker spent a sufficient portion of his or her career working and paying Social Security taxes in jobs covered by the program. Social Security's income and outlays are accounted for through two legally distinct trust funds: the OASI Trust Fund and the DI Trust Fund. A trust fund is an accounting mechanism used to link income dedicated by law for a specific program or purpose with the expenditures made to its beneficiaries. The OASI and DI trust funds operate separately but are closely linked. Several times in the past, Congress has authorized the reallocation of the Social Security payroll tax rate to equalize the financial conditions of the two trust funds.3 In part because of those experiences, analysts often treat the two funds collectively as the combined OASDI trust funds.
Trust Fund Receipts
The trust funds' primary source of income is the Social Security payroll tax, but they also receive income from federal income taxes on benefits and interest on the funds' balance. The payroll tax consists of a 12.40% total tax on wages and self-employment income up to the taxable maximum, which in 2017 is $127,200 and generally increases annually with average earnings growth in the economy.4 Of the 12.40% total, 10.03% is credited to the OASI Trust Fund and 2.37% to the DI Trust Fund.5 Some Social Security benefits paid to people with incomes above a certain threshold are subject to federal income tax.6 Most of the resulting revenue is credited to the Social Security trust funds, and some goes to Medicare's Hospital Insurance (HI) Trust Fund.7 In 2016, payroll taxes accounted for 87.3% of Social Security income, interest accounted for 9.2%, and income taxes on benefits accounted for 3.4%.8
Trust Fund Expenditures
In 2016, 98.8% of the trust funds' expenditures paid for benefits. Administrative expenses accounted for 0.7% of expenditures. The remaining 0.5% was transferred to the Railroad Retirement Board (RRB) as part of a financial interchange with the RRB.9 This annual exchange of funds places the Social Security trust funds in the same financial position in which they would have been if railroad service had been covered by Social Security.
Annual Surpluses and Deficits
In years when Social Security's total receipts, including interest, exceed expenditures, then the trust funds have a surplus. By law, that surplus is invested in special-issue U.S. Treasury securities, which are backed by the full faith and credit of the federal government. In other words, Social Security's cash surpluses are borrowed by the general fund of the U.S. Treasury. The Treasury, in turn, incurs an obligation to repay the bonds with interest.
When the trust funds spend more than they receive in taxes and interest, they have a deficit, which requires Social Security to redeem bonds accumulated in previous years. Treasury pays benefits with cash from general revenues and writes down an equivalent amount of the trust fund's bond holdings.10
An alternative measure of the trust funds' finances is given by the cash-flow balance. That measure does not consider interest income, so the trust funds run a cash-flow surplus when tax income exceeds expenditures, and they run a cash-flow deficit when they spend more than they receive in taxes.
Trust Fund Solvency
If the trust funds are not able to pay all of current expenses out of current tax income and accumulated trust fund assets, they are insolvent. Insolvency means that Social Security's trust funds are unable to pay benefits in full and on time. It does not mean that Social Security will be completely broke and unable to pay any benefits.
Historical Trust Fund Operations
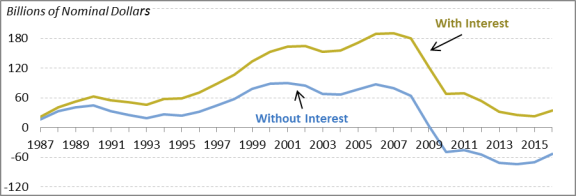
The OASI Trust Fund was created by the Social Security Amendments of 1939 (P.L. 76-379) and superseded the Old-Age Reserve Account established by the original Social Security Act in 1935 (P.L.74-271).11 The DI Trust Fund was established as part of the Social Security Amendments of 1956 (P.L. 84-880)—the same legislation that created DI.12 Neither of the Social Security trust funds has ever become insolvent. In 2016, the OASI Trust Fund had a surplus of $21.1 billion, and the DI Trust Fund had a surplus of $14.1 billion, for a combined surplus of $35.2 billion, including interest (Figure 1).13 Interest income for the combined funds was $88.4 billion, so on a cash-flow basis, there was a combined 2016 deficit of $53.2 billion.14 At the end of 2016, the assets reserves of the DI Trust Fund were $46.34 billion and the asset reserves of the OASI Trust Fund were $2.80 trillion, for a combined balance of nearly $2.85 trillion.15
|
Figure 1. Annual Net Change in the Asset Reserves of the Combined OASDI Trust Funds, With and Without Interest Income, 1987-2016 |
 |
|
Source: CRS, based on Social Security Administration (SSA), Office of the Chief Actuary (OCACT), "Social Security Trust Fund Data," https://www.ssa.gov/oact/STATS/table4a3.html. |
Cash-Flow Surpluses and Deficits
The trust funds have run annual surpluses in most years. Except for the first decades of the program and a few years beginning in the late 1960s, these annual surpluses were typically small relative to the size of the trust funds' expenditures. Beginning in 1975, the combined trust funds ran annual deficits.16 The trust funds made up the difference between income and outgo during these years by redeeming some of the bonds accumulated in earlier years. In other words, in those years, the Social Security trust funds received net transfers from the Treasury's general fund.
Near-Insolvency of the OASI Trust Fund in the Early 1980s
The Social Security trust funds have never been depleted. However, in the early 1980s, a solvency crisis loomed for the OASI Trust Fund. The 1982 Social Security Trustees Report projected that in the absence of legislative changes the OASI Trust Fund would become insolvent by July 1983.17 To relieve the pressure on the OASI Trust Fund temporarily, Congress permitted the fund to borrow from the DI and HI trust funds through the end of 1982.18 On November 5, 1982, the Treasury Department announced that the balance of the OASI Trust Fund had fallen to zero, and that the Treasury would be unable to redeem the amount of securities necessary to cover the OASI benefit checks that had been delivered on November 3.19 To cover the shortfall, the Secretary of the Treasury authorized a $581 million loan from the DI Trust Fund to the OASI Trust Fund. Additional loans from the DI and HI trust funds to the OASI trust fund were made before the temporary interfund borrowing authority expired.
This measure gave policymakers time to develop a more sustainable solution to Social Security's solvency problem. The Social Security Amendments of 1983 (P.L. 98-21) increased Social Security income and reduced spending. As a result, the combined trust funds ran significant surpluses, which on average exceeded a quarter of outlays from 1987 to 2009. The 1982 loans from the DI and HI trust funds to the OASI Trust Fund were repaid, with interest, by the end of April 1986.20
The aging of the baby-boom population and the recent recession and subsequent weak economy have resulted in higher outlays and lower tax revenues for Social Security. Since 2010, the combined trust funds have run cash-flow deficits, which are projected to continue indefinitely under current law. However, because interest income has exceeded the cash-flow deficit, the combined trust funds have continued to run surpluses, which averaged 6% of total outlays from 2010 through 2016.
Cash-flow deficits do not affect Social Security directly. However, if the non-Social Security portion of the federal budget is in deficit, redemption of trust fund bonds puts additional pressure on the overall federal budget.
Recent Near-Insolvency of the DI Trust Fund21
In their 2012-2015 annual reports, the trustees projected that the DI Trust Fund would be depleted in late 2016 (see Table A-1 in the Appendix). At the end of 2015, the balance of the DI Trust Fund was $32.3 billion, down from $60.2 billion at the start of the year.22 The declining solvency of the DI Trust Fund was the result of an imbalance between the fund's income and cost. Between 1995 and 2015, tax revenues to the DI Trust Fund were relatively flat as a percentage of taxable payroll, while cost as a share of taxable payroll grew markedly.23 The increase in cost stemmed largely from the growth in the number of beneficiaries in the program.24 During that period, the number of disabled-worker beneficiaries increased by 113%, from nearly 4.2 million to more than 8.9 million.25 (The number of disabled-worker beneficiaries has since decreased to 8.7 million.26)
On November 2, 2015, President Barack Obama signed into law the Bipartisan Budget Act of 2015 (BBA 2015; P.L. 114-74). Among other provisions, the BBA 2015 authorized a temporary reallocation of the payroll tax rate between the OASI and DI trust funds to provide DI with a larger share for 2016 through 2018. Specifically, the DI Trust Fund's share of the combined tax rate increased by 0.57 percentage points at the beginning of 2016, from 1.80% to 2.37%. Because the BBA 2015 did not change the combined payroll tax rate of 12.40%, the portion of the tax rate allocated to OASI decreased by a corresponding amount. This means that OASI's share of the combined tax rate declined by 0.57 percentage points at the start of 2016, from 10.60% to 10.03%. For 2019 and later, the shares allocated to the DI and OASI trust funds are scheduled to return to their 2015 levels: 1.80% to the DI Trust Fund and 10.60% to the OASI Trust Fund.
Social Security Financial Projections
This report focuses on the trustees' "intermediate" Social Security projections, which reflect their "best estimates" of future demographic and economic trends.27 Under that set of assumptions, the DI Trust Fund is depleted in 2028 and the OASI Trust Fund is depleted in 2035.28 Considered on a hypothetical combined basis, the trust funds would become insolvent in 2034. However, the trustees' projections—like all long-term projections—are uncertain. They estimate that there is a 10% chance that the combined trust funds would become insolvent in 2031 or earlier and a 10% chance that insolvency would occur in 2039 or later.29 Using somewhat different assumptions and projection methods, the Congressional Budget Office (CBO) projects that the combined trust funds will become insolvent in 2030.30
Even after insolvency, the trust funds will continue to receive income from payroll taxes and income taxes on benefits that will allow some benefits to be paid. The trustees project that, under their intermediate assumptions, tax income will be sufficient to cover about 77% of scheduled benefits following insolvency of the combined trust funds in 2034, declining to 73% in 2091.
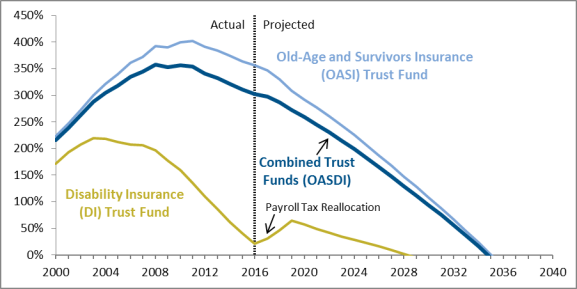
Trust Fund Ratio
To put the trust fund balance in context, analysts commonly consider the trust fund ratio: the balance in the trust funds at the beginning of a year divided by projected outlays for that year. The trust fund ratio thus represents the proportion of a year's cost that could be paid solely with the reserves at the beginning of the year. The ratio for the combined trust funds peaked at 358% at the end of 2008. The combined trust fund ratio declined to 305% at the end of 2016 and is continuing to fall. By definition, the ratio will reach zero when the trust funds become depleted. As shown in Figure 2, the DI Trust Fund ratio is projected to increase through 2018 because of the temporary reallocation of the payroll tax rate between the trust funds.
|
Figure 2. Actual and Projected Social Security Trust Fund Ratios, 2000-2040 (trust fund assets at the beginning of the year as a share of annual cost) |
 |
|
Source: Congressional Research Service (CRS), based on The Board of Trustees, Federal Old-Age and Survivors Insurance and Federal Disability Insurance Trust Funds, The 2017 Annual Report of the Board of Trustees of the Federal Old-Age and Survivors Insurance and Federal Disability Insurance Trust Funds., July 13, 2017, Table IV.B4, https://www.ssa.gov/oact/tr/2017/index.html. Note: Projections are based on the trustees' 2017 intermediate assumptions. |
Legal Background on Trust Fund Insolvency
The Antideficiency Act
The Social Security Act specifies that benefit payments shall be made only from the trust funds (i.e., accumulated trust fund assets).31 Another law, the Antideficiency Act, prohibits government spending in excess of available funds.32 Consequently, if the Social Security trust funds become insolvent—that is, if current tax income and accumulated assets are not sufficient to pay the benefits to which people are entitled—the law effectively prohibits full Social Security benefits from being paid on time.
Legal Entitlement to Social Security Benefits
The Social Security Act states that every individual who meets program eligibility requirements is entitled to benefits.33 Social Security is an entitlement program, which means that the federal government is legally obligated to pay Social Security benefits to all those who are eligible for them as set forth in the statute.34 If the federal government fails to pay the benefits stipulated by law, beneficiaries could take legal action. Insolvency would not relieve the government of its obligation to provide benefits.
What Happens to Benefits in the Case of Insolvency?
The Antideficiency Act prohibits government agencies from paying for benefits, goods, or services beyond the limit authorized in law for such payments. The authorized limit in law for Social Security benefits is the balance of the trust fund. The Social Security Act does not stipulate what would happen to benefit payments if the trust funds ran out. As a result, either full benefit checks may be paid on a delayed schedule or reduced benefits would be paid on time.35 In either case, total payable benefits would be lower than scheduled benefits.
To see how a delay could affect beneficiaries, consider the current Social Security benefit payment schedule, shown in Table 1. (This schedule may be changed at the discretion of the Commissioner of Social Security.36)
|
Benefits Paid On |
Birth Date of Worker on Whose Record Benefits Are Paid |
|
Third of every month |
Any birth date for: (1) Social Security beneficiaries who also receive Supplemental Security Income benefits or who reside in a foreign country, and (2) Most beneficiaries who began to receive benefits prior to June 1997. |
|
Second Wednesday |
1st to 10th day of the month |
|
Third Wednesday |
11th to 20th day of the month |
|
Fourth Wednesday |
21st to 31st day of the month |
Source: CRS, based on 20 C.F.R. §404.1807 and SSA, OCACT, "Cyclical Payment of Social Security Benefits," http://ssa.gov/OACT/ProgData/cyclicalpay.html.
Note: For beneficiaries scheduled to receive payments on the third of the month, benefits may be paid earlier if the third is on a weekend or holiday.
New beneficiaries' payment dates are generally based on their day of birth—for example, if a retired worker was born on the first of the month (e.g., June 1), his or her benefit payment is made on the second Wednesday in the month.37 If trust fund insolvency caused delays in the payment schedule, benefit payments could be made in the usual order—first to those who receive benefits on the third of the month, then to those on the second Wednesday of the month, and so on, until the remainder of the trust funds' balance reached zero. At that point, no benefits could be paid until more tax receipts were credited to the trust funds. Then benefit payments could be picked up where they left off when the trust funds ran out. This cycle could continue indefinitely. The timing of these payments would be unpredictable.
What If Congress Waits to Act?
There are many options to restore Social Security solvency, which could be combined or targeted in a variety of ways. For example, Congress could decrease Social Security benefits.38 Benefit cuts could be applied proportionately to all beneficiaries or structured to protect certain people, such as disabled or low-income beneficiaries. Congress could also increase Social Security's income by raising payroll or other taxes or by transferring funds from the Treasury's general fund. Payroll tax increases could be applied proportionately to all workers or targeted to certain workers, such as those who earn more than the taxable maximum ($127,200 in 2017).
The next section presents two policy options that could be implemented after the trust funds' combined balance fell to zero to ensure a balanced system in later years:
- the benefit cut scenario, under which benefits would be cut across the board; and
- the tax increase scenario, under which the payroll tax rate would increase.
Both scenarios assume that current law would remain in place until the combined trust funds became insolvent. If changes were made sooner, they could be smaller, since the burden of lower benefits or higher taxes would be shared by more beneficiaries or workers over a longer period.39 Either scenario would essentially convert Social Security to a pure pay-as-you-go system, in which income and outgo are equal on an annual basis and there are no trust fund assets. These scenarios are only two of a wide range of possibilities.
Benefit Cut Scenario
Size of Benefit Cuts
If the trust funds were allowed to run out, Congress could eliminate annual cash-flow deficits by cutting benefits so that spending equals tax income on an annual basis. According to the trustees, achieving annual balance would require benefit cuts of 23% in 2034, the first year of insolvency, rising to 27% by 2091. To maintain balance after 2091, the Social Security trustees project that larger benefit reductions would be needed, because people would continue to live longer and therefore collect benefits for longer periods.
Figure 3 shows the percentage of scheduled benefits that are payable each year with scheduled revenues. One way to understand how such a reduction would affect beneficiaries is to examine the effect on projected replacement rates and real benefit amounts for hypothetical workers.
Replacement Rates
One way of measuring the adequacy of Social Security benefits is the replacement rate, the ratio of an individual's program benefit to past covered earnings. Replacement rates can be calculated in different ways. This report uses the following methodology employed by SSA's actuaries:40
|
Replacement Rate = |
Initial Social Security Benfit |
|
Average Indexed Monthly Earnings from Covered Work |
Social Security was established to replace income lost to a family as a result of the retirement, death, or disability of a worker. To ensure that average benefit levels grow along with average wages—thus keeping replacement rates generally steady—initial Social Security benefits are indexed to wage growth. Historically, wages have generally risen faster than prices, allowing the standard of living to rise from one generation to the next.
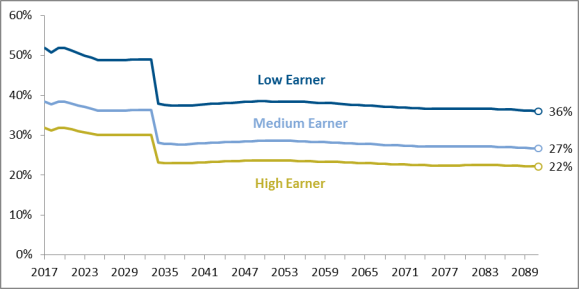
Figure 4 shows projected replacement rates under the benefit cut scenario for hypothetical low, medium, and high earners who claim retirement benefits at the age of 65 from 2017 through 2091.41 The Social Security benefit formula is progressive, so the replacement rate is higher for people with lower lifetime earnings in covered employment or self-employment than for people with higher lifetime earnings. In 2017, the estimated rates are 52% for low earners, 38% for medium earners, and 32% for high earners.42
Between 2017 and 2025, replacement rates for retired workers aged 65 are projected to decrease by about 6% due to the scheduled increase in the full retirement age (FRA), which is the age at which unreduced Social Security retirement benefits are first payable.43 The FRA for workers born between 1943 and 1954 is 66. Under current law, Social Security's FRA increases in two-month increments for workers born between 1955 and 1959 until reaching age 67 for workers born in 1960 or later. Because the scheduled increases in the FRA would increase the size of the benefit reduction for workers who claim benefits early at age 65 relative to previous generations, replacement rates for workers aged 65 would fall. After 2025, however, the FRA would remain 67, and scheduled replacement rates would remain steady. But when the trust funds become depleted, payable benefits and replacement rates would fall immediately by 23%.
|
Figure 4. Replacement Rates for Retired Workers Who Claim at Age 65 Under the Benefit Cut Scenario, 2017-2091 (benefits as a share of average lifetime earnings in covered employment or self-employment) |
 |
|
Source: CRS, based on 2017 Payable Benefits Memo and SSA, OCACT, Replacement Rates for Hypothetical Retired Workers, Actuarial Note 2017.9, July 2017, https://www.ssa.gov/oact/NOTES/ran9/an2017-9.pdf. Notes: Projections are based on the trustees' 2017 intermediate assumptions. Replacement rates are for hypothetical earners who claim retirement benefits at age 65. |
Because lower earners have higher replacement rates, the 23% reduction would result in a larger percentage point reduction in replacement rates for low earners than for high earners. The replacement rate for low earners would fall from 49% in 2033 to 38% in 2034, a decline of 11 percentage points. In contrast, the replacement rate for high earners would fall from 30% in 2033 to 23% in 2034, a 7-percentage-point drop.
Real Benefit Levels
Another measure of benefit adequacy is initial annual benefit amounts. Since benefits are based on workers' lifetime earnings, higher earners tend to receive higher benefit amounts than lower earners. In 2017, a hypothetical low earner is estimated to receive an annual Social Security benefit of $11,517, a medium earner a benefit of $18,971, and a high earner a benefit of $25,150.44 Figure 5 shows future initial real benefit amounts in 2017 dollars (i.e., after adjusting for inflation), which illustrates how the purchasing power of benefits will change over time.
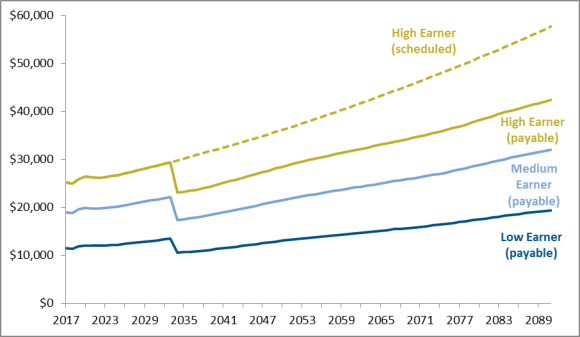
Because average real earnings generally grow over time, scheduled real benefits also grow. The trustees project that scheduled initial real benefit amounts for hypothetical individuals claiming retirement benefits at the age of 65 will increase by 18% between 2017 and 2034.45 Under the benefit cut scenario, real payable benefit levels are projected to drop by 23% after the trust funds become insolvent in 2034, then to once again rise gradually.46 Under the trustees' projections, benefits in 2035 would be 8% lower than they are today, but by 2042 they would again exceed today's levels and would continue to increase thereafter.
Payroll Tax Increase Scenario
Upon trust fund depletion, the system could also be balanced by raising the payroll tax rate so that the tax income would be sufficient to pay scheduled benefits each year.
Size of Payroll Tax Rate Increases
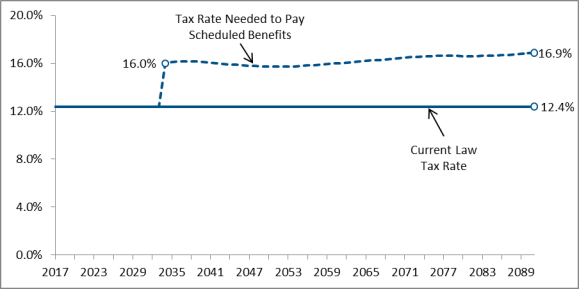
The trustees project that paying scheduled benefits after depletion in 2034 would require an increase in the combined employee and employer payroll tax rate of 3.6 percentage points, from the current 12.4% to 16.0%, after insolvency in 2034. To sustain balance, the payroll tax rate would have to reach 16.9% by 2090, the last year of the 75-year projection period.47 Figure 6 shows the combined payroll tax rate under current law and the combined payroll tax rate needed to pay scheduled benefits from 2017 to 2091.
Impact of Payroll Tax Increases
Raising the payroll tax rate would increase most workers' taxes by the same proportion. However, because covered earnings are taxable only up to a specified maximum ($127,200 in 2017), the effective increase in the payroll tax would be smaller in percentage terms for people who earn more than the taxable maximum than for other workers. Unlike the federal income tax, the Social Security payroll tax is levied at a flat rate starting at the first dollar of earnings.
Conclusion
Under current law, the Social Security trust funds will almost certainly become insolvent. The sooner changes are made to the program, the smaller and less abrupt the changes would need to be to maintain solvency. Prompt action would also allow Congress to gradually phase in changes, rather than abruptly cutting benefits or raising taxes, thus allowing workers to plan in advance for their retirements.
Appendix. Key Dates Projected for the Social Security Trust Funds
Table A-1. Key Dates Projected for the Social Security Trust Funds as Shown Under the Intermediate Assumptions in Trustees Reports from 1983 to 2017
|
Year of Report |
Year of Projected Depletion |
Year That Cost First Exceeds Non-Interest Income |
Year That Cost First Exceeds Total Income |
||||||
|
OASI |
DI |
OASDI |
OASI |
DI |
OASDI |
OASI |
DI |
OASDI |
|
|
Intermediate II-B Projectionsa |
|||||||||
|
1983 |
2021 |
2047 |
|||||||
|
1984 |
2050 |
2021 |
2012 |
2021 |
2045 |
2038 |
2044 |
||
|
1985 |
2050 |
2034 |
2049 |
2019 |
2010 |
2019 |
2032 |
2020 |
2032 |
|
1986 |
2054 |
2026 |
2051 |
2020 |
2009 |
2019 |
2035 |
2017 |
2033 |
|
1987 |
2055 |
2023 |
2051 |
2020 |
2008 |
2019 |
2036 |
2013 |
2033 |
|
1988 |
2050 |
2027 |
2048 |
2019 |
2009 |
2019 |
2033 |
2016 |
2032 |
|
1989 |
2049 |
2025 |
2046 |
2019 |
2009 |
2018 |
2032 |
2014 |
2030 |
|
1990 |
2046 |
2020 |
2043 |
2019 |
2008 |
2017 |
2030 |
2011 |
2028 |
|
Intermediate Projections |
|||||||||
|
1991 |
2045 |
2015 |
2041 |
2018 |
1998 |
2017 |
2030 |
2011 |
2028 |
|
1992 |
2042 |
1997 |
2036 |
2018 |
1992 |
2016 |
2028 |
1992 |
2024 |
|
1993 |
2044 |
1995 |
2036 |
2019 |
1993 |
2017 |
2030 |
1993 |
2025 |
|
1994 |
2036 |
1995 |
2029 |
2016 |
1994 |
2013 |
2024 |
1994 |
2019 |
|
1995 |
2031 |
2016 |
2030 |
2014 |
2003 |
2013 |
2021 |
2007 |
2020 |
|
1996 |
2031 |
2015 |
2029 |
2014 |
2003 |
2012 |
2021 |
2007 |
2019 |
|
1997 |
2031 |
2015 |
2029 |
2014 |
2004 |
2012 |
2021 |
2007 |
2019 |
|
1998 |
2034 |
2019 |
2032 |
2015 |
2006 |
2013 |
2023 |
2009 |
2021 |
|
1999 |
2036 |
2020 |
2034 |
2015 |
2006 |
2014 |
2024 |
2009 |
2022 |
|
2000 |
2039 |
2023 |
2037 |
2016 |
2007 |
2015 |
2026 |
2012 |
2025 |
|
2001 |
2040 |
2026 |
2038 |
2016 |
2008 |
2016 |
2027 |
2015 |
2027 |
|
2002 |
2043 |
2028 |
2041 |
2018 |
2009 |
2017 |
2028 |
2018 |
2027 |
|
2003 |
2044 |
2028 |
2042 |
2018 |
2008 |
2018 |
2030 |
2018 |
2028 |
|
2004 |
2044 |
2029 |
2042 |
2018 |
2008 |
2018 |
2029 |
2017 |
2028 |
|
2005 |
2043 |
2027 |
2041 |
2018 |
2005 |
2017 |
2028 |
2014 |
2027 |
|
2006 |
2042 |
2025 |
2040 |
2018 |
2005 |
2017 |
2028 |
2013 |
2027 |
|
2007 |
2042 |
2026 |
2041 |
2018 |
2005 |
2017 |
2028 |
2013 |
2027 |
|
2008 |
2042 |
2025 |
2041 |
2018 |
2005 |
2017 |
2028 |
2012 |
2027 |
|
2009 |
2039 |
2020 |
2037 |
2017 |
2005 |
2016 |
2025 |
2009 |
2024 |
|
2010 |
2040 |
2018 |
2037 |
2018 |
2005 |
2015 |
2026 |
2009 |
2025 |
|
2011 |
2038 |
2018 |
2036 |
2017 |
2005 |
2010 |
2025 |
2009 |
2023 |
|
2012 |
2035 |
2016 |
2033 |
2010 |
2005 |
2010 |
2023 |
2009 |
2021 |
|
2013 |
2035 |
2016 |
2033 |
2010 |
2005 |
2010 |
2022 |
2009 |
2021 |
|
2014 |
2034 |
2016 |
2033 |
2010 |
2005 |
2010 |
2022 |
2009 |
2020 |
|
2015 |
2035 |
2016 |
2034 |
2010 |
2005 |
2010 |
2022 |
2009 |
2020 |
|
2016 |
2035 |
2023 |
2034 |
2010 |
2019 |
2010 |
2022 |
2019 |
2020 |
|
2017 |
2035 |
2028 |
2034 |
2010 |
2019 |
2010 |
2022 |
2019 |
2022 |
Source: CRS, based on data from 1983-2017 Social Security Trustees Reports and information provided by SSA.
a. From 1983 to 1990, two intermediate forecasts were prepared (II-A and II-B). The intermediate II-B forecast corresponds more closely to the intermediate forecast in subsequent years.
b. Trust fund expected to remain solvent throughout the long-range projection period.