The National Park Service's (NPS's) backlog of deferred maintenance (DM)—maintenance that was not done as scheduled or as needed—is an issue of ongoing interest to Congress. The agency estimated its DM needs for FY2016 at $11.332 billion. Although other federal land management agencies also have DM backlogs, NPS's backlog is the largest.1 Because unmet maintenance needs may damage park resources, compromise visitors' experiences in the parks, and jeopardize safety, NPS DM has been a topic of concern for Congress and for nonfederal stakeholders. Potential issues for Congress include, among others, how to weigh NPS maintenance needs against other financial demands within and outside the agency, how to ensure that NPS is managing its maintenance activities efficiently and successfully, and how to balance the maintenance of existing parks with the establishment of new park units. This report addresses frequently asked questions about NPS DM. The discussion is organized under the headings of general questions, funding-related questions, management-related questions, and questions on Congress's role in addressing the backlog.
General Questions
What Is Deferred Maintenance?
The Federal Accounting Standards Advisory Board defines deferred maintenance and repairs (DM&R) as "maintenance and repairs that were not performed when they should have been or were scheduled to be and which are put off or delayed for a future period."2 NPS uses similar language to define deferred maintenance.3 Although NPS uses the term DM rather than DM&R, its estimates also include repair needs. Following NPS's usage, this report uses the term DM to refer to NPS's deferred maintenance and repair needs. Members of Congress and other stakeholders also often refer to DM as the maintenance backlog.4
As suggested by the above definition, DM does not include all maintenance, only maintenance that was not accomplished when scheduled or needed and was put off to a future time. Another type of maintenance is cyclic maintenance—that is, maintenance performed at regular intervals to prevent asset deterioration, such as to replace a roof or upgrade an electrical system at a scheduled or needed time.5 Although NPS considers cyclic maintenance separately from DM, NPS has emphasized the importance of cyclic maintenance for controlling DM costs. Cyclic maintenance, the agency has stated, "prevent[s] the creation of DM and enabl[es] repairs to fulfill their full life expectancy."6 NPS also performs routine, day-to-day maintenance as part of its facility operations activities. Such activities include, for example, mowing and weeding of landscapes and trails, weatherizing a building prior to a winter closure, and removing litter.7
How Big Is NPS's Maintenance Backlog?
NPS estimated its total DM for FY2016 at $11.332 billion.8 This amount is nearly evenly split between transportation-related DM in the "Paved Roads and Structures" category and mostly non-transportation-related DM for all other facilities (see Table 1). The Paved Roads and Structures category includes paved roadways, bridges, tunnels, and paved parking areas. The other facilities are in eight categories: Buildings, Housing, Campgrounds, Trails, Water Systems, Wastewater Systems, Unpaved Roads, and All Other.9
|
Paved Roads and Structures |
$5.669 |
|
All Other Facilities |
$5.663 |
|
Buildings |
$2.060 |
|
Housing |
$0.183 |
|
Campgrounds |
$0.074 |
|
Trails |
$0.489 |
|
Water Systems |
$0.393 |
|
Wastewater Systems |
$0.275 |
|
Unpaved Roads |
$0.217 |
|
All Other |
$1.971 |
|
Total |
$11.332 |
Source: NPS, NPS Asset Inventory Summary, September 30, 2016, at https://www.nps.gov/subjects/plandesignconstruct/loader.cfm?csModule=security/getfile&PageID=5547439.
NPS also estimates annually a subset of DM that includes its highest-priority non-transportation-related facilities. For FY2016, DM for this subset of key facilities was estimated at $2.271 billion.
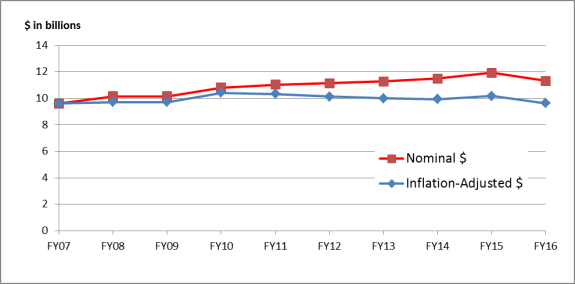
Has the Maintenance Backlog Been Increasing or Decreasing?
NPS's estimated maintenance backlog increased for most of the past decade before dropping in FY2016. Over the decade as a whole (FY2007-FY2016), Figure 1 and Table 2 show a growth in NPS DM of $1.718 billion in nominal dollars and $0.021 billion in inflation-adjusted dollars.
|
Figure 1. NPS Maintenance Backlog Estimates, FY2007-FY2016 ($ in billions) |
 |
|
Nominal $ |
Inflation-Adjusted $ |
|
|
FY2007 |
9.614 |
9.614 |
|
FY2008 |
10.168 |
9.725 |
|
FY2009 |
10.169 |
9.711 |
|
FY2010 |
10.828 |
10.412 |
|
FY2011 |
11.044 |
10.330 |
|
FY2012 |
11.158 |
10.128 |
|
FY2013 |
11.269 |
9.995 |
|
FY2014 |
11.493 |
9.948 |
|
FY2015 |
11.927 |
10.182 |
|
FY2016 |
11.332 |
9.635 |
|
Change, FY2007-FY2016 |
+1.718 |
+0.021 |
Sources for Figure 1 and Table 2: Nominal-dollar estimates for FY2007-FY2013 were calculated by CRS based on deferred maintenance ranges provided to CRS by the Department of the Interior (DOI) Budget Office. Nominal-dollar estimates for FY2014-FY2016 are from NPS, "NPS Deferred Maintenance Reports," at https://www.nps.gov/subjects/plandesignconstruct/defermain.htm. See page 5 for additional information on sources. Adjustments for inflation (shown in 2007 dollars) use the Bureau of Economic Analysis, Table 3.9.4, "Price Indexes for Government Consumption Expenditures and Gross Investment," for nondefense structures, annual indexes, at http://www.bea.gov/iTable/iTable.cfm?ReqID=9&step=1#reqid=9&step=1&isuri=1.
What Factors Contribute to Growth or Reduction of the Backlog?
Multiple factors may contribute to growth or reduction in the NPS maintenance backlog, and stakeholders may disagree as to their respective importance. One key driver of growth in NPS maintenance needs has been the increasing age of agency infrastructure. Many agency assets—such as visitor centers, roads, utility systems, and other assets—were constructed by the Civilian Conservation Corps in the 1930s or as part of the agency's Mission 66 infrastructure initiative in the 1950s and 1960s.10 As these structures have reached or exceeded the end of their anticipated life spans, unfunded costs of repair or replacement have contributed to the DM backlog. Further, agency officials point out, as time goes by and needed repairs are not made, the rate at which such assets deteriorate is accelerated and can result in "a spiraling burden."11
Another key factor is the amount of funding available to the agency to address DM. The sources and amounts of NPS funding for DM are discussed in greater detail below, in the section on "Funding Questions." NPS does not aggregate the amounts it receives and uses each year to address deferred maintenance, but agency officials have stated repeatedly that available funding has been inadequate to meet DM needs.12 In recent years, Congress has increased NPS appropriations to address DM, in conjunction with the agency's 2016 centennial anniversary.13 NPS has stated that these funding increases, although helping the agency with some of its most urgent needs, have been insufficient to address the total problem.14 Some observers have advocated further increases in agency funding as a way to address DM, whereas others have recommended reorienting existing funding to prioritize maintenance over other purposes. The Administration's budget request for FY2018 would reduce some NPS funding for DM while increasing other NPS DM-oriented funding.15
Another subject of attention is the extent to which acquisition of new properties may add to the maintenance burden. Stakeholders disagree about the role played by new assets acquired by NPS, through the creation of new parks or the expansion of existing parks, in DM growth over the past decade. To the extent that newly acquired lands contain assets with maintenance and repair needs that are not met, these additional assets would increase NPS DM. According to the agency, new additions with infrastructure in need of maintenance and repair have been relatively rare in recent years, and most of the acquired lands have been unimproved or have contained assets in good condition.16 In past years, NPS also has stated that some acquisitions of "inholdings" within existing parks have even facilitated maintenance and repair efforts by providing needed access for maintenance activities.17 Others have contended that even if new acquisitions do not immediately contribute to the backlog, they likely will do so over time, and that further expansion of the National Park System is inadvisable until the maintenance needs of existing properties have been addressed.18 For example, the Administration's FY2018 budget proposes to eliminate funding for NPS federal land acquisition projects in order to "focus fiscal resources toward managing lands already owned by the federal government."19
Some observers also have expressed concerns that growth in NPS DM may be at least partially due to inefficiencies in the agency's asset management strategies and/or the implementation of these strategies. The section of this report on "Management Questions" gives further details on NPS's management of its DM backlog. NPS has taken a number of steps over the decade to improve its asset management systems and strategies. The Government Accountability Office (GAO) has recommended further improvements.20
From year to year, the completion of individual projects, changes in construction and repair costs, and similar factors play a role in the growth or reduction of NPS DM. For instance, with respect to the reduction in NPS DM for FY2016, the agency stated:
The database used to track DM and other facility asset information changes daily as data is entered, updated, closed out, and corrected in the system. The "snapshot" of the data taken at the end of Fiscal Year (FY) 2016 is exactly that … a view of the NPS data as of Sep 30, 2016. Many factors contributed to this almost $600 million decrease, including data cleanup, completion of several large projects, revisions to several large project work orders, and savings from decreases in construction costs.21
Still another issue is that the methods used by NPS and the Department of the Interior (DOI) to estimate DM have varied over time and for different types of maintenance reports. For example, the estimates in Figure 1 and Table 2, above, draw on two different types of DM reports. For FY2006-FY2013, the estimates are calculated from DM ranges that NPS provided to DOI for annual departmental financial reports. Starting in FY2014, NPS began to publish separate estimates of agency DM on its website, which include some assets—such as buildings that NPS maintains but does not own—that are not included in the DOI departmental estimates.22 Additionally, during the earlier FY2006-FY2013 period, DOI changed its methods for calculating its estimated DM ranges,23 and NPS was in the process of completing its database of reported assets.24 What portion of the overall change in NPS DM over the decade may be attributable to changes in methodology or data completeness, rather than to other factors, is unclear.
How Does NPS's Backlog Compare with Those of Other Land Management Agencies?
Although all four major federal land management agencies—NPS, the Bureau of Land Management (BLM), the Fish and Wildlife Service (FWS), and the Forest Service (FS)—have DM backlogs, NPS's backlog is the largest. For FY2016, NPS reported DM of more than $11 billion, whereas FS reported DM of roughly half that amount (about $5.5 billion), and FWS and BLM both reported DM of less than $2 billion. DM for the four agencies is discussed further in CRS Report R43997, Deferred Maintenance of Federal Land Management Agencies: FY2007-FY2016 Estimates and Issues.
Which States Have the Largest NPS Maintenance Backlog?
NPS reports DM by state and territory in its report titled NPS Deferred Maintenance by State and Park.25 The 20 states with the highest NPS DM estimates are shown in Table 3.
|
State |
NPS Deferred Maintenance Estimate |
|
California |
1.702 |
|
Washington, DC |
1.198 |
|
New York |
1.013 |
|
Wyoming |
0.828 |
|
Virginia |
0.751 |
|
Arizona |
0.565 |
|
North Carolina |
0.431 |
|
Washington |
0.394 |
|
Mississippi |
0.311 |
|
Utah |
0.292 |
|
Pennsylvania |
0.289 |
|
Maryland |
0.273 |
|
Tennessee |
0.265 |
|
Florida |
0.254 |
|
Montana |
0.252 |
|
Massachusetts |
0.233 |
|
Colorado |
0.227 |
|
New Jersey |
0.213 |
|
Nevada |
0.210 |
|
Texas |
0.157 |
Source: NPS, NPS Deferred Maintenance by State and Park, September 30, 2016, at https://www.nps.gov/subjects/plandesignconstruct/loader.cfm?csModule=security/getfile&PageID=5547454.
The states with the highest DM are not necessarily those with the most park acreage. For example, Alaska contains almost two-thirds of the total acreage in the National Park System but accounts for less than 1% of the agency's DM backlog. Instead, the amount, type, and condition of infrastructure in a state's national park units are the primary determinants of DM for each state. For example, transportation assets are a major component of NPS DM, and states with NPS national parkways—the George Washington Memorial Parkway (mainly in Virginia and Washington, DC), the Natchez Trace Parkway (mainly in Mississippi and Tennessee), the Blue Ridge Parkway (North Carolina and Virginia), and the John D. Rockefeller Jr. Memorial Parkway (Wyoming)—are all among the 20 states with the highest DM.26
Which Park Units Have the Largest Maintenance Backlog?
Table 4 shows the 20 individual park units with the highest maintenance backlogs.
|
Park Unit |
State |
NPS Deferred Maintenance Estimate |
|
Gateway National Recreation Area |
NJ, NY |
0.812a |
|
National Mall and Memorial Parks |
DC |
0.712 |
|
Yellowstone National Park |
ID, MT, WY |
0.663b |
|
Yosemite National Park |
CA |
0.555 |
|
Blue Ridge Parkway |
NC, VA |
0.501 |
|
George Washington Memorial Parkway |
DC, MD, VA |
0.488 |
|
Natchez Trace Parkway |
AL, MS, TN |
0.363c |
|
Grand Canyon National Park |
AZ |
0.353 |
|
Golden Gate National Recreation Area |
CA |
0.299 |
|
National Capital Parks–East |
DC, MD |
0.240d |
|
Great Smoky Mountains National Park |
NC, TN |
0.211e |
|
Lake Mead National Recreation Area |
AZ, NV |
0.193f |
|
Grand Teton National Park |
WY |
0.191 |
|
Statue of Liberty National Monument |
NY |
0.161 |
|
Olympic National Park |
WA |
0.152 |
|
Mount Rainier National Park |
WA |
0.152 |
|
Glacier National Park |
MT |
0.148 |
|
Sequoia and Kings Canyon National Park |
CA |
0.145 |
|
Delaware Water Gap National Recreation Area |
NJ, PA |
0.145g |
|
Death Valley National Park |
CA, NV |
0.140h |
Source: NPS, NPS Deferred Maintenance by State and Park, September 30, 2016, at https://www.nps.gov/subjects/plandesignconstruct/loader.cfm?csModule=security/getfile&PageID=5547454.
a. DM for Gateway National Recreation Area consists of $115.9 million in New Jersey and $695.9 million in New York.
b. DM for Yellowstone National Park consists of $0.1 million in Idaho, $55.4 million in Montana, and $607.8 million in Wyoming.
c. DM for the Natchez Trace Parkway consists of $11.0 million in Alabama, $280.9 million in Mississippi, and $70.6 million in Tennessee.
d. DM for National Capital Parks–East consists of $109.4 million in Washington, DC, and $130.3 million in Maryland.
e. DM for Great Smoky Mountains National Park consists of $67.1 million in North Carolina and $144.1 million in Tennessee.
f. DM for Lake Mead National Recreation Area is attributed entirely to Nevada, although a portion of the unit is in Arizona.
g. DM for Delaware Water Gap National Recreation Area consists of $77.0 million in New Jersey and $67.7 million in Pennsylvania.
h. DM for Death Valley National Park is attributed entirely to California, although a portion of the unit is in Nevada.
Various factors may contribute to the relatively high DM estimates for these park units as compared to others. For example, many of them are older units whose infrastructure was largely built in the mid-20th century. Some sites, such as Gateway National Recreation Area and Golden Gate National Recreation Area, are located in or near urban areas and may contain more buildings, roads, and other built assets than more remotely located parks. Three of the 10 units with the highest estimated DM are national parkways, consistent with the high proportion of NPS's overall DM backlog that is related to road needs.
Funding Questions
How Much Has NPS Spent in Recent Years to Address the Maintenance Backlog?
It is not possible to determine the total amount of funding allocated each year to address NPS's DM backlog, because NPS does not aggregate these amounts in its budget reporting. Funding to address DM comes from a variety of NPS budget sources, and each of these budget sources also funds activities other than DM. NPS does not report how much of each funding stream was used for DM in any given year.
Although it is not possible to determine amounts allocated to NPS deferred maintenance, GAO estimated amounts allocated for all NPS maintenance (including DM, cyclic maintenance, and day-to-day maintenance activities) for FY2006-FY2015.27 GAO estimated that, over that decade, NPS's annual spending for all types of maintenance averaged $1.182 billion per year.28 GAO did not determine what portion of this funding went specifically to DM. NPS has testified that annual funding of roughly $700 million per year, targeted specifically to DM, would be required simply to hold the maintenance backlog steady without further growth.29
What Are the Funding Sources for NPS to Address the Maintenance Backlog?
NPS has used discretionary appropriations, allocations from the Department of Transportation, park entrance fees, donations, and other funding sources to address the maintenance backlog. Most of the funding for DM comes from discretionary appropriations, primarily under two budget activities, titled "Repair and Rehabilitation" and "Line-Item Construction."
- The Repair and Rehabilitation (R&R) budget subactivity, within the NPS's Operation of the National Park System (ONPS) budget account,30 focuses on large-scale, nonrecurring repair needs, and repairs for assets where scheduled maintenance is no longer sufficient to improve the condition of the facility.31 R&R funds are used for projects with projected costs of less than $1 million each. NPS estimated that, over the past five years, a range from 49% to 83% of R&R funds have been specifically targeted to projects on the DM backlog, as opposed to projects associated with other types of maintenance.32 The Administration's FY2018 budget would fund the R&R subactivity at $99.3 million, a decrease of $25.2 million from FY2017 appropriations provided in P.L. 115-31.
- The Line-Item Construction budget activity, within the NPS's Construction account, provides funding for the construction, major rehabilitation, and replacement of existing facilities needed to accomplish approved management objectives for each park.33 This funding is used for projects expected to cost $1 million or more. NPS prioritizes projects for funding on the basis of their contribution to parks' financial sustainability, health and safety, resource protection, and visitor services, as well as on the basis of a cost-benefit analysis. NPS estimated that, over the past five years, a range from 59% to 87% of Line-Item Construction funds have been used specifically to reduce the DM backlog.34 The Administration's FY2018 budget would fund the Line-Item Construction activity at $137.0 million, an increase of $5.0 million over FY2017 appropriations provided in P.L. 115-31.
- Portions of other NPS discretionary budget activities and accounts also are used for DM. These include various budget activities within the ONPS and Construction accounts, as well as NPS's Centennial Challenge account. The Centennial Challenge account provides federal funds to match outside donations for "signature" NPS parks and programs. The funding is used to enhance visitor services, reduce DM, and improve natural and cultural resource protection.35 The Administration's FY2018 budget justification requests $15.0 million for the Centennial Challenge program, a decrease of $5.0 million from the amount provided for FY2017 in P.L. 115-31.
Beyond NPS discretionary appropriations, a number of other, nondiscretionary agency revenue streams also are used partially or mainly to address DM.
- NPS receives an annual allocation from the Highway Trust Fund to address transportation needs, including transportation-related DM.36 Funds are provided to NPS (and other federal land management agencies) by the Federal Highway Administration, primarily under the Federal Lands Transportation Program.37 In recent years, these allocations have funded approximately two-thirds of NPS's transportation-related maintenance spending.38 For FY2018, NPS's allocation from the Federal Lands Transportation Program is $284.0 million, an increase of $8.0 million from the FY2017 allocation. Through related federal highway programs, NPS could potentially receive additional funding.39
- Park entrance and recreation fees collected under the Federal Lands Recreation Enhancement Act (16 U.S.C. §§6801-6814) may be used for DM, among other purposes. The fees, most of which are retained at the collecting parks,40 may be used for a variety of purposes benefiting visitors, including facility maintenance and repair, interpretation and visitor services, law enforcement, and others.41 NPS estimates entrance and recreation fee collections of $256.9 million for FY2017 and $259.5 million for FY2018.42
- NPS collects concessions franchise fees from park concessioners who provide services such as lodging and dining at park units. The fees, collected under the National Park Service Concessions Management Improvement Act of 1998 (54 U.S.C. §§101911 et seq.), are available for use without further appropriation and are mainly retained at the collecting parks.43 They may be used to reduce DM, among other purposes, with priority given to concessions-related DM.44 NPS estimates concessions franchise fee collections of $127.8 million for FY2017 and $131.3 million for FY2018.45
- The National Park Service Centennial Act (P.L. 114-289) established the NPS Centennial Challenge Fund. In addition to discretionary appropriations (discussed above), the fund is authorized to receive, as offsetting collections, certain amounts from the sales of entrance passes to seniors.46 NPS estimates that the senior pass sales will provide an additional $15.0 million for the account for FY2018 on top of discretionary appropriations. The funding may be used for a variety of projects but must prioritize DM, improvements to visitor services facilities, and trail maintenance.47 Federal funds must be matched by nonfederal donations on at least a 50:50 basis. The Centennial Act also established the NPS Second Century Endowment and directed that it receive, as offsetting collections, revenues from senior pass sales totaling $10 million annually.48 The endowment also is authorized to receive gifts, devises, and bequests from donors. The funds may be used for projects approved by the Secretary of the Interior that further the purposes of NPS, including projects on the maintenance backlog. More broadly, other types of donations to NPS may be used for projects that reduce DM, among a variety of other purposes.49 NPS estimated that, through all of these programs combined, the agency would receive donations of $75.0 million in FY2017 and $71.0 million in FY2018 (in addition to the revenues generated from the sales of the senior passes).50
- Under the Helium Stewardship Act of 2013 (P.L. 113-40), NPS will receive $20 million in FY2018 from proceeds from the sale of federal helium, to be used for DM projects requiring a minimum 50% match from a nonfederal funding source.51
- Other NPS mandatory appropriations also have been partially used for DM. These include monies collected under the Park Building Lease and Maintenance Fund, transportation fees collected under the Transportation Systems Fund, and rents and payroll deductions for the use and occupancy of government quarters, among others. NPS estimated varying amounts for these mandatory appropriations for FY2017 and FY2018.
Have Additional Types of Funding Been Proposed to Address the Backlog?
Some Members of Congress and other stakeholders have proposed sources of additional funding to address NPS's DM needs. Legislative proposals in the 115th Congress are discussed in the "Role of Congress" section, below. Among other sources, stakeholders have proposed to increase NPS DM funding with resources from the Land and Water Conservation Fund, offshore oil and gas revenues that currently go to the General Treasury, income tax overpayments and contributions, motorfuel taxes, and coin and postage stamp sales.52 By contrast, others have suggested that NPS DM could be reduced without additional funding—for example, by improving the agency's capital investment strategies, increasing the role of nonfederal partners in park management, or disposing of assets.53
Management Questions
How Does NPS Prioritize Its Deferred Maintenance Needs?
NPS uses computerized maintenance management systems to prioritize its DM projects.54 Agency staff at each park perform condition assessments that document the condition of park assets according to specified maintenance standards. The information is collected in a software system through which the agency assigns to each asset a facility condition index (FCI) rating—a ratio representing the cost of DM for the asset divided by the asset's replacement value. (A lower FCI rating indicates a better condition.) The agency also assigns an asset priority index (API) rating that assesses the importance of the asset in relation to the park mission. Projects are prioritized based on their FCI and API ratings, as well as on other criteria related to financial sustainability, resource protection, visitor use, and health and safety. The agency's scoring system aligns with criteria identified in its Capital Investment Strategy.
What Types of Challenges May Exist in Managing the Maintenance Backlog?
In addition to the funding challenges discussed earlier, NPS faces other issues in managing the maintenance backlog. In December 2016, GAO reported on NPS management of maintenance activities, and identified both successes and challenges.55 In terms of challenges, GAO reported that competing duties often make it difficult for park staff to perform facility condition assessments in a timely manner, that the remote location of some assets contributes to this difficulty, that the agency's focus on high-priority assets likely may lead to continued deterioration of lower-priority assets, and that NPS lacks a process for verifying that its Capital Investment Strategy is producing the intended outcomes.56 GAO also reported on successes in NPS asset management—for example, that the agency's assessment tools are consistent with federally prescribed standards and that it is working with partners and volunteers to address maintenance needs.57
An additional challenge, identified in NPS budget documents, relates to the disposal of unneeded assets to reduce the agency's maintenance burden. Part of NPS's asset management includes identifying assets that may be candidates for disposal. For example, some assets may have high FCI ratings, indicating expensive maintenance needs, along with low API ratings, indicating that they are not of high importance to the NPS mission. NPS may favor destroying or disposing of such assets, but the agency has stated that the cost of removing the assets often precludes the use of this option.58 GAO also identified that legal requirements—such as the requirement in the McKinney-Vento Homeless Assistance Act (P.L. 100-77, as amended) that federal buildings slated for disposal must be assessed for their potential to provide homeless assistance before being disposed of by other means—create additional obstacles for NPS disposal of unneeded properties.59
Role of Congress
How Has Congress Addressed NPS's Maintenance Backlog?
Congress has addressed NPS's maintenance backlog through oversight, funding, and legislation. For example, in the 115th Congress, both the House and the Senate have held oversight hearings to investigate options for addressing NPS DM.60 Annual appropriations for NPS are discussed in CRS Report R42757, National Park Service: FY2017 Appropriations and Ten-Year Trends. Several recent laws and proposals outside of annual appropriations, including the National Parks Centennial Act of 2016 and bills introduced in the 115th Congress, are discussed under the following questions.
How Did the National Parks Centennial Act of 2016 Address Deferred Maintenance?
The National Parks Centennial Act (P.L. 114-289), enacted in December 2016, contained a variety of provisions aimed at addressing the NPS maintenance backlog as well as meeting other park goals. The law created two funds that may be used to reduce DM—the National Park Centennial Challenge Fund and the Second Century Endowment for the National Park Service.61 Both funds receive federal monies from the sale of senior recreation passes, as well as donations. DM projects are a prioritized use of the Centennial Challenge Fund and are among the potential uses of endowment funds.62 The law also made changes to extend eligibility for the Public Land Corps and increase the authorization of appropriations for the Volunteers in the Parks program.63 Participants in these programs perform a variety of duties that help address DM, among other activities.64 In addition, the law authorized appropriations of $5.0 million annually for FY2017-FY2023 for the National Park Foundation to match nonfederal contributions. Contributions to the foundation are used for a variety of NPS projects and programs, including projects on the maintenance backlog.
What Legislation Has Been Proposed in the 115th Congress to Address NPS Deferred Maintenance?
Bills in the 115th Congress related to NPS deferred maintenance include the following.
- H.R. 1577, the National Park Service Transparency and Accountability Act, would require the Secretary of the Interior to submit to Congress a report evaluating the NPS's Capital Investment Strategy and its results, including a determination of whether the strategy is achieving its intended outcomes and any recommendations for changes.
- H.R. 2584/S. 751, the National Park Service Legacy Act of 2017, would establish a National Park Service Legacy Restoration Fund with funding from mineral revenues. Annual amounts deposited into the fund would begin at $50.0 million for FY2018-FY2020 and would rise gradually to $500.0 million for FY2027-FY2047. The funds would be available to NPS for expenditure without further appropriation.65 They would be used for "high-priority deferred maintenance needs of the Service," with 20% of the funding going to transportation-related maintenance and the remaining 80% going to repair and rehabilitation of non-transportation-related assets. Projects with a nonfederal cost share would receive special treatment in priority rankings. The funding could not be used for land acquisition, and it could not supplant discretionary funding for NPS facility operations and maintenance.
- H.R. 2863, the Land and National Park Deferred Maintenance (LAND) Act, would establish a National Park Service Maintenance and Revitalization Conservation Fund.66 The fund would receive $450.0 million each year from mineral revenues, of which $375.0 million would go to NPS, with $25.0 million going to each of three other agencies: FWS, BLM, and FS. The monies would be available for expenditure without further appropriation and would be used for "high priority deferred maintenance needs that support critical infrastructure and visitor services." Funds could not be used for land acquisition.
- S. 1460, Section 5101, would establish a National Park Service Maintenance and Revitalization Conservation Fund as part of a broader energy-modernization bill. Although the fund would have the same name as in H.R. 2863, the Senate version would provide for deposits to the fund of $150.0 million per year from offshore revenues collected under the Outer Continental Shelf Lands Act (43 U.S.C. 1338 et seq.). The funds would be available for expenditure only when appropriated by Congress. The monies would be used for "high-priority deferred maintenance needs of the Service that support critical infrastructure and visitor services" and could not be used for land acquisition.