Introduction
The Elementary and Secondary Education Act (ESEA) is the primary source of federal aid to K-12 education. The ESEA was last reauthorized by the Every Student Succeeds Act (ESSA; P.L. 114-95) in 2015.1 The Title I-A program has always been the largest grant program authorized under the ESEA and was funded at $15.5 billion for FY2017. Since its enactment in 1965, Title I-A has provided assistance to meet the special needs of educationally disadvantaged children. Title I-A grants provide supplementary educational and related services to low-achieving and other students attending elementary and secondary schools with relatively high concentrations of poverty. In recent years, Title I-A has also become a vehicle to which a number of requirements affecting broad aspects of public K-12 education for all students have been attached as conditions for receiving Title I-A grants.
The U.S. Department of Education (ED) determines Title I-A grants to local educational agencies (LEAs) based on four separate funding formulas: Basic Grants, Concentration Grants, Targeted Grants, and Education Finance Incentive Grants (EFIG). The Title I-A formulas have somewhat distinct allocation patterns, providing varying shares of allocated funds to different types of LEAs or states (e.g., LEAs with high poverty rates or states with comparatively equal levels of spending per pupil among their LEAs).2 The Basic Grant formula is the original Title I-A formula, and has received appropriations each year since FY1966. The Basic Grant formula is the primary vehicle for providing Title I-A funds: it is the formula under which the largest share of Title I-A funds are allocated (42% of FY2017 appropriations) and under which the largest proportion of LEAs participate. Over time, the Concentration Grant, Targeted Grant, and EFIG formulas have been added to Title I-A to provide additional funds to areas with high numbers or percentages of children from low-income families. As the share of Title I-A funds allocated under these three formulas has grown, Title I-A grants have become increasingly targeted on concentrations of poverty.
This report begins with an overview of key issues that have factored prominently in the evolution of the Title I-A formulas. This part of the report highlights underlying tensions related to the allocation of funds that have surfaced as the Title I-A formulas have evolved. The report then traces, in detail, the evolution of the Title I-A formulas in statute and identifies the reasons offered for changes to them, as expressed in committee reports, floor debates, and, to a limited extent, congressional hearings.3 Please note that the term "Title I-A" is used to refer to various incarnations of programs that are similar in purpose and scope to the program currently referred to as Title I-A of the ESEA.4
The report concludes with three appendices. Appendix A provides historical appropriations data for the Title I-A formulas dating back to FY1980. Appendix B provides a summary of major changes that have been made to the factors that comprise each of the four Title I-A formulas that are currently authorized from their initial enactment through the ESSA. Appendix C provides a list of selected acronyms used in this report.
Key Issues Related to the Title I-A Formulas
Since the program's inception, Title I-A funds were intended to serve poor children in both public and private schools. Congress initially accomplished this by allocating Title I-A funds through one formula—Basic Grants. Over time, Congress added three additional formulas that essentially provide supplemental funding to LEAs that serve concentrations of students from low-income families. That is, Congress has tried to target funds to areas with higher concentrations of poverty, first through the Concentration Grant formula, which provided supplemental funds to areas with a high number or percentage of children from low-income families; and later through the Targeted Grant and EFIG formulas, which provide more funding per formula child (i.e., children included in the grant determination process) to LEAs with higher numbers or percentages of children from low-income families.
Since FY1966, every formula under the program has included some type of population factor and expenditure factor. Over the years, the children included in the determination of the population factor (referred to as formula children) have changed. The expenditure factors have changed as well. Changes in both areas have substantial implications for state and LEA grant amounts. In addition, while continuing to focus on the targeting of Title I-A dollars on areas with the greatest concentrations of poverty, Congress has periodically taken steps to help provide smaller states with additional funding to run Title I-A programs through state minimum grant provisions. Congress has also modified the Title I-A allocation formulas over time to include hold harmless provisions to prevent LEAs from receiving less than a certain amount of funding from year-to-year, provided appropriations are sufficient to make hold harmless payments. The inclusion of state minimum grant and hold harmless provisions does not necessarily further the overarching goal of targeting Title I-A funds on areas with concentrations of poverty, but it does allow Congress to address other issues that are considered important to many locales.
This section of the report provides a synthesis of themes identified through a CRS review of historical materials. A more in-depth depiction of the materials reviewed and of the formula-related amendments to the ESEA is provided in the following section, "Historical Overview of the Title I-A Formulas."
Measuring Poverty and Identifying Formula Children
Throughout the history of the Title I-A program, its focus has remained on providing funds to areas with concentrations of poverty. Thus, Congress has needed to identify which children should be considered children living in poor or low-income families. This has required determining a definition of poverty, identifying a data source to use to measure poverty, and deciding which "other" categories of children, if any, should be included in the determination of Title I-A grants. These choices all have implications for state and LEA grant amounts.
During initial consideration of the ESEA, there was debate about whether to rely solely on the 1960 Decennial Census data or also include children in certain families receiving Aid to Families with Dependent Children (AFDC) in grant determinations.5 Ultimately, Congress decided to include both children identified as low-income via the Census data and children in families receiving AFDC in the determination of grant amounts.6 One year later, Congress expanded the formula child eligibility criteria to include neglected, delinquent, and foster children and increased the threshold at which a child would be considered living in a poor family.7 While these changes increased the number of formula children, they also raised concerns about the potential increase in the cost of the program. Over the next several decades, debates over the structure of the formula child count continued as Congress changed the poverty threshold,8 changed when new poverty thresholds could be applied, altered when new Decennial Census data could be applied, and used data in addition to the Census data in determining counts.
While the data issues and debate over measures of poverty have diminished over time, particularly with the use of LEA-level estimates of poverty from the Census Bureau's Small Area Income and Poverty Estimates (SAIPE) data in 1999, issues related to which areas may be favored by a particular formula child definition have not. More specifically, there has been an ongoing debate about whether the Title I-A formulas are more favorable to more or less densely populated areas. For example, changes made to the count of AFDC children used in the determination of the number of formula children in the 1970s was a direct response to this debate when the counts were initially viewed as favoring urban areas (resulting in two-thirds of the actual number of AFDC children being counted) and then subsequently viewed as being unfavorable to urban areas (resulting in a full count of AFDC children).9
In addition to the debate about which data to use to construct poverty measures, a debate over the relative emphasis that should be placed on the percentage versus the count of formula children in an LEA has persisted and continues under the current formulas. Under current law, two formula child weighting scales are used in the determination of grants under the Targeted Grant and EFIG formulas: one based on formula child rates (determined by dividing an LEA's number of formula children by the number of children ages 5-17 residing in the LEA), the other based on formula child counts. Higher weights are applied to the LEAs with the highest formula child rates than are applied to the LEAs with the highest formula child counts. As intended, these weighting schemes result in LEAs that have a high formula child count, a high formula child rate, or both receiving more funding per formula child. Based on the statutorily specified weights used in determining weighted child counts, the weighting process would appear to favor LEAs with higher formula child rates (often rural LEAs) over LEAs with higher numbers of formula children (typically urban LEAs). However, due in part to the way the weights are applied, LEAs with high numbers of formula children often receive more funding per formula child than LEAs with a high formula child rate.10
State Expenditures on Public Education: High Spending States Versus Low Spending States
Every Title I-A formula includes a factor that accounts for how much money states spend on public K-12 education. This expenditure factor has consistently been based on state average per pupil expenditures (APPE) or national APPE since the initial enactment of the ESEA.11 When initially debated, proponents of the inclusion of an expenditure factor argued that the factor was needed to compensate states where the cost of educating a child was higher.12 The expenditure factor was also intended to compensate states with a higher cost of living.13 Opponents argued that the inclusion of an expenditure factor disproportionately benefitted wealthy states and counties.14 In part, the debate also focused on whether Title I-A funds should be spread broadly across the country or concentrated in the areas of greatest need.15 It was also a debate that pitted the higher spending states that argued their costs of education and living were higher than those in other states against lower spending states that argued they could not afford to spend more on education and, therefore, needed more Title I-A funding.16
In the mid-1970s, Congress put bounds on the expenditure factor that increased the expenditure factor used in grant determinations for low-spending states and reduced the expenditure factor used in grant determinations for high-spending states.17 This change effectively provided a benefit to lower spending states, as it raised their expenditure factor for purposes of grant determinations, and penalized higher spending states, as their expenditure factor could not exceed the upper bound.18 It did not, however, end the debate regarding if and how to account for spending on public K-12 education in Title I-A formulas.
In 1994, Congress created two additional Title I-A formulas (Targeted Grant and EFIG formulas) that were intended to target Title I-A funds more effectively on LEAs with concentrations of poverty. When the EFIG formula was initially enacted, it did not include that same expenditure factor that was included in the other three formulas. Rather, the EFIG formula included an effort factor and an equity factor. The effort factor is based on a state's education spending relative to personal income, essentially considering the share of available resources a state is dedicating to public K-12 education. The equity factor is based on variation in education spending among LEAs within a state. The more equitable spending is among LEAs in a given state, the higher a state's grant will be.19 These factors were included in the formulas due to concerns about disparities in funds and resources among LEAs in many states and to provide an incentive for states to reduce those disparities.20
The new EFIG formula was enacted in tandem with the new Targeted Grant formula, which included the same expenditure factor that was being used in the determination of Basic Grants and Concentration Grants. However, concerns were raised that the new formulas disadvantaged the southern states (traditionally lower spending states).21 In addition, prior to funding the Targeted Grant and EFIG formulas in FY2002, the EFIG formula was changed to include an expenditure factor similar to that of the other three formulas. Thus, the EFIG formula incorporates state spending on public K-12 education in three ways (expenditure, equity, and effort factors), while the other three formulas account for it only through an expenditure factor.
More recently, during consideration of ESSA in the Senate, a fifth formula was proposed that would have been similar to the EFIG formula in several ways but would have changed the expenditure factor from being based on state APPE to national APPE, essentially eliminating the expenditure factor.22 Similar to the addition of bounds on the expenditure factor, this change would have assisted states that spend less on public K-12 education as lower spending states would have had their expenditure factor raised to the national APPE, while higher spending states would have had their expenditure factor lowered to the national APPE. The fifth formula ultimately was not included in the bill, but it demonstrated that accounting for state spending on public K-12 education in the Title I-A formulas continues to be a congressional concern.
State Minimum Grants and LEA Hold Harmless Provisions
Under current law, all of the formulas include both state minimum grant provisions and LEA hold harmless provisions that have been added over time. State minimum grant provisions serve to increase the amount of funding that is provided to small states to operate Title I-A programs. State minimum grant provisions are funded by reducing the amount of funding provided to all the other states in order to support the smaller states. LEA hold harmless provisions prevent LEAs from losing more than a certain percentage of funding from year-to-year, which provides some stability in grant amounts. As with the state minimum grant provision, LEAs that receive grants in excess of their hold harmless amount have their grant amounts reduced to provide other LEAs with a hold harmless grant amount. These provisions have also been included in formulas to mitigate losses to states and LEAs that may result from changes in the Title I-A formula factors. For example, the first hold harmless provision was added to Basic Grants by the 1974 amendments23 to help offset any losses that could result from changes made to the expenditure factor. Subsequently, when Concentration Grants were added to Title I-A in the 1978 amendments,24 the Senate Committee on Human Resources added a requirement that no state receive less than 0.25% of the amount appropriated for Concentration Grants to protect the amount of funding received by rural districts.
By shifting the distribution of funds under the formulas, especially under the Concentration Grant, Targeted Grant, and EFIG formulas, the inclusion of state minimum grant and LEA hold harmless provisions may reduce the targeting of funds on LEAs with higher concentrations of poverty by reducing grant amounts to LEAs that would have otherwise received more funding. That is, state minimum grant provisions and LEA hold harmless provisions disrupt the formula provisions that were enacted to target funds on LEAs with higher concentrations of poverty. At the same time, however, these provisions may serve other purposes valued by Congress, including providing small states with a larger grant than they would have otherwise received to run their Title I-A programs and providing LEAs with stability from year to year. In addition, both types of provisions have been used to gain support for changes to the Title I-A formulas by helping to mitigate any losses that may result from the changes.
Targeting Title I-A Funds on Concentrations of Poverty
Since its initial enactment, the Title I-A program has been intended to serve poor children in both public and private schools. As previously discussed, there were issues related to how to count poor and other disadvantaged children and how to factor in state spending on public K-12 education when determining grant amounts. Another issue that has consistently attracted substantial attention is how to target Title I-A funds more effectively on LEAs with concentrations of poverty (either in terms of having a high number or a high percentage of formula children). While there are clearly some concerns about whether having a high number or high percentage of formula children should result in larger LEA grants per formula child, as evidenced by the current urban versus rural LEA debate discussed above, there has also been a more global debate about how best to target Title I-A funds on areas with concentrations of poverty. This debate has played out over several decades through the addition of three formulas to the original Basic Grant formula.
The Education Amendments of 1978 (P.L. 95-561) added the Grants to LEAs in Counties with Especially High Concentrations of Children from Low Income Families. These grants are more commonly known as Concentration Grants and were modeled on an earlier Title I-A grant program that essentially had the same purpose.25 As the title indicates, this formula was added to Title I-A to provide additional funding to areas with high concentrations of children from low-income families. In adding the formula to Title I-A, proponents argued that areas with concentrations of poverty needed "more intensive remedial effort than the average school district."26
Two additional formulas were added to the ESEA in 1994. The House Committee on Education and Labor added the Targeted Grants formula to target Title I-A funds more effectively on areas with concentrations of poverty, but it retained the Basic Grant and Concentration Grant formulas to continue to provide funding to "other less poor but still needy communities." 27 The Senate Committee on Labor and Human Resources took a different approach, arguing that the Basic Grant and Concentration Grant formulas should be replaced by a new formula (EFIG) that would better target funding on concentrations of poverty. Ultimately, both the Targeted Grant and EFIG formulas were added to the ESEA and the Basic Grant and Concentration Grant formulas were retained.
Historical Overview of the Title I-A Formulas
Title I-A was enacted in 1965 as part of the "War on Poverty." The program was intended to address a national problem that was reflected in men being rejected by the military draft, employment and manpower retraining problems, low levels of education for many adults, high unemployment rates for 18 to 24 year olds, and concerns expressed by institutions of higher education and vocational and technical educators regarding the quality of elementary and secondary education.28 According to House Report 89-143, which accompanied H.R. 2362 (the bill that ultimately became the Elementary and Secondary Education Act of 1965), "[t]he heart of the problem lies in our elementary and secondary school systems where there are concentrations of America's children of poverty."29 Title I (now referred to as Title I-A) was viewed as another tool to eradicate "poverty and its effects."30 The committee report stated the following:
The major thrust of this legislation is contained in title I where it is proposed that approximately $1.06 billion be provided to local school districts for the purpose of broadening and strengthening public school programs in the schools where there are concentrations of educationally disadvantaged children.31
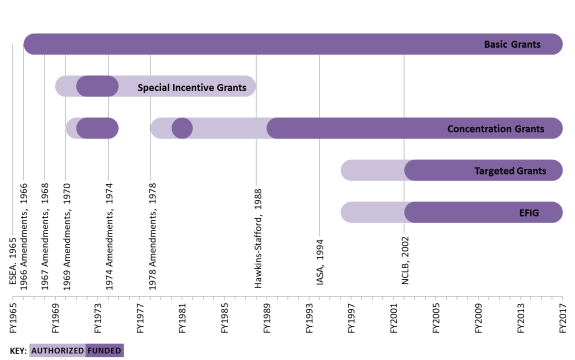
As initially enacted, Title I-A funds were allocated to LEAs via the Basic Grant formula, which was based on (1) the number of children from low-income families (commonly referred to as formula children) and (2) each state's APPE for public K-12 education. The Concentration Grant formula was added in the 1970s in an attempt to provide additional funding for LEAs with concentrations of poverty. During the consideration of ESEA reauthorization in the early 1990s, the House and the Senate proposed formulas (Targeted Grants and EFIG, respectively) intended to target concentrations of poverty more effectively by providing more funding per child to LEAs with higher numbers or percentages of formula children. As both of these formulas were enacted into law, and the Basic Grant and Concentration Grant formulas were retained, funds are allocated through four formulas under current law. Title I-A has also periodically included a Special Incentive Grant formula, intended to incentivize state and local education spending on elementary and secondary education. This formula was last funded in FY1975.32
Figure 1 shows the years in which each of the formulas was authorized and funded. Additionally, Figure 1 indicates the ESEA reauthorizations that made substantial changes to the Title I-A formulas. In some instances, formulas have been funded every year they have been authorized to receive appropriations, and in years in which the authorization of appropriations has expired (e.g., Basic Grants).33 In other instances, formulas were not funded until a subsequent reauthorization of the ESEA made substantial changes to the originally enacted formulas (e.g., EFIG).
|
Figure 1. Title I-A Formulas: Years in Which Appropriations Were Authorized and Appropriations Were Provided, FY1965 to FY2017 |
 |
|
Source: Figure prepared by Congressional Research Service (CRS) based on CRS analysis of the Elementary and Secondary Education Act (ESEA) and appropriations laws. Notes: The figure indicates reauthorizations of the ESEA that made substantial changes to the Title I-A formulas. The ESEA originally authorized Special Incentive Grants for FY1967; however, this authorization was repealed in the 1966 amendments and is thus not included in the figure. Additionally, from FY1970 through FY1975, the ESEA included a Special Grant program similar in purpose and scope to the Concentration Grant program. Thus, for the purposes of this figure, Special Grants are considered to be the same program as Concentration Grants. While the Every Student Succeeds Act (ESSA; P.L. 114-95) most recently comprehensively amended the ESEA in 2015, it did not make substantial changes to the Title I-A formulas. The figure reads, for example, Targeted Grants and Education Finance Incentive Grants (EFIG) were initially authorized in FY1996; however, no funds were appropriated for these formulas until FY2002, after the No Child Left Behind Act of 2001 (NCLB) made changes to the formulas. |
As with the original Basic Grant formula, grant amounts under each formula in current law are generally determined by multiplying a "formula child count," consisting primarily of estimated numbers of school-age children in poor families, by an "expenditure factor" based on state APPE.34 After initial grant awards are calculated, grant amounts are reduced to equal the level of available appropriations for each formula, taking into account a variety of state and LEA minimum grant and hold harmless provisions.35 Initial grant amounts have had to be reduced every year except FY1966 to equal the level of available appropriations. LEAs must also have a minimum number and/or percentage of formula children to be eligible to receive a grant under a specific formula. Grants have always been allocated by ED36 to LEAs via state educational agencies (SEAs).37 However, prior to FY1999 sufficient data were not available for ED to calculate grants at the LEA level, so ED calculated grants at the county level and SEAs suballocated county totals to LEAs.38 LEAs receiving grants subsequently distribute funds to schools, often based on the percentage of children in each school eligible for free or reduced-price lunch.39
This section of the report describes the Title I-A formulas as initially enacted by the ESEA and changes made to the formulas by major ESEA reauthorization bills.40 Additionally, a short description of the debates surrounding the formulas is included for reauthorizations that made substantial changes to the formulas. For a timeline of changes to the formula factors and the factors used in the current Title I-A formula see Appendix B.
Initial Enactment of the ESEA (P.L. 89-10, 1965)
In 1965, Congress passed and President Johnson signed the ESEA, which authorized the first federal general aid to elementary and secondary education. Prior to the enactment of the ESEA, there were two main federal programs for elementary and secondary education: (1) funding under Aid to Federally Impacted Areas (hereinafter referred to as Impact Aid) to offset the impacts that military bases and tax-exempt federal property had on LEAs,41 and (2) funding under the National Defense Education Act of 1958 (NDEA),42 which was intended to strengthen math and science education after the launch of the Soviet satellite Sputnik.43 After World War II, Congress introduced a number of bills to provide general federal aid to schools, but they were all defeated over concerns about aid to private schools, aid to segregated schools, or federal control over K-12 education.44
The first major step toward the passage of the ESEA came in 1964, when the Civil Rights Act banned federal funding to segregated programs. With respect to elementary and secondary education, this meant that federal funds could not be provided to segregated schools.45 Thus, the issue of aid to segregated schools was no longer an obstacle to the passage of a federal education bill providing general aid. Soon thereafter, the Johnson Administration came up with a compromise on the private school issue whereby aid would be targeted to children in poor families, regardless of the type of school they attended.46 The aid would be provided to the public schools, but also be available to benefit both public and private school students. Due to the resolution of the segregation and private school issues, the ESEA passed through Congress relatively quickly. In addition, the ESEA had the advantage of spreading funds to every state and a majority of congressional districts, thereby undercutting much of the opposition to the bill.47
Initial Title I-A Formulas48
The central component of the ESEA—the Title I-A program—was intended to meet the "special educational needs of children from low-income families" and to address "the impact that concentrations of low-income families have on the ability of local educational agencies to support adequate educational programs." Title I-A funds were to be allocated to LEAs via the Basic Grant formula for FY1966 and the Basic Grant and Special Incentive Grant formulas for FY1967 and FY1968. However, the Special Incentive Grant formula was never funded.49
Title I-A grants could be used for projects designed to meet the special educational needs of educationally deprived students,50 including for the acquisition of equipment and, where necessary, the construction of school facilities. LEAs were required to develop procedures, including objective measures of educational achievement, for annually evaluating the effectiveness of the program. Recipient LEAs were also required to provide, from state and local sources, a level of funding for public elementary and secondary education for the preceding fiscal year that was at least as much as the level of funding provided in FY1964. This type of requirement is commonly referred to as "maintenance of effort" (MOE).51
In addition, LEAs were required to provide services on an equitable basis to students attending private schools (commonly referred to as equitable participation). Title I-A funding for and the provision of these services remained under public control; the funds were not provided directly to private schools.52
In practice, as LEA-level data were not available, Basic Grants were calculated by the Department of Health, Education, and Welfare (HEW) on a county basis.53 SEAs then received the aggregate funds for counties in the state and reallocated the county amounts to individual LEAs. SEAs could also reserve up to 1% of their Basic Grant allocation for administration, technical assistance, and evaluation before suballocating to LEAs.54 LEAs receiving grants subsequently distributed funds for Title I-A projects to schools in areas with high concentrations of children from low-income families.55 HEW regulations further stipulated which schools or "project areas" would be eligible for Title I-A funds.56
Basic Grants
The Basic Grant formula determined grants based on the number of children from low-income families (formula children) multiplied by an expenditure factor based on state APPE. To be eligible to receive a grant, LEAs were required to have at least 100 formula children or formula children had to account for more than 3% of the children ages 5-17 in the LEA (commonly referred to as the formula child rate), provided that there were at least 10 formula children. When data were unavailable at the LEA level (as was the case), grant amounts were calculated using the same formula on a county basis.57 Additionally, grants to Puerto Rico and the Outlying Areas (Guam, American Samoa, the Virgin Islands, and the Trust Territory of the Pacific Islands) were provided via a reservation of up to 2% of total Basic Grant appropriations.58
The ESEA authorized Basic Grants for three years but only specified the allocation formula for FY1966, the first year of the program. For that year, the expenditure factor was set to 50% of the state's APPE for public elementary and secondary education, while the formula child count consisted of children ages 5-17 in families with an annual income below $2,000 based on data from the 1960 Decennial Census plus children in families with income at or above $2,000 as a result of receiving Aid to Families with Dependent Children (AFDC).59,60 Thus, an LEA's Basic Grant was equal to 50% of its state APPE multiplied by the sum of the number of children in families earning below $2,000 and the number of children in families that would be earning below $2,000 if they were not receiving AFDC.61 For FY1967 and FY1968, the expenditure factor and poverty threshold were left unspecified for future congressional determination.
Special Incentive Grants
The ESEA authorized Special Incentive Grants for FY1967 and FY1968 for LEAs in which the APPE from nonfederal sources exceeded that for the previous year. However, the authorization for this program was repealed in 1966 (see "Elementary and Secondary Education Amendments of 1966 (P.L. 89-750, 1966)" below), before the formula was ever funded. Special Incentive Grants would have been based on an LEA's average daily attendance and APPE.
Legislative Debate
In 1964, President Johnson established a task force to propose broad ideas for the reform of American education, and in November of that year the task force delivered a report to the President on the nation's educational needs. Subsequently, in January 1965 President Johnson sent Congress a proposal for the ESEA, which was introduced in the House as H.R. 2362 and in the Senate as S. 370. The House Education and Labor Committee made two changes to the Administration's proposal with respect to the Title I-A formulas: (1) children in families with annual incomes at or above $2,000 as a result of receiving AFDC funds were added to formula child counts, which had previously only included children in families earning less than $2,000; and (2) discretion to change the expenditure factor and the poverty threshold for FY1967 and FY1968 was given to Congress as opposed to the Secretary. No other amendments were added to the Title I-A formulas (although some were offered)62 and H.R. 2362 passed the House and Senate relatively quickly.63
In support of the formula, the Administration justified the use of the $2,000 poverty threshold because it clearly identified "an unquestioned hard core of poverty," had the administrative advantage of being able to be determined using available Census data, and correlated with the $1 billion the Administration was willing to commit to the program.64 The Administration justified its use of family income (as opposed to property value per child or per capita income) in the formula because it met four criteria: (1) it identified a distinct poverty group and was broad in its coverage, (2) it applied uniformly among states and local units, (3) gathering and using the data was administratively feasible, and (4) it was convertible into numbers of disadvantaged children at the desirable geographic level of allocation.65 The expenditure factor was needed, it was argued, to compensate states where the cost of educating a child was higher.66 The expenditure factor also compensated states with a higher cost of living as "a $2,000 level of family income in rural Mississippi [was] not the same level of poverty as a $2,000 family income in New York City."67
On the other hand, critics of the formula argued that it disproportionally benefitted wealthy states and wealthy counties,68 and the reliance on "outdated" Census data would not reflect changes in local need.69 Additionally, the inclusion of AFDC data in the formula child counts was seen by some as creating inequity because children in families receiving other benefits, such as disability payments, were not being counted.70 The "patently foolish" formula, it was charged, reflected a "political decision" to spread the funds as broadly as possible, rather than concentrating them in the areas of greater need, to build a "powerful lobby" for the continuation and expansion of the program.71
Amendments to Public Laws 81-815 and 81-874 (P.L. 89-313, 1965)
On October 15, 1965, just a few months after the enactment of the ESEA, Congress passed H.R. 9022 to amend the Impact Aid program and the ESEA. The bill was subsequently signed into law by the President on November 1. The primary purpose of the law was to provide federal aid for construction and the temporary operation of public schools damaged by a major disaster.72 Among other changes, the law created a new program to provide grants to SEAs for the education of children with disabilities.73 With respect to the Title I-A formulas, the law made almost no changes. Of note was an increase in the reservation of funds for state administration of Title I.74
Elementary and Secondary Education Amendments of 1966 (P.L. 89-750, 1966)
On October 20, 1966, at President Johnson's request, Congress passed H.R. 13161 to reauthorize the ESEA and extend the Title I-A program for two years (through FY1968). Amid concerns that the program favored wealthier states over their poorer counterparts, the amendments modified the Basic Grant program formula child counts, expenditure factor, and eligibility requirements. These changes expanded the size of the program and increased the cost of providing all eligible LEAs with their maximum grant amounts. In addition, the authority for Special Incentive Grants, scheduled to go into effect in FY1967, was eliminated as Congress and the President felt that these grants would fail to help the neediest school districts with the largest numbers of disadvantaged children. By repealing this program, about $400 million became available for Basic Grants.75
Additionally, the 1966 amendments added two grant programs for SEAs to Title I-A: a program to provide grants to SEAs to support the education of children of migratory workers and a program to provide grants to SEA for the education of institutionalized neglected and delinquent children.76 Thus, under the 1966 amendments three SEA programs were authorized under Title I-A in addition to the grants for LEAs: (1) one for children with disabilities, (2) one for migrant children, and (3) one for neglected or delinquent children.
Summary of Changes to the Title I-A Formulas
Under the 1966 amendments, Title I-A funds were allocated via one formula: Basic Grants. The LEA eligibility threshold was lowered to 10 formula children (compared to 100 formula children or a formula child rate of more than 3% provided there were 10 formula children).77 The formula was modified to add neglected, delinquent, and foster children to the counts of formula children used to determine grants. The income level used to determine eligible children was set at $2,000 for FY1967 and $3,000 for FY1968. In addition, the expenditure factor was changed to 50% of the greater of state or national APPE beginning in FY1968. Thus, beginning in FY1968 an LEA's Basic Grant was equal to 50% of the greater of state or national APPE multiplied by the sum of (1) the number of children in families earning below $3,000, (2) the number of children in families that would be earning below $3,000 if they were not receiving AFDC, and (3) the number of children in institutions for neglected or delinquent children or in foster homes.78 However, many of these formula changes were delayed by the 1967 amendments, discussed below.79
The 1966 amendments made three other changes of note to the Title I-A program. The amendments added authority to provide grants to the Bureau of Indian Affairs (BIA)80 for disadvantaged Indian children from the reservation of funds from the total appropriation made available for grants to Puerto Rico, Guam, American Samoa, the Virgin Islands, and the Trust Territory of the Pacific Islands. A small change was also made to the calculation of the state reservation for administration.81 Last, the 1966 amendments added a minimum Title I-A program size: LEA programs must have expenditures of at least $2,500. To meet this requirement, an LEA could jointly operate a program with another LEA.82
Legislative Debate
In early 1966, President Johnson requested that the Basic Grant poverty threshold be increased from $2,000 to $3,000 and Special Incentive Grants be repealed.83 Identical bills based on the President's proposals were introduced in the House (H.R. 13160 and H.R. 13161) and the Senate (S. 3046). The option of using national APPE (as opposed to state APPE) to determine a state's expenditure factor was added to House and Senate bills by the House Education and Labor Committee and the Senate Labor and Public Welfare Committee, respectively. The House committee added children in institutions for neglected and delinquent children to formula child counts and the Senate committee added foster children to formula child counts. In conference, the two formula child count proposals were combined.
Debate around these amendments centered on the argument that wealthier LEAs benefitted disproportionately under the allocation formula.84 It was also argued that funds should be allocated to states in such a way that states could target LEAs with the greatest need, as the use of increasingly outdated Census and AFDC data in the formula did not allow for adjustments for changing circumstances.85 However, this issue was somewhat addressed by an update to the AFDC data used in the formula.86 Similarly, the addition of the option of using the national APPE to calculate the expenditure factor was intended to benefit the poorer states and would "go far toward curing the huge disparity in aid as between states."87 The main argument against these amendments, however, was cost.88 For example, raising the poverty threshold to $3,000 and adding neglected, delinquent, and foster children to the formula child counts would increase the formula children counts. Allowing states to use national APPE when determining their expenditure factors would increase expenditure factors. As a result of these increases, LEA maximum grants would increase; thus, assuming the program was to be fully funded, program costs would increase.
Elementary and Secondary Education Act Amendments of 1967 (P.L. 90-247, 1968)
In 1968, President Johnson signed H.R.7819 into law to give "every child in America a better chance to touch his outermost limits."89 The scope of the amendments included in H.R. 7819 exceeded the President's initial requests;90 however, the Administration supported most of the changes.91
The 1967 amendments extended the authorization of the Title I-A program through FY1970 and authorized the use of advanced appropriations for ESEA programs.92 The amendments also made changes to the Basic Grant formula and re-added and substantially modified the Special Incentive Grant formula. However, these changes had a limited effect on overall Title I-A grant amounts as the Special Incentive Grant formula was not funded until FY1971 and some changes to the Basic Grant formula never went into effect because appropriations thresholds specified in statute were not met.
Summary of Changes to the Title I-A Formulas
Under the amendments, Title I-A grants were allocated via two formulas: Basic Grants and Special Incentive Grants.93 The amendments increased the reservation of funds for state administration of Title I,94 established priorities for providing funding when appropriations were insufficient to fully fund Title I-A, and mandated a study on methods necessary to obtain data for LEA grant allocations that would be more recent than the 1960 Decennial Census data. The Basic Grant and Special Incentive Grant formulas are discussed in more detail below.
Basic Grants
Although there was substantial debate around the Basic Grant formula, the 1967 amendments made relatively few changes to it. Of note were changes to the poverty threshold. The use of $3,000 as the poverty threshold in identifying formula children was delayed, and it could not take effect until each LEA received its maximum grant amount based on the $2,000 threshold. (This level of funding is commonly referred to as full funding for the Title I-A program.) 95 Any remaining appropriation amounts could then be allocated using the $3,000 threshold. However, this full funding threshold was never met; thus, under the 1967 amendments, the $2,000 threshold was used to determine formula child counts.
Prior to the enactment of the 1967 amendments, the FY1968 Labor-HEW appropriations bill had added state minimum grant provisions to the formula, which specified that should Title I-A not be fully funded, no state could receive less than it received in FY1967.96 Similarly, the 1967 amendments included a state minimum provision specifying that until appropriations reached $1.5 billion, states could not receive less than they did in FY1967. Thus, in FY1968 no state received less than the amount it received in FY1967 for all of its LEAs. Around half of the states received more in FY1968 than in FY1967.97 The states that saw an increase were, for the most part, those in which state APPE was lower than national APPE.98 Thus, these states benefitted from the addition of national APPE to expenditure factor determinations, which began in FY1968 as specified in the 1966 amendments.
Additionally, the 1967 amendments specified that if appropriations were below the full funding levels for SEA programs in Title I,99 then these programs would be fully funded by reducing the appropriations level for the Basic Grant program.100
Special Incentive Grants
The ESEA authorized a new Special Incentive Grants program beginning in FY1969 for states wherein the state "effort index" (based on the ratio of nonfederal educational expenditures to personal income) exceeded the national average effort index. Unlike Basic Grants, Special Incentive Grants were formula grants to states and competitive grants to LEAs. Each eligible state was to receive a grant equal to $1 for every percentage point its effort index exceeded the national average, multiplied by its formula child count. However, no state could receive a Special Incentive Grant greater than 15% of the total amount available for grants to states. After receiving funds, SEAs were to distribute Special Incentive Grants to LEAs with the greatest need for additional Title I-A funds. However, this program was not funded until FY1971, after the ESEA had been reauthorized by the 1969 amendments (discussed below).
It should be noted that the ESEA had originally included a similar Special Incentive Grant program for LEAs, but that program was never implemented.101
Legislative Debate
During consideration of the 1967 amendments, the Title I-A formulas were debated in both the House and the Senate. When the House Education and Labor Committee reported H.R. 7819, it extended the Basic Grant program for three years (through FY1971), made minor changes to the AFDC data, and required a study of the data used to calculate grants.102 None of these changes were particularly controversial.103 Also relatively noncontroversial was the addition of the Special Incentive Grant program by the Senate Labor and Public Welfare Committee.104
Major controversy, however, attended congressional efforts to respond to problems in the distribution of Title I-A funds due to appropriations falling considerably short of the authorization level for the program. To address this issue, the House committee proposed delaying the scheduled increase of the poverty threshold and the option for LEAs to use the greater of state or national APPE to calculate their expenditure factor (both scheduled to take effect in FY1968) until appropriations were sufficient to fully fund the program.105 On the House floor, however, the delay of the national APPE option was dropped, benefitting a minority of states with relatively low spending on elementary and secondary education.106,107 And, it was the deletion of this provision that spurred the inclusion of the state minimum grant provision in the FY1968 Labor-HEW appropriations bill (discussed above). The Senate, on the other hand, changed the Title I-A formula to stipulate that should appropriations be insufficient to fully fund Title I-A, each LEA would receive what it did for the prior fiscal year and the remaining funds would be allocated using a poverty threshold of $3,000 and the greater of state or national APPE.108 Additionally, the Senate committee prioritized funding for the Title I state agency programs over Title I-A grants to LEAs and authorized the use of advanced appropriations for ESEA programs to address complaints from LEAs that the school year was usually well under way before they knew how much federal money they would receive.109 In conference, the Title I-A formula was rewritten to create a compromise between the House and Senate provisions.
In addition to the changes to the Title I-A formulas, the other major controversy related to Title I-A was a proposed amendment to convert multiple ESEA programs (including Title I-A) into a block grant program.110 This amendment did not pass.
Elementary and Secondary Education Act Amendments of 1969 (P.L. 91-230, 1970)
In 1970, President Nixon signed H.R. 514 into law. The 1969 amendments extended most ESEA programs through FY1973,111 modified the Title I-A Basic Grant program, extended the Special Incentive Grant program, and included a provision to provide Special Grants to Urban and Rural Schools, which provided additional funding to areas where there were high concentrations of disadvantaged children (similar to what is now known as Concentration Grants).112
Summary of Changes to the Title I-A Formulas
Under the 1969 amendments, Title I-A grants were allocated via three formulas: Basic Grants, Special Incentive Grants, and Special Grants. The amendments also required that all applications and other pertinent LEA documents be made available to the public. In addition, the Commissioner of Education (hereinafter referred to as the Commissioner) was required to study the effectiveness of the program in meeting the needs of the disadvantaged and report the findings to Congress. The amendments also mandated a study of the LEA grant allocation formula and established the National Advisory Council on the Education of Disadvantaged Children.
Two new fiscal requirements were also added to the statute: (1) a comparability requirement under which each LEA receiving Title I-A funds had to demonstrate comparable services were provided to both schools receiving Title I-A funds and schools not receiving Title I-A funds, and (2) a supplement, not supplant (SNS) requirement that required LEAs to provide an assurance that Basic Grant funds were not supplanting nonfederal funds in their districts.113
The Basic Grant, Special Incentive Grant, and Special Grant for Urban and Rural Schools formulas are discussed in more detail below.
Basic Grants
The 1969 amendments did not make substantial changes to the Basic Grant formula due, in part, to the funding level for the program. Since FY1967, Title I-A had not received sufficient appropriations to provide LEAs with their maximum grant amounts. As a result, Congress retained the Basic Grant FY1967 state grant minimum provisions and the provisions prioritizing funding for state agency programs over Basic Grants included in the 1967 amendments. Additionally, while the amendments increased the poverty threshold used to determine formula child counts, this change never went into effect due to insufficient appropriations.114
One change the 1969 amendments did make was to give the Commissioner the option to use data from the Census Bureau's 1970 Decennial Census (as opposed to the 1960 Decennial Census) to determine grant amounts beginning in FY1973. Additionally, under the amendments Basic Grants could be used for salary bonuses for teachers serving in schools with large numbers of disadvantaged students.
Special Incentive Grants
The 1969 amendments did not make major changes to the Special Incentive Grant program, which, in 1970 (when the 1969 amendments were enacted), had yet to be funded.115 Special Incentive Grants to SEAs were based on an effort index and the state formula child count.116 After receiving funds, SEAs were required to distribute Special Incentive Grants to LEAs with the greatest need for additional Title I-A funds on a competitive basis.
Special Grants
Beginning in FY1970, the 1969 amendments authorized new Special Grants for Urban and Rural Schools (commonly referred to as Special Grants) for school districts with high concentrations of poverty. To be eligible to receive a Special Grant, an LEA's formula child rate had to be at least 20% or the LEA had to have at least 5,000 formula children (if this constituted at least 5% of the total number of school-age children served by the LEA).117 The maximum grant for an LEA was equal to 30% of its maximum Basic Grant amount for FY1970 and 40% of its maximum Basic Grant amount for all subsequent years.118 If appropriations were insufficient to pay maximum grant amounts, these amounts were reduced.
Funds could only be used for programs and projects designed to meet the needs of educationally deprived children in preschool and in elementary schools serving areas with the highest concentrations of low-income families. Funds could be used in secondary schools serving areas with the highest concentration of low-income families if there was an urgent need for such projects and there was "satisfactory assurance" that the projects would be at least as effective as elementary school programs.
It should also be noted that appropriations for Special Grants were limited to no more than 15% of Title I appropriations in excess of $1.39 billion.119
Legislative Debate
The major debate over Title I-A centered on the length the program should be extended. The Administration proposed that Title I-A be extended through FY1972 to give it time to thoroughly review the program and to permit data from the 1970 Decennial Census to be considered in the subsequent reauthorization of the program.120 However, the House Education and Labor Committee reported an amended version of H.R. 514, which contained a five-year extension of the ESEA to give LEAs more stability for long-term planning.121 On the House floor, the bill was revised to limit the extension of programs to two years.122 The Senate Labor and Public Welfare Committee replaced this with a four-year extension. The other Senate committee amendments to Title I-A—raising the poverty threshold, a new Special Grant program, and limiting of the use of the 1970 Census data—were relatively non-controversial.123 In conference, the extension was modified to three years and the Senate's other Title I-A amendments were adopted.
It should be noted that on the House side, there was also continuing concern over the funding "inequities" created by the Basic Grant formula. The AFDC count was seen by some as being "worthless in comparing the needs of one State with those of another" because of the variation in AFDC programs at the state level; the 10 year old 1960 Census data were argued to be "woefully inadequate to measure the highly changeable economic and population status of individual counties and communities"; and the expenditure factor was said to favor the wealthier states, thus allowing "the rich [to] get richer."124 Conversely, it was argued that the formula was "the most effective means of distributing funds uniformly throughout the country where educational deprivation exists,"125 and the greatest need was not for revision of the formula but for full funding of the program.126 There were also concerns that making changes to the formula would reopen the debate over serving children attending private schools.127
Education Amendments of 1972 (P.L. 92-318, 1972)
No substantial changes were made to the Title I-A formulas by the 1972 amendments.
Education Amendments of 1974 (P.L. 93-380, 1974)
Congress passed the 1974 education amendments nearly a decade after the original passage of the ESEA. Under these amendments, Title I-A grants continued to be allocated via three formulas: Basic Grants, Special Incentive Grants, and Special Grants. However, the amendments made a number of changes to the Title I-A formulas, many of which reflected congressional concern that the formulas were more favorable to urban areas than rural areas.
Summary of Changes to the Title I-A Formulas
The 1974 amendments made several changes to the Basic Grant and Special Grant formulas and extended the Title I-A program through FY1978. A new provision was also added that required that federal funds be used only for the excess costs of activities to meet the special educational needs of educationally deprived children.128 Additionally, the amendments made changes to school eligibility for Title I-A129 and state reservations for the administration of Title I.130 The changes made to the Basic Grant, Special Incentive Grant, and Special Grant formulas are discussed in more detail below.
Basic Grants
Although Congress retained the structure of the Basic Grant formula as originally enacted, the 1974 amendments changed every factor in the formula. The formula child count used to determine Basic Grants was changed to be the sum of (1) counts of children ages 5-17 in families at or below the poverty thresholds that were applied by the Census Bureau in compiling the 1970 Census,131 (2) two-thirds of the children in families receiving AFDC payments above the poverty threshold (i.e., the total number of eligible AFDC children multiplied by two-thirds); and (3) neglected, delinquent, and foster children. The expenditure factor was changed to 40% of state APPE (as opposed to 50% of the greater of state or national APPE). However, a floor and ceiling were applied to the expenditure factor that raised the expenditure factors of relatively low-spending states and lowered the expenditure factors of relative high-spending states.132 Thus, for FY1975 through FY1978, an LEA was entitled to a Basic Grant equal to 40% of the state's APPE (subject to floor and ceiling constraints) multiplied by the new formula count detailed above.
In addition to changing the population and expenditure factors, the amendments included provisions to prevent LEAs from seeing large losses in their grant amounts from year to year. The amendments included a hold harmless provision that required each LEA to receive a grant equal to at least 85% of its grant from the previous year, assuming appropriations were sufficient. The amendments also authorized a separate appropriation of $15.7 million each year to be used at the discretion of the Commissioner to help LEAs whose Basic Grants in any year were less than 90% of their grant amount in the previous year.133
The 1974 amendments also stipulated that Puerto Rico was to be treated as a state under Basic Grants; funds were allocated to Puerto Rico via the Basic Grant formula as opposed to through a set aside.134 Consequently, the 2% reservation for Basic Grants to Puerto Rico, the Outlying Areas, and the BIA was changed to a 1% reservation for Basic Grants to the Outlying Areas and the BIA.
In addition, the amendments kept the full funding requirements for SEA Title I programs; if appropriations for all Title I programs should be less than total maximum grants, allocations for SEA programs in Title I could not be reduced below the full funding levels.
Special Incentive Grants
The 1974 amendments extended the Special Incentive Grant program, which benefited states whose educational effort exceeded the national average.135 However, the amendments provided, as before, that the program would only take effect when Title I appropriations exceeded $1.396 billion and further provided that total entitlements under the program could not exceed $50 million.
Special Grants136
Congress rewrote the formula for Special Grants, but provided that the program would end in FY1975. To be eligible to receive a grant, LEAs were required to be located in counties with at least 10,000 formula children (provided these children accounted for at least 5% of the school age population) or the number of formula children in the county had to be at least 200% of the average number of formula children in the state.137 Additionally, the maximum grant an LEA was entitled to receive was changed from a percentage of its Basic Grant amount to a formula child count multiplied by an expenditure factor. The formula child count consisted of children (1) in families with an annual income below $3,000; (2) in families with income at or above $3,000 as a result of receiving AFDC; and (3) in institutions for neglected or delinquent children or in foster homes. The expenditure factor was equal to 50% of the state APPE.
The authorization level for Special Grants was also changed from 15% of the Title I appropriation in excess of $1.396 billion to a separate authorization of $75 million for FY1975.
Legislative Debate
Congressional consideration of the 1974 amendments began in 1973 in the House. The House Committee on Education and Labor considered proposals to allocate $300 per formula child before allocating the remaining funds via the Basic Grant formula (H.R. 69),138 consolidate programs into an education-revenue sharing plan (H.R. 5823),139 and allocate funds based on the number of children in each state failing to meet standards in reading and math (H.R. 5163).140 After a year of debate, the committee reported a modified version of H.R. 69. The committee had called the Title I program an "immense success" but had criticized almost every aspect of the Basic Grant formula.141 The formula child counts were seen as being dominated by AFDC children and thus more favorable to wealthier states that provided larger AFDC benefits.142 As a result, the committee altered the formula to use updated poverty data, use a more updated definition of poverty (commonly referred to as "the Orshansky index"), and limit the count of AFDC children to two-thirds.143 Additionally, the expenditure factor was seen as causing "grave inequities," as there was no maximum on the state APPE that could be used.144 Thus, the committee adopted a new expenditure factor: 40% of state APPE, limited to a range of 80% to 120% of the national APPE. To help mitigate any losses that would result from these changes, the committee added an 85% hold harmless factor. 145
The House committee's changes to the formula were criticized because they would have a negative impact on urban areas.146 Several modifications to the Title I-A formulas were proposed on the House floor, particularly with respect to the limitation in the count of AFDC children, but all were defeated.147
The Senate Labor and Public Welfare Committee's version of the bill (S.1539) differed substantially from the House version, providing greater benefits to areas with high concentrations of AFDC children148 and revamping and extending both the Special Incentive Grant program and the Special Grant program, both of which the House version proposed to terminate.149 On the Senate floor, however, the Basic Grants formula was amended to conform to the House version.150 In conference, the Senate's revisions of the Special Grants program were accepted, but the program was extended for only one year.151 The Special Incentive Grant program, on the other hand, was extended for four years with only minor modifications.152
One-Year Extension of the ESEA (P.L. 95-112, 1977)
The authorization of appropriations for a number of ESEA programs was scheduled to expire on October 1, 1978. A one-year extension was requested by the Carter Administration so it could study the programs before another comprehensive reauthorization.153 Congress passed the extension in September 1977. No major changes were made to the ESEA.
Education Amendments of 1978 (P.L. 95-561, 1978)
In 1978, Congress passed H.R. 15 to "extend and amend expiring elementary and secondary education programs." Congressional consideration of the 1978 amendments was informed to some extent by a study on the Title I-A program conducted by the National Institute of Education (NIE) in 1977.154 The study found, among other things, that per-pupil Title I expenditures were higher in predominantly urban and suburban states and the inclusion of AFDC children in the formula provided the largest benefits to large northeastern cities.155
The 1978 amendments extended Basic Grants for five years and made changes to the allocation formulas generally benefitting urban areas. The amendments also added a new Concentration Grant program to provide supplemental funds to areas with especially high concentrations of poverty. In addition, the amendments converted the Special Incentive Grant program to a federal matching grant program for state compensatory education expenditures beginning in FY1980. The Special Grant program was not retained.156
Summary of Changes to the Title I-A Formulas
Under the 1978 amendments, Title I-A grants were allocated via three formulas: Basic Grants, Concentration Grants, and Special Incentive Grants. The amendments increased Title I state administration grants,157 reorganized and elaborated on existing Title I administrative provisions,158 and required a study of alternatives to LEA compliance with comparability requirements. With respect to Title I-A allocations to schools, the amendments permitted LEAs to allocate funds to schools with a high incidence of educational deprivation in addition to schools with concentrations of children from low-income families. The amendments also stipulated that if LEA grants were insufficient to provide funding to all eligible schools, the LEA was to rank its schools by concentration of children from low-income families and serve the schools in rank order. Additionally, schools could be automatically qualified to participate in Title I-A if their percentage of students from low-income families was at least 25%.159,160
The Basic Grant, Concentration Grant, and Special Incentive Grant formulas are discussed in more detail below.
Basic Grants
Beginning in FY1980, the amendments changed the Basic Grant formula child population in two respects. First, children in families receiving AFDC payments above the poverty level were counted in full (as opposed to two-thirds). Second, half of the funds available for Basic Grants in excess of the FY1979 appropriations level were allocated to states on the basis of counts of children in families with income below 50% of the median income for a four-person family, according to the 1976 Survey of Income and Education (SIE).161
In addition, schools receiving Basic Grant funds that had a poverty rate of 75% or higher were permitted to operate schoolwide programs allowing them to implement a project to upgrade their entire educational program in a school. The amendments also required that data needed for making Basic Grants be compiled from the 1980 Census162 and made a change to the treatment of Puerto Rico.163
Concentration Grants
The amendments also provided for Grants to LEAs in Counties with Especially High Concentrations of Children from Low Income Families (these grants are more commonly known as Concentration Grants). Concentration Grants were essentially a new version of the Special Grants program authorized under the 1969 and 1974 ESEA amendments. Concentration Grants were intended to provide additional funding to areas with high concentrations of children from low-income families. Eligibility for the program was based on the number or proportion of formula children relative to the total population ages 5-17 in the county in which the LEA was located.164 An LEA was eligible to receive a grant if the number of formula children in its county exceeded 5,000 or accounted for over 20% of the total school-age population.165
A county was entitled to receive a Concentration Grant equal to the number of children residing in the county in excess of the eligibility thresholds multiplied by its maximum Basic Grant per formula child. A county's maximum Basic Grant per formula child was equal to a county's maximum grant amount calculated under the Basic Grant formula divided by the total number of formula children in the county.166 Thus, a county's Concentration Grant amount was equal to its formula child count in excess of 5,000 or 20% of the total number of children in the county multiplied by its maximum Basic Grant amount and divided by its formula child count. If appropriations were insufficient to pay these amounts, they were reduced. Additionally, no state could receive less than 0.25% of the total amount available for state grants.
Once county Concentration Grants were made, these funds were allocated to LEAs within those counties by the SEA. All LEAs in each eligible county would receive a share of the county's Concentration Grant. County grants were allocated to LEAs in proportion to each LEA's number of formula children, with a higher weight given to formula children in LEAs with higher formula child rates.167
Special Incentive Grants
Beginning in FY1980, the amendments converted the Special Incentive Grant program to a federal matching program for state compensatory education expenditures. To be eligible to receive a Special Incentive Grant, an LEA had to be eligible for a Basic Grant and be in a state with a compensatory education program.168 An eligible LEA was entitled to $1 in federal funds for every $2 the state spent on programs for the disadvantaged. However, no state could receive a grant greater than 10% of its maximum Basic Grant. Additionally, it should be noted that unlike the other Title I-A formulas, Special Incentive Grants appropriations were authorized at "such sums as may be necessary."169
Legislative Debate
The Carter Administration initiated two of the proposals enacted in the 1978 amendments: the conversion of the Special Incentive Grant program to a federal matching program and the Concentration Grant program.170 Both the House Education and Labor Committee and the Senate Committee on Human Resources concurred on these initiatives. Funding under the previous Special Incentive Grants program was seen as "exceedingly unpredictable"171 and federal incentives to promote state compensatory education programs were considered "more consistent" with the goals of Title I.172 With respect to Concentration Grants, proponents argued that an area with a concentration of poverty needed "more intensive remedial effort than the average school district."173 To protect rural districts, the Senate committee initiated the proposal that no state receive a Concentration Grant that was less than 0.25% of the appropriations level. The House adopted the same provision in a floor amendment.174
The House and Senate committees agreed as well on extending Title I for five years and restoring AFDC children to a full count (as opposed to counting each eligible AFDC child as two-thirds of a child).175 Proponents of the AFDC change argued that it was needed to address "the inequities ... to major urban areas" that resulted from the 1974 amendments.176 Moreover, it was said a full count was needed to account for shifts in poverty that had occurred since the 1970 Census.177 On the other hand, critics of the change argued it would benefit only a handful of states.178
There was less agreement between the House and Senate committees, however, on using SIE data to allocate Title I funds. In the House, the SIE data were seen as "a more accurate State-level estimate of children in poverty than data from the 1970 Census."179 The Senate committee, on the other hand, rejected SIE as a base for Basic Grant allocations because the data were "of questionable statistical accuracy."180 Ultimately, the Senate agreed in conference to the new Basic Grant formula based on SIE data for half of the appropriations in excess of FY1979 appropriations levels.181
Education Consolidation and Improvement Act of 1981 (ECIA, Title V, P.L. 97-35, 1981)182
In 1981, President Reagan sought to convert existing elementary and secondary education programs into block grants.183 However, this proposal met with only limited success in Congress and the ECIA ultimately included only one education block grant, replacing a group of relatively small categorical education programs. In general, the ECIA either changed or consolidated the statutory provisions for every ESEA program. ESEA Title I became Chapter 1 of the ECIA (Financial Assistance to Meet Special Educational Needs of Disadvantaged Children), while the rest of the ESEA was consolidated into Chapter 2 of the ECIA (Consolidation of Federal Programs for Elementary and Secondary Education).184
Under Chapter 1, the Basic Grant, Concentration Grant, and Special Incentive Grant programs were retained.185 Although no major changes were made to the allocation formulas, the Title I-A program was modified in several ways.186 Among the changes was a simplification of the LEA application requirements; a change in the MOE requirement for LEAs, making it easier for LEAs to comply with the requirement;187 a change in SNS and comparability requirements to exclude certain costs when determining compliance;188 elimination of the excess cost requirements; elimination of the existing requirements or recommendations related to how projects should be implemented or administered;189 and removal of several provisions that explicitly authorized flexibility in how programs were implemented.190 The comparability requirements that were first included in the 1970s were also amended.191
Education Consolidation and Improvement Act Technical Amendments Act of 1983 (P.L. 98-211, 1983)
The 1983 amendments were designed to clarify language, resolve questions of legislative intent, and eliminate drafting errors in the ECIA.192 The amendments explicitly restored authority for certain forms of flexibility in program administration that had been included in ESEA Title I.193 For Chapter 1 programs, the amendments added and extended certain requirements. For example, the amendments extended SNS requirements to SEAs and other state agencies and required SEAs to evaluate programs receiving assistance at least once every two years.194 The National Institute for Education (NIE) was also required to conduct an assessment of compensatory education programs.
Education Amendments of 1984 (P.L. 98-511, 1984)
The 1984 amendments were primarily focused on the Bilingual Education Act and English language learners (ELLs). No substantial changes were made to the Basic Grant program or other Chapter 1 programs.
Augustus F. Hawkins-Robert T. Stafford Elementary and Secondary School Improvement Amendments of 1988 (P.L. 100-297)195
In 1988, Congress reauthorized the ESEA and generally extended programs through FY1991. The 1988 amendments repealed the ECIA, returned provisions that had previously been moved to the ECIA back to the ESEA, modified various ESEA programs, and added several new programs. The Title I-A program was reauthorized as Title I, Chapter I-A. The amendments updated the Basic Grant formula and made large changes to the Concentration Grant formula to be more favorable to rural areas.196 While both formulas were modified by the amendments, most of the debate and attention was focused on the Concentration Grant formula.
Summary of Changes to the Title I-A Formulas
Under the 1988 amendments, Title I-A funds (now authorized under Title I, Chapter 1-A) were allocated via modified versions of the Basic Grant and Concentration Grant formulas. The amendments also added requirements for SEA and LEA program improvement plans, expanded requirements for parental involvement, added a competitive grant program for the Outlying Areas and freely associated states,197 and expanded comparability provisions.198 Additionally, the amendments increased Chapter 1 state administration grants.199 The Basic Grant and Concentration Grant formulas are discussed in more detail below.
Basic Grants
The 1988 amendments made three changes to the Basic Grant allocation formula. First, references to the 1970 Census poverty thresholds were removed, allowing the 1980 Census poverty thresholds to be applied to the 1980 Census data and allowing the 1990 Census poverty thresholds and data to be used when those data became available.200 Second, the amendments removed the provisions requiring half of the funds above the FY1979 appropriations level to be allocated based on the 1976 SIE data. Finally, the amendments added minimum grant provisions to the Basic Grant formula: if appropriations exceeded $700 million and the Concentration Grant formula was not funded, no state would receive less than 0.25% of the total funding available for grants.201 Thus, under the 1988 amendments a county was entitled to a Basic Grant equal to its expenditure factor (based on state APPE) multiplied by its formula child count, subject to state minimum grant provisions. Should appropriations be insufficient to provide maximum grant amounts, grants were ratably reduced. SEAs continued to suballocate county grants to individual LEAs.
Concentration Grants
Under the 1988 amendments, Concentration Grants, which had not been funded since FY1981, were required to receive all Chapter 1-A appropriations between $3.9 billion and $4.3 billion, plus 10% of appropriations in excess of $4.3 billion.202 The amendments also substantially modified the Concentration Grant formula and eligibility criteria. The county eligibility thresholds were changed from 5,000 formula children or a formula child rate of 20% to 6,500 formula children and a formula child rate of 15%.203 When allocating grants, all formula children were counted if the county met the 15% threshold, but only those above 6,500 were counted if the county did not meet the 15% threshold. Additionally, the amendments modified the 0.25% state minimum grant amounts by adding a series of caps204 and added an "absolute" minimum grant amount of $250,000 that was not subject to any caps.205 Thus, under the 1988 amendments a county was entitled to a Concentration Grant equal to its formula child count (only counting formula children above the 6,500 formula child count threshold if the county's formula child rate was below 15%) multiplied by its maximum Basic Grant amount per formula child.
The 1988 amendments also made changes to the distribution of funds among LEAs within eligible counties. Funds were no longer distributed to every LEA in an eligible county. Rather, only the LEAs that met either the 6,500 or 15% thresholds were eligible to receive a share of the county's Concentration Grant. If no LEA in the county met those criteria, then the Concentration Grant would be shared by all LEAs in the county that had a number or percentage of formula children above the county average. In addition, states could reserve up to 2% of their Concentration Grants to distribute to LEAs with relatively high numbers or percentages of formula children located in counties that were not eligible for Concentration Grants.
Legislative Debate
During congressional consideration of the 1988 amendments, a great deal of attention was paid to the Concentration Grant formula. Under the House bill (H.R. 5), the eligibility thresholds were changed to 6,500 formula children or a 15% formula child rate (a change that generally favored rural districts).206 Additionally, to account for more heterogeneous counties, the House bill included provisions allowing states to reserve 2% of funds for LEAs with concentrations of poverty in counties not eligible for Concentration Grants.207 The Senate bill (S. 373) also made changes to the formula to "improve the targeting of Chapter 1 dollars to ... areas that have a particularly high number of educationally disadvantaged and low-income students."208 Under the Senate bill, half of the funds would be distributed based on a formula similar to the existing formula. The other half would be allocated to states under the Basic Grant formula and then to LEAs with high numbers or percentages of formula children within states (referred to as the Senate Concentration Grant formula). Both the House and Senate bills included a reservation of Chapter 1 funds for Concentration Grants (which had not been funded since FY1981) as opposed to a separate appropriation to help ensure the formula would be funded.209 In conference, the House conferees rejected the Senate Concentration Grant formula in favor of the House version primarily because the Senate version benefited large urban areas over rural areas (particularly rural areas in the South).210 Debate over the proposal was reportedly influenced by Representative Natcher, who chaired the appropriations subcommittee with jurisdiction over education and had promised to fund the House plan but not the Senate plan.211
With respect to the Basic Grant formula, the only major point of debate was the inclusion of AFDC children in formula child counts. The Senate bill would have removed AFDC children from the formula as "variances among State [AFDC] criteria raised questions of equity with regard to nationwide distribution of a portion of chapter 1 funds."212 However, AFDC children were returned to formula child counts during Senate floor consideration to prevent an abrupt change in formula child counts for states with high AFDC counts (e.g., California, Washington) and to give GAO time to study the use of AFDC data in the formula.213
Improving America's Schools Act (IASA, P.L. 103-382, 1994)
On October 20, 1994, President Clinton signed the IASA into law. The bill was a substantially modified version of the proposal offered by the Clinton Administration nearly a year earlier. The IASA made several changes to the existing Title I-A formulas: Basic Grants and Concentration Grants. The Title I-A program was also amended to include two new formulas—Targeted Grants (developed by the House) and Education Finance Incentive Grants (EFIG; developed by the Senate)—in an attempt to target Title I-A funds more effectively on concentrations of poverty. In addition, the IASA merged the SEA program for students with disabilities into the Individuals with Disabilities Education Act (IDEA) 214 and removed the full funding requirements for SEA programs.215
Summary of Changes to the Title I-A Formulas
The IASA included four formulas for allocating Title I-A funds: Basic Grants, Concentration Grants, Targeted Grants, and EFIG. Beginning in FY1996, all Title I appropriations above the FY1995 level ($6.6 billion) were to be allocated via Targeted Grants and a separate appropriation was to be made for EFIG. However, neither the Targeted Grant nor the EFIG formula was funded prior to the enactment of the No Child Left Behind Act in FY2002 (discussed below).
In addition to the changes to the allocation formulas, the IASA expanded and added requirements for states, LEAs, and schools receiving Title I-A funds. Most notably, the IASA attempted to raise the instructional standards of the Title I-A program, and the academic expectations for participating students, by adding requirements related to reading and mathematics standards and assessments that states, LEAs, and schools had to comply with to receive Title I-A funds.216 Other changes included adding a competitive grant program for the freely associated states,217 expanding the number of schools eligible to operate Title I-A programs on a schoolwide basis,218 changing the allocation process to schools to focus funds on fewer schools,219 expanding planning requirements, increasing the focus on professional development, and expanding parental involvement requirements. Additionally, LEAs were now permitted to use Title I-A funds for public school choice programs. With respect to the fiscal accountability requirements, the IASA also made changes to the comparability requirements under which LEAs had to demonstrate an equal distribution of nonfederal resources to Title I-A and non-Title I-A schools within their districts.220
As previously discussed, ED had historically calculated Title I-A grants by county and then the states suballocated county totals to LEAs, as sufficient LEA-level data were not available. However, beginning in FY1999 the IASA stipulated that all grants were to be calculated on the basis of formula child count data for LEAs,221 and ED began calculating Title I-A grants by LEAs not counties.222
Basic Grants
Three changes were made to the Basic Grant formula. First, the state minimum grant level was effectively raised for the formula.223 Second, in addition to serving at least 10 formula children, LEAs were no longer eligible for Basic Grants unless their formula child rate was greater than 2%. Third, a 100% LEA hold harmless applied to Basic Grants for FY1996. For FY1997 through FY1999, a hold harmless rate of 85-95% of an LEA's prior-year grant (the higher an LEA's formula child rate was, the higher its hold harmless percentage would be) applied to Basic Grants.
Concentration Grants
Three changes were made to the Concentration Grant formula. First, like Basic Grants, the state minimum grant level was effectively raised for the Concentration Grant formula.224 Second, a change was made to the way formula children were counted: if a county (or LEA beginning in FY1999) met the 6,500 poor child threshold but not the threshold of 15% of its children living in poverty, then all formula children, not just those above 6,500 (as in prior law), would be counted in calculating Concentration Grants. Third, as with Basic Grants, a 100% LEA hold harmless applied to Concentration Grants for FY1996. This hold harmless provision then dropped to 85% of the previous-year grant for FY1997 through FY1999.
Targeted Grants
The new Targeted Grant formula was similar to the Basic Grant formula except that formula children it counted were assigned weights based on the formula child count or rate for counties (for FY1996-FY1998) or LEAs (beginning in FY1999).225,226 As a result, the higher a county's or LEA's formula child rate or number of formula children was, the higher its Title I-A grant per child would be. There was also a somewhat higher LEA eligibility threshold for Targeted Grants than for Basic Grants (5% formula child rate for Targeted Grants compared to 2% formula child rate for Basic Grants). Aside from these two differences, Targeted Grants, like Basic Grants, were based on each eligible LEA's share (compared to the national total) of a formula child count multiplied by an expenditure factor, LEA hold harmless provisions, and a state minimum.227
Education Finance Incentive Grants (EFIG)
Under the new EFIG formula, allocations were first calculated for each state overall, and state totals were subsequently suballocated to LEAs within a given state using a different formula. Grants were allocated to states based on total school-age population (not just formula children) multiplied by an effort factor and an equity factor (but no expenditure factor).
Similar to the effort index included in the Special Incentive Grant formula under the 1967 ESEA amendments, the EFIG effort factor for each state was based on APPE for public K-12 education relative to personal income per capita (PCI) for each state compared to the nation as a whole. In general, the effort factor benefitted states that had a higher level of spending on education relative to PCI in their state.228 The equity factor for each state was determined based on variations in APPE among the LEAs in the state. The application of the equity factor resulted in higher grants to states with less variation in APPE among their LEAs and lower grants to states with more variation in APPE among their LEAs.229
No state could receive less than 0.25% of the total amount available for state grants. State grants were then suballocated to LEAs in proportion to total LEA grants under the other Title I-A formulas.230
Legislative Debate
The Title I-A formulas were one of the dominant issues in the debates over the IASA. The Clinton Administration's version of the IASA would have made several changes to the Basic Grant and Concentration Grant formulas to increase the targeting of Title I-A grants to high poverty areas.231 However, these proposals were not accepted by Congress, mainly due to the relatively large reductions in grants that would have occurred for many states and LEAs.232 In H.R. 6, the House Committee on Education and Labor added the Targeted Grant formula to target Title I-A funds more effectively on areas with concentrations of poverty while retaining Basic Grants and Concentration Grants to aid "other less poor but still needy communities."233 The bill also stipulated that ED would calculate grants on an LEA basis using data updated biennially to help "reduce the drastic funding shifts which have occurred in this program following each Census."234
In S. 1513, the Senate Committee on Labor and Human Resources replaced all of the existing Title I-A formulas with one formula—EFIG—in response "to recent research findings that the achievement of all students, both poor and non-poor, suffers in schools with poverty rates exceeding 30 percent."235 The committee sought to meet the original purpose of the ESEA to provide financial assistance to LEAs serving areas with concentrations of children from low-income families. Based on reports at the time, including one from ED, the committee noted the following:
Under current law, funds are spread thinly, indeed to almost every school district regardless of its level of poverty, while at the same time many high-poverty schools go unserved because funds received by their respective district are insufficient to provide services in any but the highest poverty schools.236
Under the EFIG formula proposed by the Senate committee, each state would be entitled to a grant equal to a weighted formula child count multiplied by an expenditure factor,237 an equity factor, and an effort factor.238 The equity and effort factors were included in the formulas because of concerns about disparities in funds and resources among LEAs in many states and to provide an incentive for states to reduce those disparities.239 The Senate proposal also included state hold harmless provisions to prevent sharp decreases in Title I-A funding levels.240
A compromise on a single new formula was not reached; nor was there agreement on eliminating the existing formulas. As a result, in conference all four formulas were included in the IASA. However, the EFIG formula was substantially modified (e.g., the expenditure factor was eliminated) and most formula changes were postponed until FY1996. Criticisms of the formula compromise included that it disproportionately disadvantaged southern states241 and that the formulas would not target funds enough, as they were "only a slight change from current law."242 Conversely, proponents of the compromise argued that it was "a fair compromise that makes better use of scarce Federal dollars by better targeting funds to States with the greatest need, while mitigating the dislocation to States that have benefited for so long from the old, failed, and flawed formula."243
No Child Left Behind Act (NCLB, P.L. 107-110, 2002)
The 106th Congress extensively considered proposals to comprehensively reauthorize the ESEA, but none were adopted.244 The issue remained on the agenda for the first session of the 107th Congress, and NCLB was enacted in January 2002. As with the IASA, NCLB included four different formulas for allocating Title I-A funds: Basic Grants, Concentration Grants, Targeted Grants, and EFIG.
Summary of Changes to Title I-A Formulas
NCLB made small changes to the Basic Grant, Concentration Grant, and Targeted Grant formulas and substantial changes to the EFIG formula. Additionally, NCLB provided for the use of poverty data that were updated annually, rather than every other year. NCLB also made changes to the accountability requirements states and LEAs had to meet to receive Title I-A funds245 and added new requirements regarding highly qualified teachers, paraprofessionals, and participation in the National Assessment of Educational Progress (NAEP).246 Other changes included expanding the number of schools eligible to operate Title I-A programs on a schoolwide basis,247 authorizing most LEAs to transfer up to 50% of their grants from other ESEA programs into Title I-A,248 and altering eligibility for the competitive grant program for the freely associated states.249
Although the Targeted Grant and EFIG formulas were enacted in 1994 under the IASA, they had not been funded. In an effort to fund these formulas, NCLB specified that any increases in appropriations for Title I-A over the FY2001 appropriations level had to be allocated under the Targeted Grant and EFIG formulas.250 Thus, the proportion of Title I-A funds allocated under the Targeted Grant and EFIG formulas has steadily increased since FY2002.251
Basic Grants
NCLB made few changes to the Basic Grant formula. Notably, the cap on Puerto Rico's grant amount was slightly increased.252 Additionally, the state minimum grant amount was increased from 0.25% to 0.35%, but only with respect to funds above the FY2001 level. As all increases in Title I-A funds above the FY2001 appropriations level were required to be allocated via Targeted Grants and EFIG, this change had no effect on grant amounts.
Concentration Grants
Under NCLB, the Concentration Grant formula was modified to mirror the Basic Grant formula. The Basic Grant expenditure factor (40% of state APPE subject to minimum and maximum provisions) was applied to Concentration Grants.253 Previously, the Concentration Grant expenditure factor had been equal to the maximum Basic Grant amount per formula child.254 Additionally, the tiered hold harmless provisions that had previously only applied to Basic Grants and Targeted Grants (a prior-year hold harmless of 85%-95% depending on the LEA's formula child rate) was applied to Concentration Grants. Unlike Basic Grants, however, NCLB added a special provision to Concentration Grants that expanded the hold harmless provisions. LEAs that met the eligibility requirements to receive a Concentration Grant in one year but failed to meet the requirements in a subsequent year would continue to receive a grant based on the hold harmless provisions for four additional years. Thus, under NCLB an LEA was entitled to a Concentration Grant equal to its formula child count multiplied by 40% of state APPE (subject to minimum and maximum provisions), adjusted by state minimum grant amounts and LEA hold harmless provisions.
It should be noted that, as with Basic Grants, the state minimum grant amount was increased from 0.25% to 0.35%, but only with respect to funds above the FY2001 level. As all increases in Title I-A funds above the FY2001 appropriations level were required to be allocated via Targeted Grants and EFIG, this change had no effect on grant amounts.
Targeted Grants
The allocation formula for Targeted Grants essentially remained the same under NCLB. One change of note was that the ranges used to weight formula child counts were updated based on the distribution of formula children among all LEAs according to the latest available data in 2001.255 Additionally, the state minimum grant amount was raised from 0.25% to 0.35%256 and the cap on Puerto Rico's grant amount was raised slightly.257
Education Finance Incentive Grants (EFIG)
NCLB made substantial changes to the EFIG formula. First, in the allocation of funds to states the population factor was changed from total school-age children to the same formula child count used to calculate Basic Grants, Concentration Grants, and Targeted Grants. Second, an expenditure factor based on state APPE similar to the one used in the other three formulas was added to the EFIG state allocation formula.258 Third, state totals were suballocated to LEAs based on the LEA's proportional share of a weighted formula child count (similar to the formula child counts used in Targeted Grants) as opposed to each LEA's share of funds under Basic Grants, Concentration Grants, and Targeted Grants.259 Fourth, the tiered hold harmless provisions that had previously only applied to Basic Grants and Targeted Grants (a prior-year hold harmless of 85%-95% depending on the LEA's formula child rate) were applied to EFIG. Fifth, the minimum grant provisions that applied to Targeted Grants (a minimum grant of 0.35% of total state grants, subject to a cap) were also applied to EFIG. Thus, state total grants under EFIG were based on each state's share, compared to the national total, of a formula child count multiplied by an expenditure factor, an effort factor, and an equity factor, adjusted by a state minimum. Then, each LEA's share of the state's total grant under EFIG was based on a weighted formula child count for the LEA compared to the total for all LEAs in the state, adjusted by LEA hold harmless provisions.
Legislative Debate
In January 2001, the George W. Bush Administration sent Congress a proposed plan for the reauthorization of the ESEA. The proposal for NCLB included expansions of the accountability and testing requirements but did not include changes to the Title I-A formulas.260 To target funds more effectively on areas with concentrations of poverty, the Administration requested funding for the Targeted Grant formula.261 The Administration also criticized the Concentration Grant formula for having a "cliff effect," as LEAs lost eligibility by missing the "15-percent poverty threshold by even the smallest margin."262
On May 23, 2001, the House passed H.R. 1, which eliminated the yet-to-be-funded EFIG formula. H.R. 1 made only minor changes to the three remaining formulas as "the significant changes made to the formula in the 1994 amendments [had] not been implemented due to extraordinary hold harmless provisions and lack of funding for the Targeted Grant formula."263 The House bill also added an 85% prior-year hold harmless to Concentration Grants and increased the cap on Puerto Rico's grant amounts.264 Subsequently, in June 2001 the Senate passed its version of H.R. 1.265 The Senate bill retained the EFIG formula, as there were concerns that states were not doing enough to equalize funding between rich and poor LEAs.266 The Senate bill also increased the minimum grant amount for Targeted Grants and EFIG from 0.25% to 0.5% and added a hold harmless provision for total Basic Grants, Concentration Grants, and Targeted Grants based on the greater of (1) 100% of FY2001 grants or (2) grants calculated without hold harmless provisions.267 In conference, the Title I-A formulas were rewritten to create a compromise between the House and the Senate provisions.268 It should be noted that NCLB also called for a substantial increase in Title I-A funding, as "such funding ... is critical to helping schools close the achievement gap and low-income students achieve and succeed academically."269
Every Student Succeeds Act (ESSA, P.L. 114-95, 2015)
Although the authorization of appropriations for most ESEA programs (including Title I-A) expired in FY2007, the ESEA was not reauthorized until December 10, 2015.270 Attempts were made to add a fifth formula to Title I-A and to allocate funds to LEAs and schools based solely on children in families below the poverty level.271 However, almost all of the changes to the Title I-A formulas were removed in conference. One notable change made by the ESSA was an increase in the set-aside for the Bureau of Indian Education (BIE) and Outlying Areas from 1.0% to 1.1%, provided the total amount available for state grants would not be less than the amount available in FY2016. All changes to the Title I-A grant allocation process made by the ESSA took effect in FY2017.272
The ESSA also made changes to the SNS,273 MOE,274 and standards-based accountability requirements that states and LEAs must meet to receive Title I-A funds.275 In addition, the ESSA provided flexibility in the requirements related to the distribution of Title I-A funds to schools that allows LEAs to allocate Title I-A funds to more high schools.276
Appendix A. Title I-A Appropriations
Figure A-1 details the appropriations levels for Title I-A in current and constant dollars since FY1980. Table A-1 provides the appropriations level for Title I-A in current and constant dollars since FY1980. Following a decrease in Title I-A appropriations in the early 1980s, there has generally been an upward trend in Title I-A appropriations. The largest percentage increases in appropriations since FY1980 occurred in the early 1990s and 2000s.
Figure A-2 and Table A-2 provide the appropriations level and share by Title I-A formula since FY1980. As previously discussed, all post-FY2001 increases in Title I-A appropriations have been divided between Targeted Grants and EFIG. Thus, the share of appropriations allocated via the Targeted Grant and EFIG formulas has been steadily increasing while the share of appropriations allocated via the Basic and Concentration Grant formulas has been steadily decreasing.277
|
Figure A-1. ESEA Title I-A Appropriations Levels, FY1980-FY2017 Dollars in thousands |
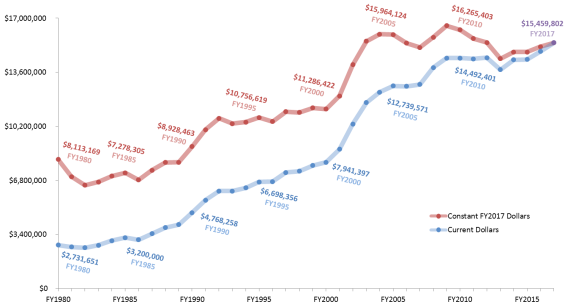 |
|
Source: Figure prepared by the Congressional Research Service (CRS) based on data available from the U.S. Department of Education, Budget Service. Appropriations levels in constant FY2017 dollars were calculated by CRS based on the Consumer Price Index for All Urban Consumers (CPI-U), available from the U.S. Department of Labor, Bureau of Labor Statistics. Notes: Title I-A has been funded since FY1966. However, a consistent source of appropriations data is only available for FY1980 onward (the year in which ED was created). Thus, fiscal years prior to FY1980 were not included in this analysis. The appropriations level for FY2009 does not reflect the additional $10 billion for Title I-A appropriated through the American Recovery and Reinvestment Act (ARRA; P.L. 111-5). |
|
Figure A-2. Title I-A Appropriations by Formula, FY1980 through FY2017 Dollars in thousands |
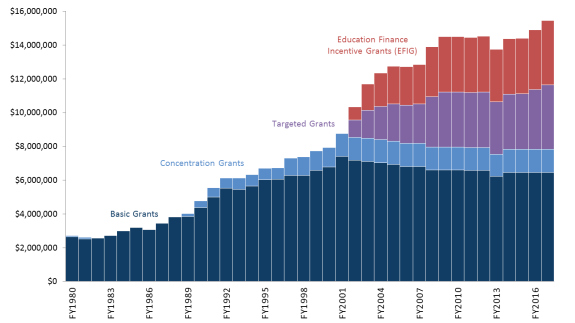 |
|
Source: Figure prepared by the Congressional Research Service (CRS) based on data available from the U.S. Department of Education, Budget Service. Notes: Appropriations provided in current (not constant) dollars. Title I-A has been funded since FY1966. However, a consistent source of appropriations data is only available for FY1980 onward (the year in which ED was created). Thus, fiscal years prior to FY1980 were not included in this analysis. The appropriations level for FY2009 does not reflect the additional $10 billion for Title I-A appropriated through the American Recovery and Reinvestment Act (ARRA; P.L. 111-5). For FY1982 through FY1988, Title I-A funds were allocated solely through the Basic Grant formula. The No Child Left Behind Act (NCLB; P.L. 107-110) required that all funds in excess of the FY2001 appropriations levels for the Basic Grant and Concentration Grant formulas be provided to Targeted Grant and EFIG formulas. The statutory language did not specify how the excess funds should be divided between the two formulas. Rather, these decisions have been made through the appropriations process. In addition, while the statutory language references the FY2001 funding levels for the Basic Grant and Concentration Grant formulas, appropriations for these formulas are currently below their FY2001 levels. In practice, since FY2002 the Targeted Grant and EFIG formulas have received all funds in excess of the amount actually appropriated for the Basic Grant and Concentration Grant formulas. For FY2002 and FY2003, two-thirds of these funds were provided to the Targeted Grant formula and one-third of the funds were provided to the EFIG formula. Beginning in FY2004, these funds were divided evenly between the Targeted Grant and EFIG formulas. Beginning in FY2017, the ESSA requires that all funds in excess of the FY2001 appropriations levels for Basic Grants and Concentration Grants be divided evenly between the Targeted Grant and EFIG formulas. If appropriations for the Basic Grant and Concentration Grant formulas remain below their FY2001 levels, it is possible that the Targeted Grant and EFIG formulas will each continue to receive half of the Title I-A appropriations in excess of what is provided for the Basic Grant and Concentration Grant formulas. |
|
Current Dollars |
Constant FY2017 Dollars |
|||||
|
Fiscal Year |
Appropriations Level |
Difference from Prior Year |
Percentage Difference from Prior Year |
Appropriations Level |
Difference from Prior Year |
Percentage Difference from Prior Year |
|
1980 |
$2,731,651 |
― |
― |
$8,113,169 |
― |
― |
|
1981 |
$2,611,317 |
-$120,334 |
-4.41% |
$7,030,533 |
-$1,082,636 |
-13.34% |
|
1982 |
$2,562,753 |
-$48,564 |
-1.86% |
$6,499,381 |
-$531,152 |
-7.55% |
|
1983 |
$2,727,588 |
$164,835 |
6.43% |
$6,702,116 |
$202,736 |
3.12% |
|
1984 |
$3,003,680 |
$276,092 |
10.12% |
$7,075,069 |
$372,952 |
5.56% |
|
1985 |
$3,200,000 |
$196,320 |
6.54% |
$7,278,305 |
$203,236 |
2.87% |
|
1986 |
$3,062,400 |
-$137,600 |
-4.30% |
$6,838,233 |
-$440,072 |
-6.05% |
|
1987 |
$3,453,500 |
$391,100 |
12.77% |
$7,440,012 |
$601,779 |
8.80% |
|
1988 |
$3,829,600 |
$376,100 |
10.89% |
$7,922,481 |
$482,468 |
6.48% |
|
1989 |
$4,026,100 |
$196,500 |
5.13% |
$7,946,125 |
$23,644 |
0.30% |
|
1990 |
$4,768,258 |
$742,158 |
18.43% |
$8,928,463 |
$982,338 |
12.36% |
|
1991 |
$5,557,678 |
$789,420 |
16.56% |
$9,986,397 |
$1,057,934 |
11.85% |
|
1992 |
$6,134,240 |
$576,562 |
10.37% |
$10,700,292 |
$713,895 |
7.15% |
|
1993 |
$6,125,923 |
-$8,317 |
-0.14% |
$10,375,194 |
-$325,098 |
-3.04% |
|
1994 |
$6,336,000 |
$210,077 |
3.43% |
$10,463,079 |
$87,885 |
0.85% |
|
1995 |
$6,698,356 |
$362,356 |
5.72% |
$10,756,619 |
$293,540 |
2.81% |
|
1996 |
$6,730,348 |
$31,992 |
0.48% |
$10,498,013 |
-$258,606 |
-2.40% |
|
1997 |
$7,295,232 |
$564,884 |
8.39% |
$11,123,888 |
$625,875 |
5.96% |
|
1998 |
$7,375,232 |
$80,000 |
1.10% |
$11,073,391 |
-$50,497 |
-0.45% |
|
1999 |
$7,732,397 |
$357,165 |
4.84% |
$11,358,780 |
$285,389 |
2.58% |
|
2000 |
$7,941,397 |
$209,000 |
2.70% |
$11,286,422 |
-$72,358 |
-0.64% |
|
2001 |
$8,762,721 |
$821,324 |
10.34% |
$12,109,130 |
$822,708 |
7.29% |
|
2002 |
$10,350,000 |
$1,587,279 |
18.11% |
$14,079,970 |
$1,970,839 |
16.28% |
|
2003 |
$11,688,664 |
$1,338,664 |
12.93% |
$15,546,749 |
$1,466,779 |
10.42% |
|
2004 |
$12,342,309 |
$653,645 |
5.59% |
$15,990,314 |
$443,565 |
2.85% |
|
2005 |
$12,739,571 |
$397,262 |
3.22% |
$15,964,124 |
-$26,190 |
-0.16% |
|
2006 |
$12,713,125 |
-$26,446 |
-0.21% |
$15,433,141 |
-$530,983 |
-3.33% |
|
2007 |
$12,838,125 |
$125,000 |
0.98% |
$15,153,287 |
-$279,854 |
-1.81% |
|
2008 |
$13,898,875 |
$1,060,750 |
8.26% |
$15,798,727 |
$645,440 |
4.26% |
|
2009a |
$14,492,401 |
$593,526 |
4.27% |
$16,532,201 |
$733,474 |
4.64% |
|
2010 |
$14,492,401 |
$0 |
0.00% |
$16,265,403 |
-$266,798 |
-1.61% |
|
2011 |
$14,442,927 |
-$49,474 |
-0.34% |
$15,713,864 |
-$551,539 |
-3.39% |
|
2012 |
$14,516,457 |
$73,530 |
0.51% |
$15,473,645 |
-$240,219 |
-1.53% |
|
2013 |
$13,760,219 |
-$756,238 |
-5.21% |
$14,455,799 |
-$1,017,846 |
-6.58% |
|
2014 |
$14,384,802 |
$624,583 |
4.54% |
$14,870,724 |
$422,854 |
2.93% |
|
2015 |
$14,409,802 |
$25,000 |
0.17% |
$14,878,908 |
$39,332 |
0.26% |
|
2016 |
$14,909,802 |
$500,000 |
3.47% |
$15,203,392 |
$309,695 |
2.08% |
|
2017 |
$15,459,802 |
$550,000 |
3.69% |
$15,459,802 |
$177,249 |
1.17% |
Source: Table prepared by the Congressional Research Service (CRS) based on data available from the U.S. Department of Education, Budget Service. Appropriations levels in constant FY2017 dollars were calculated by CRS based on the Consumer Price Index for All Urban Consumers (CPI-U), available from the U.S. Department of Labor, Bureau of Labor Statistics. For 2017, May 2017 data were used.
Notes: Appropriations provided in current and constant dollars. Percentages based on unrounded numbers. Title I-A has been funded since FY1966. However, a consistent source of appropriations data is only available for FY1980 onward (the year in which ED was created). Thus, fiscal years prior to FY1980 were not included in this analysis.
a. Does not include the additional $10 billion for Title I-A appropriated through the American Recovery and Reinvestment Act (ARRA; P.L. 111-5).
|
Fiscal Year |
Appropriations Level, Share of Total Appropriations |
Basic Grants |
Concentration Grants |
Targeted Grants |
Education Finance Incentive Grants (EFIG) |
|
1980 |
Appropriations |
$2,633,326 |
$98,325 |
― |
― |
|
Share of Total |
96.40% |
3.60% |
― |
― |
|
|
1981 |
Appropriations |
$2,511,317 |
$100,000 |
― |
― |
|
Share of Total |
96.17% |
3.83% |
― |
― |
|
|
1982 |
Appropriations |
$2,562,753 |
― |
― |
― |
|
Share of Total |
100.00% |
― |
― |
― |
|
|
1983 |
Appropriations |
$2,727,588 |
― |
― |
― |
|
Share of Total |
100.00% |
― |
― |
― |
|
|
1984 |
Appropriations |
$3,003,680 |
― |
― |
― |
|
Share of Total |
100.00% |
― |
― |
― |
|
|
1985 |
Appropriations |
$3,200,000 |
― |
― |
― |
|
Share of Total |
100.00% |
― |
― |
― |
|
|
1986 |
Appropriations |
$3,062,400 |
― |
― |
― |
|
Share of Total |
100.00% |
― |
― |
― |
|
|
1987 |
Appropriations |
$3,453,500 |
― |
― |
― |
|
Share of Total |
100.00% |
― |
― |
― |
|
|
1988 |
Appropriations |
$3,829,600 |
― |
― |
― |
|
Share of Total |
100.00% |
― |
― |
― |
|
|
1989 |
Appropriations |
$3,853,200 |
$172,900 |
― |
― |
|
Share of Total |
95.71% |
4.29% |
― |
― |
|
|
1990 |
Appropriations |
$4,373,146 |
$395,112 |
― |
― |
|
Share of Total |
91.71% |
8.29% |
― |
― |
|
|
1991 |
Appropriations |
$5,001,910 |
$555,768 |
― |
― |
|
Share of Total |
90.00% |
10.00% |
― |
― |
|
|
1992 |
Appropriations |
$5,524,310 |
$609,930 |
― |
― |
|
Share of Total |
90.06% |
9.94% |
― |
― |
|
|
1993 |
Appropriations |
$5,449,925 |
$675,998 |
― |
― |
|
Share of Total |
88.96% |
11.04% |
― |
― |
|
|
1994 |
Appropriations |
$5,642,000 |
$694,000 |
― |
― |
|
Share of Total |
89.05% |
10.95% |
― |
― |
|
|
1995 |
Appropriations |
$6,028,521 |
$669,835 |
― |
― |
|
Share of Total |
90.00% |
10.00% |
― |
― |
|
|
1996 |
Appropriations |
$6,046,266 |
$684,082 |
― |
― |
|
Share of Total |
89.84% |
10.16% |
― |
― |
|
|
1997 |
Appropriations |
$6,273,212 |
$1,022,020 |
― |
― |
|
Share of Total |
85.99% |
14.01% |
― |
― |
|
|
1998 |
Appropriations |
$6,273,212 |
$1,102,020 |
― |
― |
|
Share of Total |
85.06% |
14.94% |
― |
― |
|
|
1999 |
Appropriations |
$6,574,000 |
$1,158,397 |
― |
― |
|
Share of Total |
85.02% |
14.98% |
― |
― |
|
|
2000 |
Appropriations |
$6,783,000 |
$1,158,397 |
― |
― |
|
Share of Total |
85.41% |
14.59% |
― |
― |
|
|
2001 |
Appropriations |
$7,397,690 |
$1,365,031 |
― |
― |
|
Share of Total |
84.42% |
15.58% |
― |
― |
|
|
2002 |
Appropriations |
$7,172,971 |
$1,365,031 |
$1,018,499 |
$793,499 |
|
Share of Total |
69.30% |
13.19% |
9.84% |
7.67% |
|
|
2003 |
Appropriations |
$7,111,635 |
$1,365,031 |
$1,670,239 |
$1,541,759 |
|
Share of Total |
60.84% |
11.68% |
14.29% |
13.19% |
|
|
2004 |
Appropriations |
$7,037,592 |
$1,365,031 |
$1,969,843 |
$1,969,843 |
|
Share of Total |
57.02% |
11.06% |
15.96% |
15.96% |
|
|
2005 |
Appropriations |
$6,934,854 |
$1,365,031 |
$2,219,843 |
$2,219,843 |
|
Share of Total |
54.44% |
10.71% |
17.42% |
17.42% |
|
|
2006 |
Appropriations |
$6,808,408 |
$1,365,031 |
$2,269,843 |
$2,269,843 |
|
Share of Total |
53.55% |
10.74% |
17.85% |
17.85% |
|
|
2007 |
Appropriations |
$6,808,408 |
$1,365,031 |
$2,332,343 |
$2,332,343 |
|
Share of Total |
53.03% |
10.63% |
18.17% |
18.17% |
|
|
2008 |
Appropriations |
$6,597,946 |
$1,365,031 |
$2,967,949 |
$2,967,949 |
|
Share of Total |
47.47% |
9.82% |
21.35% |
21.35% |
|
|
2009a |
Appropriations |
$6,597,946 |
$1,365,031 |
$3,264,712 |
$3,264,712 |
|
Share of Total |
45.53% |
9.42% |
22.53% |
22.53% |
|
|
2010 |
Appropriations |
$6,597,946 |
$1,365,031 |
$3,264,712 |
$3,264,712 |
|
Share of Total |
45.53% |
9.42% |
22.53% |
22.53% |
|
|
2011 |
Appropriations |
$6,579,151 |
$1,359,726 |
$3,252,025 |
$3,252,025 |
|
Share of Total |
45.55% |
9.41% |
22.52% |
22.52% |
|
|
2012 |
Appropriations |
$6,577,904 |
$1,362,301 |
$3,288,126 |
$3,288,126 |
|
Share of Total |
45.31% |
9.38% |
22.65% |
22.65% |
|
|
2013 |
Appropriations |
$6,232,639 |
$1,293,919 |
$3,116,831 |
$3,116,831 |
|
Share of Total |
45.29% |
9.40% |
22.65% |
22.65% |
|
|
2014 |
Appropriations |
$6,459,401 |
$1,362,301 |
3,281,550 |
3,281,550 |
|
Share of Total |
44.90% |
9.47% |
22.81% |
22.81% |
|
|
2015 |
Appropriations |
$6,459,401 |
$1,362,301 |
$3,294,050 |
$3,294,050 |
|
Share of Total |
44.83% |
9.45% |
22.86% |
22.86% |
|
|
2016 |
Appropriations |
$6,459,401 |
$1,362,301 |
$3,544,050 |
$3,544,050 |
|
Share of Total |
43.32% |
9.14% |
23.77% |
23.77% |
|
|
2017 |
Appropriations |
$6,459,401 |
$1,362,301 |
$3,819,050 |
$3,819,050 |
|
Share of Total |
41.78% |
8.81% |
24.70% |
24.70% |
Source: Table prepared by the Congressional Research Service (CRS) based on data available from the U.S. Department of Education, Budget Service.
Notes: Appropriations provided in current (not constant) dollars. Percentages based on unrounded numbers. Title I-A has been funded since FY1966. However, a consistent source of appropriations data is only available for FY1980 onward (the year in which ED was created). Thus, fiscal years prior to FY1980 were not included in this analysis.
The No Child Left Behind Act (NCLB; P.L. 107-110) required that all funds in excess of the FY2001 appropriations levels for the Basic Grant and Concentration Grant formulas be provided to the Targeted Grant and EFIG formulas. The statutory language did not specify how the excess funds should be divided between the two formulas. Rather, these decisions have been made through the appropriations process. In addition, while the statutory language references the FY2001 funding levels for the Basic Grant and Concentration Grant formulas, appropriations for these formulas are currently below their FY2001 levels. In practice, since FY2002 the Targeted Grant and EFIG formulas have received all funds in excess of the amount actually appropriated for the Basic Grant and Concentration Grant formulas. For FY2002 and FY2003, two-thirds of these funds were provided to the Targeted Grant formula and one-third of the funds were provided to the EFIG formula. Beginning in FY2004, these funds were divided evenly between the Targeted Grant and EFIG formulas. Beginning in FY2017, the ESSA requires that all funds in excess of the FY2001 appropriations levels for Basic Grants and Concentration Grants be divided evenly between the Targeted Grant and EFIG formulas. If appropriations for the Basic Grant and Concentration Grant formulas remain below their FY2001 levels, it is possible that the Targeted Grant and EFIG formulas will each continue to receive half of the Title I-A appropriations in excess of what is provided for the Basic Grant and Concentration Grant formulas.
a. Does not include the additional $10 billion for Title I-A appropriated through the American Recovery and Reinvestment Act (ARRA; P.L. 111-5).
Appendix B. Timeline of Changes to Title I-A Formulas and Related Provisions
Table B-1, Table B-2, Table B-3, and Table B-4 provide a timeline of changes to the formula factors and provisions for the Basic Grants, Concentration Grants, Targeted Grants, and EFIG, respectively. Table B-5 provides a timeline of changes to factors and related provisions that generally apply to Title I-A formulas.
|
ESEA Legislation |
Formula Child Count |
Formula Child Eligibility Threshold for Local Educational Agencies (LEAs) |
Expenditure Factor |
Minimum State Grant Provisions |
LEA Hold Harmless Provisions |
Stages in the Grant Calculation Process |
|
ESEA as originally enacted (1965) |
Children ages 5-17 in families with an annual income below $2,000 (based on data from the 1960 Decennial Census)a and children in families with income of at least $2,000 as a result of receiving Aid to Families with Dependent Children (AFDC). |
(1) At least 100 formula children, or (2) at least 10 formula children and formula children account for more than 3% of the children ages 5-17 that resided in the LEA (referred to as a formula child rate). |
50% of the state's average per pupil expenditure (APPE) for public K-12 education.a |
None. |
None. |
Grants calculated at the county level (as LEA data were not available); states received funds based on county calculations and subsequently determined LEA grant amounts. |
|
Amendments to P.L. 81-815 and P.L. 81-874 (1965) |
Same as prior provisions. |
Same as prior provisions. |
Same as prior provisions. |
None. |
None. |
Same as prior provisions. |
|
ESEA Amendments of 1966 (1966) |
Children ages 5-17 (1) in families with an annual income below $2,000 for FY1967 and $3,000 for FY1968 (based on data from the 1960 Decennial Census); (2) neglected, delinquent, and foster children; and (3) children in families with income of at least $2,000 for FY1967 and $3,000 for FY1968 as a result of receiving AFDC. |
At least 10 formula children. |
50% of the greater of state or national APPE beginning in FY1968. |
None.b |
None. |
Same as prior provisions. |
|
ESEA Amendments of 1967 (1968) |
Same as prior provisions except that the use of $3,000 as the poverty threshold to identify children was delayed and could not take effect until each LEA reached its maximum grant amount based on the $2,000 poverty threshold.c |
Same as prior provisions. |
Same as prior provisions. |
Until appropriations reached $1.5 billion, no state could receive less than it received in FY1967.d |
None. |
Same as prior provisions. |
|
ESEA Amendments of 1969 (1970) |
Same as prior provisions, except that the poverty threshold was $4,000 beginning with FY1973 (based on data from either the 1970 or the 1960 Decennial Census) but could not take effect until each LEA reached its maximum grant amount based on the $2,000 poverty threshold.e |
Same as prior provisions. |
Same as prior provisions. |
Same as prior provisions. |
None. |
Same as prior provisions. |
|
Education Amendments of 1974 (1974) |
Children ages 5-17 in families at or below the poverty thresholds that were applied by the Census Bureau in compiling the 1970 Decennial Census;f two-thirds of the children in families receiving AFDC payments above the poverty threshold (i.e., the total number of eligible AFDC children multiplied by two-thirds); and neglected, delinquent, and foster children. |
Same as prior provisions. |
State APPE for public K-12 education, subject to a minimum of 80% and maximum of 120% of the national APPE, further multiplied by 0.40.g |
None. |
85% of prior-year grant amount.h |
Same as prior provisions. |
|
Education Amendments of 1978 (1978) |
Children ages 5-17 (1) in poor families (based on 1980 Decennial Census data);j (2) beginning in FY1980, children in families receiving AFDC payments above the poverty level counted in full (as opposed to two-thirds); and (3) neglected, delinquent, and foster children. Additionally, half of the funds in excess of the FY1979 appropriations levels were allocated to states on the basis of counts of children in families with incomes below 50% of the median income for a four-person family (based on the 1976 Survey of Income and Education). |
Same as prior provisions. |
Same as prior provisions. |
None. |
Same as prior provisions. |
Same as prior provisions. |
|
Education Consolidation and Improvement Act (ECIA; 1981) |
Same as prior provisions. |
Same as prior provisions. |
Same as prior provisions. |
None. |
Same as prior provisions. |
Same as prior provisions. |
|
ECIA Technical Amendments (1983) |
Same as prior provisions. |
Same as prior provisions. |
Same as prior provisions. |
None. |
Same as prior provisions. |
Same as prior provisions. |
|
Augustus F. Hawkins-Robert T. Stafford Elementary and Secondary School Improvement Amendments of 1988 (1988) |
Same as prior provisions, except they allowed the 1980 Census poverty thresholds to be applied to the 1980 Census data used to allocate funds (as opposed to the 1970 poverty thresholds) and allowed the 1990 Census poverty thresholds and data to be used when those data became available. Also eliminated the requirement that funds be allocated based on the 1976 Survey of Income and Education (SIE) data. |
Same as prior provisions. |
Same as prior provisions. |
If appropriations for Title I exceeded $700 million and the Concentration Grant formula was not funded, no state could receive less than 0.25% of the total funding available for grants, subject to a series of caps.k |
Same as prior provisions. |
Same as prior provisions. |
|
Improving America's Schools Act (IASA; 1994) |
Same as prior provisions. |
10 or more formula children and a formula child rate of more than 2%. |
Same as prior provisions. |
Up to 0.25% of total state grants, subject to a series of caps. |
100% hold harmless for FY1996. For FY1997 through FY1999, 85%-95% of the previous-year grant, depending on the LEA's formula child rate, applicable only to LEAs meeting the formula's eligibility thresholds. |
Same as prior provisions, except beginning in FY1999 grants were initially calculated at the LEA level rather than the county level.l |
|
No Child Left Behind Act of 2001 (NCLB; 2002) |
Children aged 5-17 (1) in families with income below the federal poverty threshold (based on Census Bureau Small Area Income and Poverty Estimates (SAIPE) data); (2) in institutions for neglected or delinquent children or in foster homes; and (3) in families receiving Temporary Assistance for Needy Families (TANF) payments above the poverty income level for a family of four. |
Same as prior provisions. |
Same as prior provisions. |
Same as prior provisions.m |
85%-95% of the previous-year grant, depending on the LEA's formula child rate, applicable only to LEAs meeting the formula's eligibility thresholds. |
Same as prior provisions. |
|
Every Student Succeeds Act (ESSA; 2015) |
Same as prior provisions. |
Same as prior provisions. |
Same as prior provisions. |
Same as prior provisions. |
Same as prior provisions. |
Same as prior provisions. |
Source: Table prepared by the Congressional Research Service (CRS) based on CRS review of the Elementary and Secondary Education Act (ESEA) as originally enacted and subsequent amendments to the act.
Notes: The Education Amendments of 1972 and the Education Amendments of 1984 did not make substantial changes to the Title I-A formulas; thus these reauthorizations are not included in the table.
a. For FY1967 and FY1968, the low-income and expenditure factors were left unspecified for future congressional determination.
b. The FY1967 supplemental appropriations law (P.L. 89-697) required that, for FY1967, no state receive less than what it spent in FY1966.
c. The $3,000 threshold was never used for grant determination purposes.
d. The FY1968 Labor-HEW appropriations bill, which was enacted prior to the ESEA Amendments of 1967, added an initial state minimum grant provision. Under this provision, no state could receive less than it had received in FY1967.
e. The $4,000 threshold was never used for grant determination purposes.
f. These poverty thresholds are sometimes referred to as the "Orshansky" poverty thresholds.
g. The APPE used in a state's expenditure factor calculation could not be less than 80% of national APPE or more than 120% of national APPE. If a state's APPE was less than 80% of the national APPE, the state's APPE was automatically raised to 80% of the national APPE. If a state's APPE was more than 120% of the national APPE, the state's APPE was automatically reduced to 120% of the national APPE. After adjustments, should they be needed, a state's APPE was multiplied by 0.40. Different provisions applied to the calculation of the expenditure factor for Puerto Rico.
h. A separate annual appropriation of $15.7 million was authorized to be used at the discretion of the Commissioner of Education to help LEAs whose Basic Grants in any year were less than 90% of their grant amount in the previous year. This provision was not retained by the 1978 amendments.
i. Unlike the 50 states and the District of Columbia, no lower bound was applied to Puerto Rico's expenditure factor.
j. The 1980 Decennial Census data were to be used when they became available. However, the 1974 amendments did not remove references to the 1970 Census poverty thresholds. Thus, 1970 Census poverty thresholds were applied to 1980 Census data.
k. The application of the 0.25% minimum grant could not result in any state receiving a grant greater than 150% of its grant from the previous year or greater than 150% of the national average grant per formula child multiplied by the number of formula children in the state.
l. Exceptions were made to this requirement. For example, an exception was made for New York City and Hawaii, where each of their counties was treated as if it was a separate LEA.
m. The state minimum grant amount was raised from 0.25% to 0.35%, but only with respect to funds above the FY2001 level. As appropriations for Basic Grants did not exceed the FY2001 level, this change had no effect on grant amounts.
|
ESEA Legislation |
Formula Child Count |
Formula Child Eligibility Threshold for Local Educational Agencies (LEAs) |
Expenditure Factor |
Minimum State Grant Provisions |
LEA Hold Harmless Provisions |
Stages in the Grant Calculation Process |
|
ESEA Amendments of 1969 (1970)a |
Children ages 5-17 (1) in families with an annual income below $4,000 (based on data from the 1960 Decennial Census), (2) neglected, delinquent, and foster children, and (3) and children in families with income of at least $4,000 as a result of receiving AFDC. The $4,000 poverty threshold was reduced to $2,000 if appropriations were insufficient for each LEA to receive its maximum Basic Grant amount based on the $2,000 poverty threshold.b,c |
Formula child rate of at least 20% or at least 5,000 formula children (provided that the number of formula children constituted at least 5% of the total number of school-age children served by the LEA).d Additionally, had to be eligible for a Basic Grant. |
An LEA's Concentration Grant was equal to 30% of its maximum Basic Grant amount for FY1970 and 40% of its maximum Basic Grant amount for all subsequent fiscal years. |
None. |
None. |
Grants determined at the LEA level and were allocated to LEAs via state educational agencies (SEAs).e |
|
Education Amendments of 1974 (1974) |
Children (1) in families with an annual income below $3,000, (2) in families with income at or above $3,000 as a result of receiving AFDC, or (3) in institutions for neglected or delinquent children or in foster homes. |
Must be located in a county eligible for a Basic Grant and which had at least 10,000 formula children (provided these children accounted for at least 5% of the school-age population) or the number of formula children in the county had to be at least 200% of the average number of formula children in the state. |
50% of state average per pupil expenditure (APPE) for public K-12 education. |
None. |
None. |
Grants determined at the county level. The SEA subsequently determined grants for all LEAs in each eligible county. |
|
Education Amendments of 1978 (1978) |
Children ages 5-17 (1) in poor families (based on 1980 Decennial Census data),f (2) in families receiving AFDC payments above the poverty level; and (3) neglected, delinquent, and foster children.c |
Must be located in a county eligible for a Basic Grant and which had over 5,000 formula children or formula children had to account for more than 20% of the total school-age population of the county. Only formula children in excess of these thresholds were used to determine grant amounts. |
County maximum grant determined by multiplying the number of formula children residing in the county in excess of the eligibility thresholds by its maximum Basic Grant per formula child.g |
0.25% of the total amount available for state grants. |
None. |
Grants determined at the county level. The SEA subsequently determined grants for all LEAs in each eligible county based on each LEA's number of formula children with a higher weight given to formula children in LEAs with higher formula child rates.h |
|
Education Consolidation and Improvement Act (ECIA; 1981) |
Same as prior provisions. |
Same as prior provisions. |
Same as prior provisions. |
Same as prior provisions. |
None. |
Same as prior provisions. |
|
ECIA Technical Amendments (1983) |
Same as prior provisions. |
Same as prior provisions. |
Same as prior provisions. |
Same as prior provisions. |
None. |
Same as prior provisions. |
|
Augustus F. Hawkins-Robert T. Stafford Elementary and Secondary School Improvement Amendments of 1988 (1988)i |
Same as prior provisions, except they allowed the 1980 Census poverty thresholds to be applied to the 1980 Census data used to allocate funds (as opposed to the 1970 poverty thresholds) and allowed the 1990 Census poverty thresholds and data to be used when those data became available.c Additionally, if the formula child rate was below 15% then only formula children above 6,500 were counted when allocating grants. |
Number of formula children in the county had to exceed 6,500 or account for more than 15% of the total school-age population of the county. Additionally, a county had to be eligible to receive a Basic Grant. LEAs in counties receiving Concentration Grants also had to have more than 6,500 formula children or a formula child rate above 15% to be eligible for a Concentration Grant. |
Same as prior provisions. |
Greater of (1) up to 0.25% of total state grants, subject to a series of caps or (2) $250,000. |
None. |
Grants determined at the county level. The SEA subsequently determined grants for LEAs based on each LEA's proportionate share of eligible formula children provided that the LEA met the threshold eligibility requirements that applied to counties and was located in an eligible county.j |
|
Improving America's Schools Act (IASA; 1994) |
Same as prior provisions, except that all formula children (not just those above the 6,500 threshold) were included in the determination of grants.c |
Same as prior provisions. |
Same as prior provisions. |
Same as prior provisions. |
100% for FY1996 and 85% for all subsequent fiscal years. |
Same as prior provisions through FY1998. Beginning in FY1999, grants were determined at the LEA level and were allocated to LEAs via SEAs. |
|
No Child Left Behind Act of 2001 (NCLB; 2002) |
Children ages 5-17 (1) in families with income below the federal poverty threshold (based on Census Bureau Small Area Income and Poverty Estimates (SAIPE) data); (2) in institutions for neglected or delinquent children or in foster homes; and (3) in families receiving TANF payments above the poverty income level for a family of four. |
Same as prior provisions. |
State APPE for public K-12 education, subject to a minimum of 80% and maximum of 120% of the national APPE, further multiplied by 0.40. |
Same as prior provisions.k |
85%-95% of the previous-year grant, depending on the LEA's formula child rate. LEAs that met the eligibility requirements for Concentration Grants for one year but failed to meet the requirements in a subsequent year continued to receive a grant based on the hold harmless provisions for four additional years. |
Same as prior provisions. |
|
Every Student Succeeds Act (ESSA; 2015) |
Same as prior provisions. |
Same as prior provisions. |
Same as prior provisions. |
Same as prior provisions. |
Same as prior provisions. |
Same as prior provisions. |
Source: Table prepared by the Congressional Research Service (CRS) based on CRS review of the Elementary and Secondary Education Act (ESEA) as originally enacted and subsequent amendments to the act.
Notes: The Education Amendments of 1972 and the Education Amendments of 1984 did not make substantial changes to the Title I-A formulas; thus these reauthorizations are not included in the table. From FY1970 through FY1974 the ESEA included the Special Grants for Urban and Rural Schools program and in FY1975 the ESEA included the Special Grant program. These grant programs were similar in purpose and scope to the Concentration Grant program; thus, for the purposes of this table, Special Grants for Urban and Rural Schools and Special Grants are not receiving separate coverage in this appendix table.
a. Appropriations for grant were limited to no more than 15% of all Title I appropriations in excess of $1.39 billion. If funding for all Title I programs (not just Title I-A grants to LEAs) was below $1.39 billion (as was the case in FY1970), no funds were to be appropriated for Special Grants. Special Grants were first funded in FY1971.
b. The $4,000 threshold was never used in grant determinations.
c. This was the same formula child population used in the determination of Basic Grants.
d. The eligibility requirements for Special Grants could be waived if an SEA determined than an LEA had an "urgent need" for aid to meet the special educational needs of educationally deprived children.
e. LEA level data needed for grant amount and eligibility determinations were provided to the Department of Health, Education, and Welfare (HEW) by state educational agencies (SEAs) (45 C.F.R. §116.10).
f. The 1980 Decennial Census data were to be used when they became available.
g. A county's maximum Basic Grant per formula child was equal to a county's maximum grant amount calculated under the Basic Grant formula divided by the county's prior year formula child count.
h. In distributing county Concentration Grants among LEAs in the county, each formula child was weighted at 1.0 if the LEA's percentage of such children (compared to its total population ages 5-17) was 20% or higher. If the LEA's percentage was less than 20%, then each formula child was weighted at less than 1.0, with the specific weight being equal to the LEA's percentage divided by 20%. Thus, if an LEA had a formula child rate of 10%, then the weight applied to formula children in that LEA when distributing Concentration Grants would be 10 divided by 20, or 0.5.
i. Concentration grants were required to receive all Chapter I-A appropriations between $3.9 billion and $4.3 billion and 10% of all appropriations in excess of $4.3 billion.
j. If no LEA in the county met these criteria, then the Concentration Grant would be shared by all LEAs in the county that had a number or percentage of formula children above the county average. In addition, states could reserve up to 2% of their Concentration Grants to distribute to LEAs with relatively high numbers or percentages of formula children located in counties that were not eligible for Concentration Grants.
k. The state minimum grant amount was raised from 0.25% to 0.35%, but only with respect to funds above the FY2001 level. As appropriations for Concentration Grants did not exceed the FY2001 level, this change had no effect on grant amounts.
|
ESEA Legislation |
Formula Child Count |
Formula Child Eligibility Threshold for Local Educational Agencies (LEAs) |
Weighting of Formula Child Count and Rate |
Expenditure Factor |
Minimum State Grant |
LEA Hold Harmless |
Stages in the Grant Calculation Process |
|
Improving America's Schools Act (IASA; 1994) |
Children ages 5-17 (1) in families with income below the federal poverty threshold; (2) in families receiving AFDC or TANF payments above the poverty level;a and (3) neglected, delinquent, and foster children. |
10 or more formula children and a formula child rate of 5% or more. |
At all stages of the grant determination process, formula children were assigned weights on the basis of each LEA's number of formula children and formula child rate.b |
State average per pupil expenditure (APPE) for public K-12 education, subject to a minimum of 80% and maximum of 120% of the national APPE, further multiplied by 0.40. |
0.25% of total state grants, subject to a cap. |
85%-95% of the previous-year grant, depending on the LEA's formula child rate, applicable only to LEAs meeting the formula's eligibility thresholds. |
Grants were calculated at the LEA level, subject to state minimum grant provisions. |
|
No Child Left Behind Act of 2001 (NCLB; 2002) |
Children ages 5-17 (1) in families with income below the federal poverty threshold (based on Census Bureau Small Area Income and Poverty Estimates (SAIPE) data); (2) in institutions for neglected or delinquent children or in foster homes; and (3) in families receiving Temporary Assistance for Needy Families (TANF) payments above the poverty income level for a family of four. |
Same as prior provisions. |
Same as prior provisions. |
0.35% of total state grants, subject to a cap. |
Same as prior provisions. |
Same as prior provisions. |
|
|
Every Student Succeeds Act (ESSA; 2015) |
Same as prior provisions. |
Same as prior provisions. |
Same as prior provisions. |
Same as prior provisions. |
Same as prior provisions. |
Same as prior provisions. |
Same as prior provisions. |
Source: Table prepared by the Congressional Research Service based on CRS review of the Elementary and Secondary Education Act (ESEA) as originally enacted and subsequent amendments to the act.
Notes: The Targeted Grant formula was initially authorized in FY1996. However, no funds were appropriated for the formula until FY2002, after the enactment of the No Child Left Behind Act of 2001 (NCLB).
a. In 1996, Aid to Families with Dependent Children (AFDC) was replaced by Temporary Assistance to Needy Families (TANF).
b. For Puerto Rico, all formula children received a weight of 1.72 (as opposed to using the weighting scales based on formula child rates and numbers). As a result of the 1.72 weight, Puerto Rico was estimated to receive approximately the same share of Targeted Grants as it received under Basic Grants and Concentration Grants prior to the IASA. This cap reduced grants below the level that Puerto Rico would have received if there was no cap on Puerto Rico's number and percentage of formula children, which would translate into a substantially higher aggregate weight than 1.72.
c. The ranges used to weight formula child counts were updated based on the distribution of formula children among all LEAs according to the latest data available in 2001.
d. Prior to NCLB, Puerto Rico's formula child count was weighted using an aggregate weight of 1.72. This was increased to 1.82 to reflect Puerto Rico's share of grants under the Basic Grant and Concentration Grant formulas for FY2001.
|
ESEA Legislation |
Formula Child Count |
Formula Child Eligibility Threshold for LEAs |
Weighting of Formula Child Count and Rate |
Expenditure Factor |
Additional Formula Factors |
Minimum State Grant |
LEA Hold Harmless |
Stages in the Grant Calculation Process |
|
Improving America's Schools Act (IASA; 1994) |
Total school-age population ages 5-17. |
Had to receive funds under Basic Grants, Concentration Grants, and/or Targeted Grants. |
For allocation of funds within states only, formula children were assigned weights on the basis of each LEA's number of formula children and formula child rate. |
None. |
State effort and equity factors were applied in the calculation of state total grants.a |
0.25% of total state grants. |
None. |
Grants were first calculated for states overall, then state total grants were suballocated to LEAs in a given state in proportion to total LEA grants under the other Title I-A formulas. |
|
No Child Left Behind Act of 2001 (NCLB; 2002) |
Children ages 5-17 (1) in families with income below the federal poverty threshold (based on Census Bureau Small Area Income and Poverty Estimates (SAIPE) data); (2) in institutions for neglected or delinquent children or in foster homes; and (3) in families receiving Temporary Assistance for Needy Families (TANF) payments above the poverty income level for a family of four. |
10 or more formula children and a formula child rate of 5% or more. |
Same as prior provisions.b |
State average per pupil expenditure (APPE) for public K-12 education, subject to a minimum of 85% and maximum of 115% of the national APPE, further multiplied by 0.40. |
Same as prior provisions. |
Up to 0.35% of total state grants, subject to a cap. |
85%-95% of the previous-year grant, depending on the LEA's formula child rate, applicable only to LEAs meeting the formula's eligibility thresholds. |
Grants were first calculated for states overall, then state total grants were suballocated to LEAs in a given state based on each LEA's proportional share of a weighted formula child count. |
|
Every Student Succeeds Act (ESSA; 2015) |
Same as prior provisions. |
Same as prior provisions. |
Same as prior provisions. |
Same as prior provisions. |
Same as prior provisions. |
Same as prior provisions. |
Same as prior provisions. |
Same as prior provisions. |
Source: Table prepared by the Congressional Research Service based on CRS review of the Elementary and Secondary Education Act (ESEA) as originally enacted and subsequent amendments to the act.
Notes: The EFIG formula was initially authorized in FY1996. However, no funds were appropriated for the formula until FY2002, after the No Child Left Behind Act of 2001 (NCLB) made substantial changes to it.
a. The effort factor is calculated based on (1) the ratio of the three-year average APPE for public elementary and secondary education to the three-year average state per capita income (PCI) divided by (2) the ratio of the three-year average national APPE to the three-year average national PCI. The equity factor is determined based on variations in APPE among the LEAs in each state. At the LEA level, a state's equity factor determines which of three sets of weights are used to determine an LEA's weighted formula child count.
b. The ranges used to weight formula child counts were updated based on the distribution of formula children among all LEAs according to the latest data available in 2001.
|
ESEA Legislation |
Outlying Areas and Bureau of Indian Affairs/Education (referred to as the BIE) |
Treatment of Puerto Rico |
Allocation of Grants to Schools |
Operation of Schoolwide Programs |
State Reservation for Administration |
Applicable Fiscal Accountability Requirements |
Other Provisions of Note |
|
ESEA as originally enacted (1965) |
Funds were provided to the Outlying Areas via a reservation of up to 2% of the total appropriations for Basic Grants for Puerto Rico and the Outlying Areas; no funds were provided to the BIE. |
Funds provided to Puerto Rico via a reservation of up to 2% of the total appropriations for Basic Grants for Puerto Rico and the Outlying Areas. |
Schools in areas with high concentrations of children from low-income families were eligible to receive Title I-A funds. |
None. |
1% of grant allocation for administration, technical assistance, and evaluation. |
Maintenance of effort (MOE).a |
None. |
|
Amendments to P.L. 81-815 and P.L. 81-874 (1965) |
Same as prior provisions. |
Same as prior provisions. |
Same as prior provisions. |
None. |
Greater of (1) 1% of the total Basic Grant amounts paid to all LEAs in the state or (2) $75,000. |
Same as prior provisions. |
None. |
|
ESEA Amendments of 1966 (1966) |
Funds were provided to the Outlying Areas and the BIE via a reservation of up to 2% of the total appropriations for Basic Grants for Puerto Rico, the Outlying Areas, and the BIE. |
Funds provided to Puerto Rico via a reservation of up to 2% of the total appropriations for Basic Grants for Puerto Rico, the Outlying Areas, and the BIE. |
Same as prior provisions except that Title I-A programs in schools were required to involve expenditures of at least $2,500. |
None. |
Greater of (1) 1% of the total Basic Grant amounts allocated to all LEAs in the state and funds provided to states under other programs included in Title I-Ab or (2) $75,000. |
Same as prior provisions. |
None. |
|
ESEA Amendments of 1967 (1968) |
Same as prior provisions. |
Same as prior provisions. |
Same as prior provisions. |
None. |
Same as prior provisions. |
Same as prior provisions. |
If appropriations were below the full funding levels for the SEA programs authorized under Title I,b then these programs had to be fully funded by reducing the appropriation level for the Basic Grant program. |
|
ESEA Amendments of 1969 (1970) |
Same as prior provisions. |
Same as prior provisions. |
Same as prior provisions. |
None. |
Same as prior provisions. |
MOE; supplement, not supplant (SNS),c and comparability. |
Same as prior provisions. |
|
Education Amendments of 1974 (1974) |
Funds were provided to the Outlying Areas and the BIE via a reservation of up to 1% of the total appropriations for Basic Grants. |
Under Basic Grants, Puerto Rico was treated as an LEA and state for the purposes of grant determination. However, unlike the 50 states and the District of Columbia, no lower bound was applied to Puerto Rico's expenditure factor.d |
Schools in areas where high concentrations of children from low-income families resided and schools with a high concentration of students in average daily attendance from low-income families were eligible for Title I-A funds for a three-year period. In addition, up to 20 LEAs could be given approval by the Commissioner of Education each year to test new methods for the selection of Title I-A schools. |
None. |
Greater of (1) 1% of total Title I funds or (2) $150,000. |
Same as prior provisions. |
Same as prior provisions. |
|
Education Amendments of 1978 (1978) |
Same as prior provisions. |
Puerto Rico was treated as an LEA and state for the purposes of grant determination under Basic Grants, Special Incentive Grants, and Special Grants. A ceiling of 150% of its prior year Title I-A grant was placed on Puerto Rico's Title I-A grant amount. Additionally, a change was made to the Basic Grant expenditure factor calculations for Puerto Rico that essentially increased its expenditure factor, thus increasing its Basic Grant amount. |
LEAs were permitted to allocate funds to schools with a high incidence of educational deprivation in addition to schools with concentrations of children from low-income families. If LEA grants were insufficient to provide funding to all eligible schools, the LEA ranked its schools by the concentration of children from low-income families and served schools in rank order. In addition, schools could automatically qualify for Title I-A funds if the percentage of students from low-income families was at least 25%.e |
Schools with a percentage of children from low-income families of 75% or higher could operate a schoolwide program. |
Greater of (1) 1.5% of total Title I funds or (2) $225,000. |
Same as prior provisions.f |
Same as prior provisions. |
|
Education Consolidation and Improvement Act (ECIA; 1981) |
Same as prior provisions. |
Same as prior provisions. |
Same as prior provisions. |
Eliminated schoolwide program option. |
Greater of (1) 1% of total Title I funds or (2) $225,000. |
Same as prior provisions.g |
Same as prior provisions. |
|
ECIA Technical Amendments (1983) |
Same as prior provisions. |
Same as prior provisions. |
Same as prior provisions. |
Schools with a percentage of children from low-income families of 75% or higher could operate a schoolwide program. |
Same as prior provisions. |
Same as prior provisions.h |
Same as prior provisions. |
|
Augustus F. Hawkins-Robert T. Stafford Elementary and Secondary School Improvement Amendments of 1988 (1988) |
Same as prior provisions except the Secretary was required to additionally reserve funds for competitive grants to the Outlying Areas, the Marshall Islands, Micronesia, and Palau. The reservation amount was based on the funds received by the Marshall Islands and Micronesia for FY1989. |
Puerto Rico was treated as an LEA and state for grant determinations except that a cap was placed on its expenditure factor. |
Same as prior provisions. |
Same as prior provisions. |
Greater of (1) 1.0% of total Title I funds or (2) $325,000. |
Same as prior provisions.i |
Same as prior provisions. |
|
Improving America's Schools Act (IASA; 1994) |
Funds were provided to the Outlying Areas and the BIE via a reservation of 1% of total Title I-A appropriations. From the funds reserved for the BIE and Outlying Areas, up to $5 million was reserved for competitive grants to the Marshall Islands, Micronesia, and Palau.j |
Puerto Rico was treated as an LEA and state for grant determinations under all four Title I-A formulas. The expenditure factor for Puerto Rico under Basic Grants and Targeted Grants was capped. Under Targeted Grants all formula children received a weight of 1.72. |
Schools could be automatically qualified to participate in Title I-A if their percentage of students from low-income families was at least 35%. All schools with high (over 75%) rates of children from low-income families had to be served prior to serving schools in rank order by specific grade levels. |
Schools with a percentage of children from low-income families of 50% or higher could operate a schoolwide program. |
Same as prior provisions. |
Same as prior provisions.k |
None. |
|
No Child Left Behind Act of 2001 (NCLB; 2002) |
Grants to schools operated or supported by the BIE and Outlying Areas were provided via a reservation of 1% of total Title I-A appropriations. From the funds reserved for the BIE and Outlying Areas, up to $5 million was reserved for competitive grants to the Outlying Areas and Palau. |
Same as prior provisions except the cap on Puerto Rico's expenditure factor was slightly increased and was applied to Concentration Grants and EFIG in addition to Basic Grants and Targeted Grants. Under Targeted Grants all formula children received a weight of 1.82. |
Same as prior provisions. |
Schools with a percentage of children from low-income families of 40% or higher could operate a schoolwide program. |
Greater of (1) 1% of state total allocations under all formulas for ESEA Title I-A, plus funds allocated under the Migrant Education Program (Title I-C) and the Prevention and Intervention Programs for Children and Youth Who Are Neglected, Delinquent, or At-Risk (Title I-D), or (2) $400,000.l |
Same as prior provisions. |
None. |
|
Every Student Succeeds Act (ESSA; 2015) |
Beginning in FY2017, 0.7% of total Title I-A appropriations are reserved for the BIE and 0.4% of total Title I-A appropriations are reserved for the Outlying Areas provided the total amount of remaining funds available to make grants to states is at least as much as the total amount of funds available to make grants to states in FY2016. If appropriations are insufficient to meet this requirement the reservation of funds for the BIE and Outlying Areas is implemented as required by law prior to the enactment of ESSA. |
Same as prior provisions. |
Same as prior provisions except that states may choose to serve high schools with more than 50% of their children from low-income families before choosing to serve schools in rank order by specific grade levels. |
Same as prior provisions. |
Same as prior provisions. |
Same as prior provisions.m |
None. |
Source: Table prepared by the Congressional Research Service (CRS) based on CRS review of the Elementary and Secondary Education Act (ESEA) as originally enacted and subsequent amendments to the act.
Notes: The Education Amendments of 1972 and the Education Amendments of 1984 did not make substantial changes to the Title I-A formulas; thus these reauthorizations are not included in the table.
a. LEAs receiving Title I funds were required to provide from state and local sources, a level of funding for public elementary and secondary education for the preceding fiscal year that was at least as much as was provided in the second preceding year.
b. The other programs authorized under Title I-A included an SEA program for children with disabilities, an SEA program for migrant children, and an SEA program for neglected and delinquent children.
d. Puerto Rico did not receive funds under Special Incentive Grants or Special Grants.
e. Prior to the 1978 amendments, HEW regulations stipulated that schools could be automatically qualified to participate in Title I-A if their percentage of students from low-income families was at least 30% (45 C.F.R. §116a.20(b)(2)).
f. The amendments also required a study of alternatives to LEA compliance with comparability requirements.
g. LEAs receiving Title I funds were required to provide from state and local sources, a level of funding for public elementary and secondary education for the preceding fiscal year that was at least 90% of what was provided in the second preceding year. In addition, a new requirement was added that an LEA would be deemed to have met the comparability requirement if the LEA had a districtwide salary schedule; a policy to ensure equivalence among schools in teachers, administration, and auxiliary personnel; and a policy to ensure equivalence among schools in the provision of curricular materials and instructional supplies. Subsequently, in 1982 ED scaled back the comparability regulations, including removing provisions related to the exclusions of salary differentials based on years of employment and the definition of eligible personnel (45 C.F.R. §200.63), and stated that states were free to develop their own methods of meeting the law and regulations (U.S. Department of Education, "Chapter 1 of the Education Consolidation and Improvement Act of 1981; Financial Assistance to Local Educational Agencies to Meet Special Educational Needs of Disadvantaged Children," 47 Federal Register 52342, November 19, 1982).
h. Extended SNS requirements to apply to SEAs and other state agencies.
i. Additional changes were made to comparability requirements. For example, comparability no longer had to be determined by LEAs with only one school at each grade level.
j. This competitive grant program is known as the Territories and Freely Associated States Education Grant program. It is also commonly referred to as the PREL grant.
k. With respect to comparability, the IASA stipulated that documentation need only be updated biennially and "Title I-like funds" could only be excluded from comparability calculations if the funds were spent in Title I eligible areas. Additionally, a provision to exclude salary differentials based on years of employment (commonly referred to as longevity pay) from the determination of comparability was re-added to the statute. This provision had been removed from both statute and regulations in the 1980s when the comparability requirements were changed to stipulate that LEAs had to provide an assurance of comparability to states as opposed to demonstrating comparability using data.
l. If total appropriations for ESEA Title I, Parts A, C, and D exceed $14 billion, then state administration reservations are capped at the level that would pertain if the total appropriations for these programs were $14 billion. This limit was applicable for the first time in FY2008.
m. The ESSA modified both MOE and SNS requirements applicable to all Title I-A formulas. For more information, see CRS In Focus IF10405, Fiscal Accountability Requirements That Apply to Title I-A of the Elementary and Secondary Education Act (ESEA), by Rebecca R. Skinner.
Appendix C. Selected Acronyms Used in This Report
AFDC: Aid to Families with Dependent Children
APPE: Average per pupil expenditures
ARRA: American Recovery and Reinvestment Act
BIA: Bureau of Indian Affairs
BIE: Bureau of Indian Education
CV: Coefficient of variation
ECIA: Education Consolidation and Improvement Act
ED: U.S. Department of Education
EFIG: Education Finance Incentive Grants
ELLs: English language learners
ESEA: Elementary and Secondary Education Act
ESSA: Every Student Succeeds Act
GEPA: General Education Provisions Act
HEW: Department of Health, Education, and Welfare
IASA: Improving America's Schools Act
IDEA: Individuals with Disabilities Education Act
LEA: Local educational agency
MOE: Maintenance of effort
NAEP: National Assessment of Educational Progress
NCLB: No Child Left Behind Act
NDEA: National Defense Education Act
NIE: National Institute of Education
PCI: Per capita income
SAIPE: Small Area Income and Poverty Estimates
SEA: State educational agency
SIE: Survey of Income and Education
SNS: Supplement, not supplant
TANF: Temporary Assistance to Needy Families