Research and development (R&D) plays a central role in advanced economies in areas such as economic growth and job creation, industrial competitiveness, national security, energy, agriculture, transportation, public health and well-being, environmental protection, and expanding the frontiers of human knowledge understanding.1 Accordingly, companies, governments, universities, nonprofit organizations, and others around the world have made substantial investments in R&D. Since 2000, total global R&D expenditures have more than doubled.
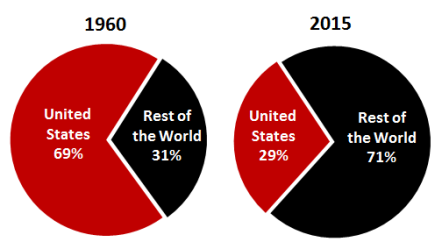
The United States emerged as a global leader in science and technology in the second half of the 20th century. During this period, U.S. public and private investments in R&D grew rapidly and helped to propel the United States to a position of global economic leadership. By 1960, the United States accounted for approximately 69% of the world's R&D funding. By 2015, however, the U.S. share of global R&D expenditures2 had fallen to about 29%. (See Figure 1.)3 The U.S. decline in share of global R&D resulted not from a reduction in U.S. R&D investments—in fact, U.S. public and private R&D grew robustly during this period—but rather from even greater increases in the investments of the governments and industries of other countries, which recognized the importance of R&D to their industrial innovation and competitiveness.
 |
|
Sources: 1960: CRS analysis of U.S. Department of Commerce, Office of Technology Policy, The Global Context for U.S. Technology Policy, Summer 1997; 2015: CRS analysis of Organization for Economic Cooperation and Development (OECD) data, Main Science and Technology Indicators, OECD.Stat. Notes: Rest of the World includes the members of the OECD (less the United States), Argentina, China, Romania, Russia, Singapore, South Africa, and Taiwan. R&D expenditures by others countries are not included but are likely to be small in relative terms. CRS has estimated R&D expenditures for seven countries (Australia, Canada, Ireland, New Zealand, Switzerland, Turkey, and Argentina) not reporting data for 2015 based on recent growth rates. |
In 2015 (the most recent year for which comprehensive data are available), global R&D expenditures were $1.750 trillion. The United States continued to fund more R&D than any other country. China, ranked second in 2015, funded more R&D than the next three highest countries—Japan, Germany, and South Korea—combined. The 10 largest R&D-funding countries of 2015 accounted for $1.480 trillion in R&D expenditures, about 84.6% of the global total. (See Table 1.)
|
Rank |
Country |
Amount |
Rank |
Country |
Amount |
||||||
|
1 |
United States |
|
|
6 |
France |
|
|||||
|
2 |
China |
|
|
7 |
United Kingdom |
|
|||||
|
3 |
Japan |
|
|
8 |
Russia |
|
|||||
|
4 |
Germany |
|
|
9 |
Taiwan |
|
|||||
|
5 |
South Korea |
|
|
10 |
Italy |
|
Source: CRS analysis of Organization for Economic Development and Cooperation, OECD.Stat database, https://stats.oecd.org/Index.aspx?DataSetCode=MSTI_PUB.
Notes: PPP = Purchasing Power Parity. PPP is used to determine the relative value of different currencies and to adjust data from different countries to a common currency allowing direct comparisons among them.
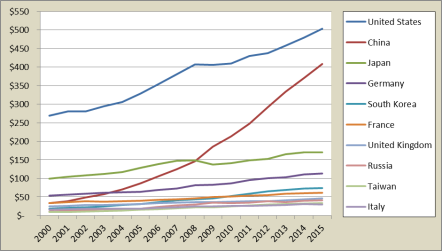
Figure 2 illustrates R&D expenditures between 2000 and 2015 for the 10 countries with the highest R&D expenditures.
|
Figure 2. R&D Expenditures of Selected Countries, 2000-2015 (in billions of current PPP dollars) |
 |
|
Source: CRS analysis of Organization for Economic Cooperation and Development, OECD.Stat database, https://stats.oecd.org/Index.aspx?DataSetCode=MSTI_PUB. Notes: PPP = Purchasing Power Parity. PPP is used to determine the relative value of different currencies and to adjust data from different countries to a common currency allowing direct comparisons among them. |
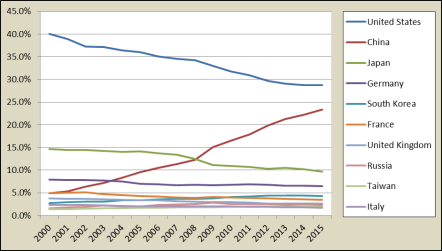
Trends in global R&D share between 2000 and 2015 for the 10 countries with the highest 2015 R&D expenditures are illustrated in Figure 3. Among them, six saw declines in share of global R&D—the United States, Japan, Germany, France, the United Kingdom, and Italy—while four saw their shares grow—China, South Korea, Russia, and Taiwan.
In 2000, China accounted for nearly 5% of global R&D, joining the United States, Japan, South Korea, and the countries of Western Europe as the largest funders of R&D. In 2009, China surpassed Japan to become the second largest funder of R&D. From 2000 to 2015, while China's share of global R&D rose from 4.9% to 23.4%, the U.S. share fell from 40.0% to 28.8% and Japan's share fell from 14.7% to 9.7%.
|
Figure 3. Share of Global R&D of Selected Countries, 2000-2015 |
 |
|
Source: CRS analysis of Organization for Economic Development and Cooperation, OECD.Stat database, https://stats.oecd.org/Index.aspx?DataSetCode=MSTI_PUB. Notes: Global R&D includes the expenditures of the OECD countries, Argentina, China, Romania, Russia, Singapore, South Africa, and Taiwan. Share computed in PPP terms. PPP = Purchasing Power Parity. PPP is used to determine the relative value of different currencies and to adjust data from different countries to a common currency allowing direct comparisons among them. |
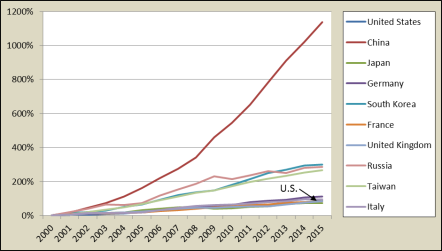
Figure 4 illustrates the growth of R&D expenditures for the 10 countries with the highest 2015 R&D expenditures from their 2000 R&D expenditure levels through 2015.
|
Figure 4. Growth in R&D Expenditures Since 2000 for Selected Countries, 2000-2015 |
 |
|
Source: CRS analysis of Organization for Economic Development and Cooperation, OECD.Stat database, https://stats.oecd.org/Index.aspx?DataSetCode=MSTI_PUB. |