Introduction
A number of states and local governments have taken actions to address greenhouse gas (GHG) emissions. These efforts cover a wide spectrum, from developing climate action plans to setting mandatory GHG emission standards. For example, California is implementing regulations that address GHG emissions on multiple fronts, including a cap-and-trade program that began in January 2013.1
One of the most significant climate change developments at the state level is the Regional Greenhouse Gas Initiative (RGGI, pronounced "Reggie"), which is based on an agreement signed by RGGI governors in 2005.2 RGGI is the nation's first mandatory cap-and-trade program for GHG emissions, which went into effect January 1, 2009 (see text box, "What Is a Cap-and-Trade System?").3 RGGI currently involves nine states—Connecticut, Delaware, Maine, Maryland,4 Massachusetts,5 New Hampshire, New York, Rhode Island, and Vermont.6
The results of the RGGI program may be informative to policymakers, because RGGI may serve as a possible test case for a federal cap-and-trade program, providing insights into implementation complexities, the mechanics of various design elements, and lessons of potential design pitfalls. Several of RGGI's design elements generated considerable interest during the development and debate of federal proposals to address GHG emissions.7
The first section of this report provides an overview of the RGGI cap-and-trade program and the participating RGGI states. The subsequent sections discuss selected issues raised by RGGI that may be of interest to Congress. The final section provides some final observations that may be instructive to policymakers.
|
What Is a Cap-and-Trade System? A GHG cap-and-trade system creates an overall limit (i.e., a cap) on GHG emissions from the emission sources covered by the program. Cap-and-trade programs can vary by the sources covered. The covered sources, also referred to as covered or regulated entities, often include major emitting sectors (e.g., power plants and carbon-intensive industries), fuel producers/processors (e.g., coal mines or petroleum refineries), or some combination of both. The emissions cap is partitioned into emission allowances. Typically, in a GHG cap-and-trade system, one emission allowance represents the authority to emit one (metric) ton of carbon dioxide-equivalent (tCO2-e). This term of measure is used because GHGs vary by global warming potential (GWP)—an index of how much a GHG may contribute to global warming over a period of time, typically 100 years. GWPs are used to compare gases to CO2, which has a GWP of 1. For example, methane's GWP is estimated between 28 and 36, because 1 ton of methane is 28-36 times more potent than 1 ton of CO2 over a 100-year period.8 Under an emissions cap, covered entities with relatively low emission-reduction costs have a financial incentive to make reductions beyond what is required, because these further reductions could be sold (i.e., traded) as emission credits to entities that face higher costs to reduce their facility emissions. At the end of each established compliance period (e.g., a calendar year or multiple years), covered sources surrender emission allowances to an implementing agency to cover the number of tons emitted. If a source did not provide enough allowances to cover its emissions, the source would be subject to penalties. Other mechanisms, such as banking or offsets, may be included to increase the flexibility of the program. The emissions cap creates a new currency—the emission allowance. Policymakers may decide to distribute the emission allowances to covered entities at no cost (based on, for example, previous years' emissions), sell the allowances (e.g., through an auction), or use some combination of these strategies. The distribution of emission allowance value is typically a source of significant debate during a cap-and-trade program's development. A cap-and-trade program is one policy tool for reducing GHG emissions. It is often described as a market-based mechanism because, like an emissions fee or carbon tax, it allows the marketplace to determine the economically efficient solution for GHG emission reduction. Compared to more traditional approaches—for example, requiring specific performance standards or technologies at particular facilities—market-based mechanisms are generally considered more cost effective. Perhaps the most successful market-based program in the environmental policy arena is the sulfur dioxide emissions trading system (known as the Acid Rain Program) established by the 1990 amendments to the Clean Air Act. |
RGGI Overview
RGGI is a sector-specific cap-and-trade system that applies to CO2 emissions from electric power plants9 with capacities to generate 25 megawatts or more10—164 facilities in the nine RGGI states.11 RGGI's history began with discussions and meetings that date back to at least 2003. These activities eventually led to a 2005 Memorandum of Understanding (MOU)12 that outlined the basic framework of the program.13 In 2008, the RGGI states issued a model rule of cap-and-trade regulations that participating states could use to establish and implement their programs.14
RGGI designers expected the initial program to be a foundation for emissions trading and possibly expanded in future years by covering other emission sources/sectors, GHGs, or states. The CO2 emissions from covered entities in the RGGI states account for approximately 20% of all GHG emissions in the RGGI states.15 The vast majority of the remaining GHG emissions come from fossil fuel combustion in the industrial, commercial, residential, and transportation sectors.
Pursuant to RGGI's 2005 MOU, the RGGI states conducted a substantial design review of the program (between 2010 and 2012), which resulted in significant changes to the emissions cap and other cap-related design elements.16 These changes took effect in 2014 and are discussed below. The RGGI states initiated a second design review in 2015. This process is ongoing.17
RGGI's cap-and-trade program includes many of the design elements that were proposed and debated in federal legislative proposals. Highlights include the following:
- Three-year compliance periods. At the end of a compliance period, covered entities submit one emission allowance for each ton of CO2 emissions generated. A three-year compliance period should mitigate potential emission allowance price swings brought on by short-term market volatility.
- Emission allowance banking. RGGI allows covered entities to bank an unlimited number of emission allowances for future use. The opportunity to bank emission allowances instills a substantial amount of flexibility into a trading program, effectively making annual emissions caps flexible over time, and reduces the absolute cost of compliance.
- Emission allowance auctions. With some variance among the states, particularly in the early years, a substantial percentage (91%) of emission allowances have been distributed through quarterly auctions (discussed below). The auctions include a reserve price, which sets a price floor for emission allowances.
- Consumer benefit allocation. RGGI states agreed that at least 25% of the emission allowance value would be distributed "for a consumer benefit or strategic energy purpose."18 Allowance value distributions from RGGI states have far exceeded this minimum requirement (discussed below).
- Cost containment. In 2014, RGGI states established a "cost containment reserve" (CCR),19 which provides additional allowances to be sold at auction if certain price thresholds are met.
- Offsets use. An offset is a measurable reduction, avoidance, or sequestration of GHG emissions from a source not covered by an emission reduction program. To a limited degree (discussed below), covered entities may submit offsets in lieu of the emission allowances needed to satisfy compliance obligations.
Emissions Cap
Although RGGI is one of the more aggressive state programs addressing GHG emissions, the program's first emission cap exceeded actual emissions since its inception in 2009. As discussed below, this result was unintentional. The first cap never compelled regulated entities to make internal emission reductions or purchase emission credits (or offsets).
After the program review in 2012, RGGI states lowered the emissions cap by 45%. This change took effect in January 2014. This section includes a discussion of both the initial emissions cap and the revised emissions cap.
First Emissions Cap: 2009-2013
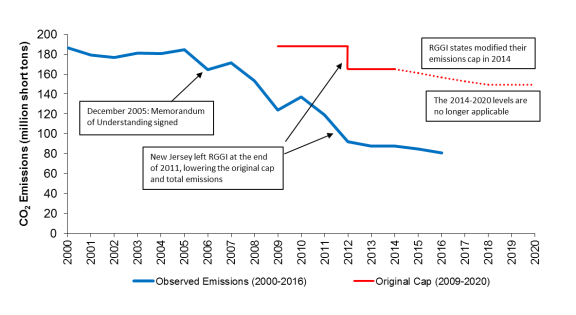
The initial objective of the first emissions cap was to stabilize CO2 emissions for several years (2009-2014) at the expected 2009 levels (based on assumptions made in 2005) and then require gradual reductions, achieving a 10% decrease from the 2009 emission cap level by 2019. During the emissions cap construction in 2005,20 RGGI designers set the 2009 emissions cap about 4% above the average emission levels observed between 2000 and 2002. RGGI designers anticipated that power plant CO2 emissions would gradually increase so that actual levels would approximately match the cap set for 2009—188 million short tons of CO2 (mtCO2). As illustrated in Figure 1, actual emissions did not meet these projections but decreased substantially.
|
Figure 1. Observed Emissions Compared to the Original Emissions Cap |
 |
|
Source: Prepared by CRS; observed state emission data (2000-2016) provided by RGGI at http://www.rggi.org. |
RGGI Emissions and Electricity Generation
Several studies indicated that the RGGI CO2 emission decreases were due (to some degree) to long-term structural changes, such as changes in RGGI's electricity generation portfolio and energy efficiency improvements.21 A comparison between the emission decline and electricity use in the RGGI states supports this notion.
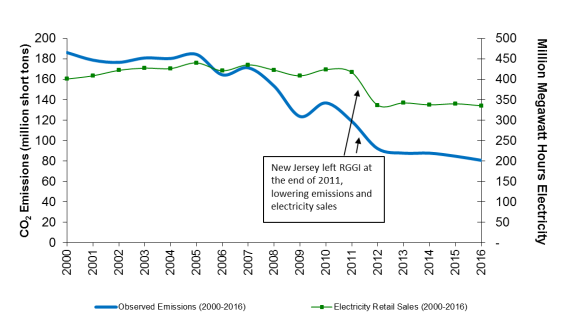
As Figure 2 indicates, RGGI electricity retail sales (a proxy for electricity use) decreased by 5% between 2005 and 2011, while CO2 emissions from in-state electricity generation decreased by 36% during the same period. This disparity suggests that factors other than temporal economic conditions were the primary influence for the CO2 emissions decrease.
A comparison of more recent years indicates that, between 2012 and 2016, CO2 emissions from in-state electricity generation decreased by 12%, while electricity retail sales remained flat, decreasing by less than 1%.22
|
Figure 2. RGGI Emissions Compared with Electricity Sales 2000-2016 |
 |
|
Source: Prepared by CRS; observed state emission data (2000-2016) provided by RGGI at http://www.rggi.org; electricity sales from Energy Information Administration, Electricity Data Browser, https://www.eia.gov/electricity/data/browser/. |
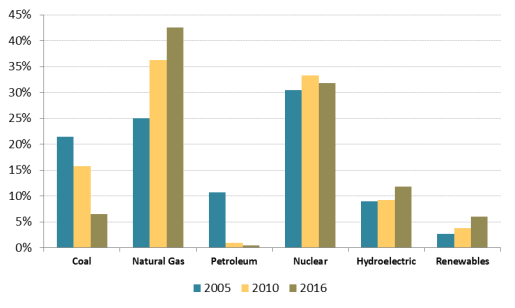
Figure 3 compares RGGI's electricity generation portfolio between 2005, 2010, and 2016. The figure depicts a substantial decline in carbon-intensive electricity generation, particularly coal, over that time frame. Electricity is generated from a variety of energy sources, which vary significantly by their ratio of CO2 emissions per unit of energy. For example, a coal-fired power plant emits almost twice as much CO2 (per unit of energy) as a natural-gas-fired facility.23 Some energy sources (e.g., hydropower, nuclear, wind, or solar) are generally considered to be zero-emission sources. In 2005, RGGI states generated 33% of their electricity from coal and petroleum, sources of energy with relatively high carbon intensity. In 2016, these sources generated 7% of RGGI's electricity. During that time, sources with relatively lower (or zero) carbon intensities—natural gas, nuclear, and renewables—increased their contributions to RGGI's electricity portfolio. In particular, electricity generation from natural gas increased from 25% to 43% over that time frame.
Impacts of the Original Emissions Cap
Although RGGI's original emission cap did not directly require emission reductions (due to unexpected emission levels, discussed above), the cap, and the overall RGGI program, still had impacts. First, the cap's existence attached a price to the regulated entities' CO2 emissions. The price was relatively low (as discussed below), because of the abundance of emission allowances.
A 2010 analysis of the RGGI program found that the emission allowance price accounted for approximately 3% of the change in the price difference between natural gas and coal in the RGGI region between 2005 and 2009.24 Another study found that the RGGI program as a whole (i.e., the allowance price, distribution of allowance value, and related complementary effects) was the dominant factor in the emissions decrease.25
Second, the cap's emission allowances were a new form of currency. The emission allowance value can be used to support various policy objectives, including (as is the case with RGGI) energy efficiency and renewable energy investments. Some would argue that RGGI's greatest impact—particularly under the original emission cap—was to provide a relatively reliable funding source for such efforts.
Several RGGI studies indicate that supporting energy efficiency provides multiple benefits: emission reduction, consumer savings via lower electricity bills, and regional job creation.26 One of these studies argues this allowance value distribution strategy (e.g., use of RGGI auction revenue) "creates wider benefit than any other use of allowance value."27 As discussed below, such efforts play a role in determining the effectiveness of the program.
In addition, a 2017 study examined the public health impacts of the first six years of the RGGI program (2009-2014).28 The study concluded that the RGGI program's air quality improvements led to public health benefits, including the avoidance of premature deaths and illness.29 The study estimated the cumulative economic value of the health benefits at $5.7 billion.30
Revised Emissions Cap (2014-2020)
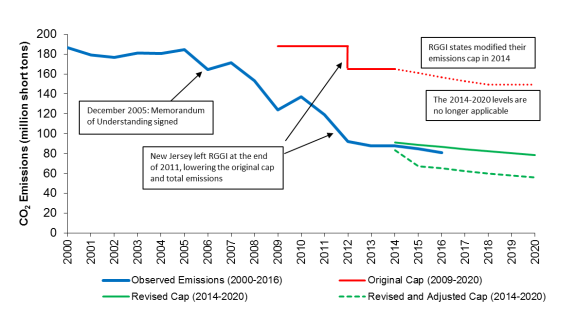
Following a 2012 design review of the RGGI program,31 the RGGI states amended the RGGI model rule (in February 2013) to substantially reduce the emissions cap from 165 mtCO2 to 91 mtCO2. RGGI designers based the new cap level on their projection of 2012 emissions. The emission projection turned out to be fairly accurate, as actual 2012 emissions were 92 mtCO2.
The revised cap took effect in January 2014. The emissions cap will decrease each year by 2.5% between 2015 and 2020. RGGI states have not established a cap beyond 2020.
In addition, RGGI states decided to adjust the new cap further to account for the substantial amount of banked emission allowances held by RGGI entities between 2009 and 2013.32 In 2014, RGGI designers determined that these banked emissions accounted for 140 mtCO2, a considerable amount when compared to the 91 mtCO2 emission cap of 2014. Thus, the cap adjustments, which are applied each year between 2014 and 2020, are considerable. In some years, the adjustments lower the cap more than 20 mtCO2, equating to 28% decrease.
Figure 4 illustrates (1) the observed emissions between 2000 and 2016; (2) the original emissions cap (2009-2020); and (3) the revised emissions cap (2014-2020), which includes the 2014 adjustments. The figure indicates that the revised (and adjusted) emissions cap will likely have a different impact on the RGGI states than the original emissions cap. For example, the more stringent cap led to substantially higher emission allowance prices. As discussed below, however, these prices have declined in recent months.
As mentioned above, RGGI entities banked a considerable number of emission allowances during the original emissions cap. This allows for the 2015 emissions to be higher than the revised emissions cap, as illustrated in Figure 4.
|
Figure 4. Observed Emissions Compared to the Original and Revised Emission Cap |
 |
|
Source: Prepared by CRS; observed state emission data (2000-2016) provided by RGGI at http://www.rggi.org and revised emission cap data from RGGI at http://www.rggi.org/design/overview/cap. Notes: RGGI entities banked a considerable number of emission allowances during the original emissions cap (2009-2013). This allows for the 2014-2016 emissions to be higher than the revised and adjusted emissions cap. |
Emission Allowance Value
One of the more controversial and challenging questions for policymakers when designing a cap-and-trade program is how, to whom, and for what purpose to distribute the emission allowances. In general, RGGI states have answered the "how" question by employing auctions to distribute the vast majority of allowances.33 Perhaps the more important question for policymakers is what to do with the emission allowance value: In the case of RGGI, allowance value predominately means auction revenues.
Allowance value includes revenues generated through allowance auctions or by giving the allowances away at no charge to either covered or noncovered entities. A covered entity recipient could use the allowances for compliance purposes, sell the allowances in the marketplace (e.g., to other covered entities), or bank the allowances for future use. To realize the value of allowances received, a noncovered entity recipient would need to sell the allowances in the marketplace, either through a broker or directly to a covered entity.
Allowance Auctions
As a group, the RGGI states have offered 91% of their budgeted emission allowances at auction between 2008 and 2016. Some of the offered allowances were not sold and were subsequently retired. Other allowances were sold at fixed prices or distributed to various entities to support a variety of objectives.34
RGGI's auctions may be of particular interest to Congress, because this approach was part of several proposed cap-and-trade systems from former Congresses. Each RGGI auction is conducted in one round with a sealed-bid, uniform-price format.35 Participants may submit multiple, confidential bids for a certain number of allowances at a specific price. The price paid by all bidders is the highest rejected bid (i.e., the second-highest bid). For example, consider a hypothetical auction in which the supply of allowances is 20 units. The highest bidder offers $10 per allowance for 15 allowances. The second-highest bidder offered $9 per allowance for 10 allowances. Under RGGI's auction structure, the highest bidder would receive 15 allowances at $9 per allowance, and the second-highest bidder would receive 5 allowances at $9 per allowance. The price paid by all successful bidders is known as the clearing price—$9 per allowance in this example.
In addition, RGGI auctions include a reserve price, below which the seller refuses to part with the item for sale (i.e., emission allowance). The reserve price started at $1.86 in 2008, increasing to $2.15 in 2017.36 In a large-volume, multi-unit auction that is expected to have substantial participation (i.e., high demand for emission allowances), a reserve price would all but guarantee a revenue stream. A reserve price may address certain logistical concerns, such as bidder collusion, that may be associated with auctions. In addition, a reserve price may provide assurance to parties making emission reductions that the reductions will have a minimal value in the allowance market.
The RGGI program has held 35 auctions as of the date of this report. In general, many have viewed the auctions as successful in terms of price discovery,37 transparency, transaction costs, and other logistical issues.
Another typical measure of auction success is revenue generation. After 35 auctions, the cumulative proceeds total over $2.7 billion (including proceeds from New Jersey's allowances and proceeds from the cost containment reserve).
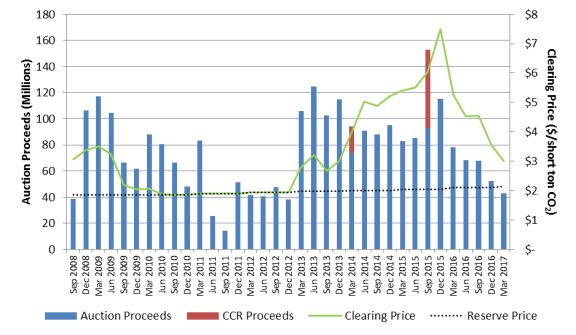
Figure 5 illustrates the auctions' results. As the figure indicates, the clearing price equaled the reserve price in auctions conducted between June 2010 and December 2012, reflecting the abundance of emission allowances in the market. Moreover, during this time period, approximately 40% of the allowances offered for sale were not purchased. RGGI states retired the vast majority of these unsold allowances.38 During this period, the reserve price ($1.86-$1.93 per ton) acted like an emissions fee or carbon tax.39
However, in 2013, the auction results changed dramatically, most likely reflecting upcoming changes in the RGGI program. Following the February 2013 proposal to substantially reduce the emissions cap in 2014, the clearing prices began to exceed the reserve prices (Figure 5). The clearing price in the December 2015 auction reached $7.50, an almost four-fold increase compared to 2012 prices. However, since that time, the auction clearing prices have decreased substantially. In the March 2017 auction, the clearing price dropped to $3.00. Although the prices have dropped dramatically over the past 18 months, all of the allowances offered at auction have sold.
Figure 5 also indicates the proceeds generated from the cost containment reserve (CCR) allowances. The CCR was added to RGGI in 2014 and is discussed below (see "Cost Containment" section). To date, the CCR has been triggered twice: in the March 2014 and September 2015 auctions.
|
Figure 5. RGGI Auctions Proceeds and Clearing Prices 2008-2017 |
 |
|
Source: Prepared by CRS; data from RGGI at http://rggi.org/market/co2_auctions/results. Note: The reserve price has risen from $1.86 in 2008 to $2.15 in 2017. |
Allowance Value Distribution
When deciding to whom or for what purpose to distribute the emission allowance value, policymakers face trade-offs that could have considerable consequences.40 In both RGGI's 2005 MOU and subsequent model rule,41 states agreed that at least 25% of emission allowance value would be allocated for a "consumer benefit or strategic energy purpose."42 The RGGI states (as a group) have more than doubled this commitment.
Table 1 provides estimates of auction revenue distribution by state for several categories from 2008 to 2014. As mentioned above, RGGI auction revenues have accounted for the vast majority (approximately 91%) of the emission allowance value created by the emissions cap. As the table indicates, RGGI states (in aggregate) allocated auction revenues as follows:
- 42% for energy efficiency;
- 11% for electricity bill assistance;
- 9% for GHG abatement;
- 8% for clean and renewable energy;
- 8% for state budget reduction;
- 4% for administration; and
- 1% for RGGI, Inc.
At the time these estimates were collected, an additional 17% of auction revenue remained to be invested. Some portion of this value will likely be used to support similar objectives.
The values in the table also demonstrate that allowance value distribution decisions are subject to change. For example, after initially allotting auction proceeds to energy efficiency efforts, several states (New Jersey and New York) transferred auction proceeds to address state budget deficits. Environmental groups criticized the actions of these states, but the state policymakers argued that the transfers were necessary.
These developments highlight a cap-and-trade design issue for federal policymakers: How much flexibility (if any) should be built into a strategy to distribute emission allowance value? For example, should crafters include provisions that authorize modifying (without legislation) an enacted distribution approach, perhaps based on specific criteria?
|
State |
Energy Efficiency |
Direct Bill Assistance |
GHG Abatement |
Clean and Renewable Energy |
Administration |
RGGI, Inc. |
State Budget Deficit Reduction |
Committed to 2015 and Future Programs |
Total |
|
Connecticut |
74 |
25 |
8 |
1 |
16 |
124 |
|||
|
Delaware |
16 |
2 |
3 |
3 |
2 |
<1 |
37 |
63 |
|
|
Maine |
34 |
1 |
1 |
<1 |
17 |
53 |
|||
|
Maryland |
87 |
177 |
16 |
26 |
13 |
3 |
53 |
375 |
|
|
Massachusetts |
244 |
40 |
15 |
6 |
3 |
12 |
320 |
||
|
New Hampshire |
46 |
24 |
1 |
>1 |
3 |
1 |
75 |
||
|
New Jersey (2008-2011) |
44 |
10 |
5 |
65 |
124 |
||||
|
New York |
242 |
107 |
79 |
30 |
5 |
90 |
172 |
725 |
|
|
Rhode Island |
13 |
>1 |
1 |
<1 |
21 |
35 |
|||
|
Vermont |
14 |
<1 |
<1 |
<1 |
14 |
||||
|
Total |
814 |
203 |
177 |
148 |
67 |
12 |
158 |
329 |
1,908 |
Source: Prepared by CRS; data from RGGI, Investment of RGGI Proceeds Through 2014, September 2016, http://rggi.org/docs/ProceedsReport/RGGI_Proceeds_Report_2014.pdf; New Jersey data from Environment Northeast, RGGI Auction Tracker: State Allocations and Spending Plans, June 2013. New Jersey left RGGI at the end of 2011.
Notes: The category names come from the RGGI document. The above estimates are based on percentages in the RGGI document multiplied by the total proceeds for each state (and rounded to the nearest million). Due to rounding, the combined estimated totals for each category may not match the total amount provided in the RGGI document.
Emissions Leakage
During RGGI's development, the program designers recognized that "emissions leakage" could potentially undermine the effectiveness of the RGGI program. Leakage can occur when an emissions reduction program does not include all sources contributing to the environmental problem. Increases in emissions from uncovered sources may reduce emission achievements from covered sources. This is a concern with the RGGI program, because the RGGI regime does not regulate emissions from electricity generated outside the region (e.g., in Pennsylvania) and then used within the region (i.e., "imported electricity").
Emissions leakage could occur if imported electricity replaces RGGI in-state electricity generation, because emissions from in-state electricity are covered under the cap; emissions from imported electricity are not. In such a scenario, the quantity of leakage would depend on the sources of electricity generation involved in the tradeoff. For example, maximum leakage would occur if imported electricity from a coal-fired power plant replaced in-state electricity generated from a zero-emission source.
RGGI states have been monitoring electricity generation and CO2 emission levels from both RGGI and non-RGGI sources43 since the emissions cap took effect in 2009. In RGGI's most recent monitoring report (August 2016),44 the authors compared activity between 2012 and 2014 to a pre-RGGI baseline period (2006 through 2008). The report found that electricity generation from all non-RGGI sources increased by about 12%, due largely to a 34% increase in imported electricity. However, the report also found that the CO2 emission levels from non-RGGI sources decreased by 0.5%. This is likely related to (1) RGGI state increases in electricity generation from hydropower and renewable sources (Figure 3) and (2) increases of imported electricity from hydropower, primarily from Quebec.45
After its 2012 program review, RGGI participants stated:
[T]he states commit, over the course of the next year, to engage in a collaborative effort ... to identify and evaluate potential imports tracking tools, conduct further modeling to ascertain energy and price implications of any potential policy on emissions associated with imported electricity, and pursue additional legal research necessary, leading to a workable, practicable, and legal mechanism to address emissions associated with imported electricity.46
Emissions leakage will likely remain a topic of discussion going forward, particularly with the onset of the revised emissions cap in 2014.
Offsets
Federal policymakers may be interested in RGGI's treatment of offsets. An offset is a measurable reduction, avoidance, or sequestration of GHG emissions from a source not covered by an emission reduction program.47 RGGI limits offsets to 3.3% of a source's allowance submission, a relatively low percentage compared to California's cap-and-trade system48 and some federal proposals.49 Under RGGI's original model rule (2009-2013), the offset ceiling percentage could increase to 5% or 10% if the market price of an allowance exceeds $7 or $10 (in 2005 dollars, adjusted annually), respectively. However, as part of the design review in February 2013, RGGI states replaced this provision with the new Cost Containment Reserve, discussed below.
RGGI uses a standards approach—as opposed to performance-based system—for developing offsets: A project must satisfy a set of detailed requirements (specific to a project type) and be certified by a third party. In contrast to recent federal proposals, which often allow a wide array of project types, RGGI limits offset projects to five types, which must be located in RGGI states:
- 1. Landfill methane reduction;
- 2. Sulfur hexafluoride reductions from specific industrial activities;
- 3. Forest sequestration projects,50 including afforestation,51 reforestation,52 improved forest management, and avoided forest conversion;
- 4. Specific energy efficiency projects; and
- 5. Avoided methane from manure management practices.
Some offset projects raise concerns, because they may not represent real emission reductions. For offsets to be credible, a ton of CO2-equivalent emissions from an offset project should equate to a ton reduced from a RGGI power plant. If illegitimate offset credits flow into an emissions trading program, the program would fail to achieve its primary goal—emission reduction.
Regardless, according to the RGGI offsets tracking database, no offset projects have been developed under the RGGI program.53
Cost Containment
As part of the 2012 design review, RGGI states decided to alter the cost containment provisions in the RGGI program. Under the original model rule (2009-2013), potential cost concerns were addressed by allowing for the use of additional offsets if emission allowance prices reached specific levels. The revised model rule, which took effect in 2014, eliminated this approach and added a cost containment reserve (CCR) to the cap-and-trade system. The CCR provides additional allowances—5 million in 2014 and 10 million each year thereafter—if certain price thresholds are met during one of the quarterly allowance auctions:
- $4 per ton in 2014;
- $6 per ton in 2015;
- $8 per ton in 2016; and
- $10 per ton in 2017, increasing 2.5% each year thereafter.
The CCR was triggered in 2014 and 2015 (Figure 5), allowing for the sale of 5 million and 10 million additional allowances, respectively. In each instance, all of the additional allowances were purchased. Unlike some allowance reserve systems in other programs and proposals,54 allowances from CCR are not borrowed from future years, thus effectively increasing the cap if triggered.
Interaction with Federal GHG Emission Regulations
An issue for both federal and state policymakers is how RGGI's emission program would interact with the Clean Power Plan, the Environmental Protection Agency's (EPA's) regulations that apply to existing power plants. The rule establishes CO2 emission guidelines for states to use when developing plans that address CO2 emissions from existing fossil-fuel-fired electric generating units.55 The final rule appeared in the Federal Register on October 23, 2015.56
On February 9, 2016, the Supreme Court stayed the rule for the duration of the litigation. The rule therefore currently lacks enforceability or legal effect, and if the rule is ultimately upheld, at least some of the deadlines would have to be delayed. In addition, on March 28, 2017, President Trump signed Executive Order 13783 directing federal agencies to review existing regulations and policies that potentially burden the development or use of domestically produced energy resources.57 Among its specific provisions, the order directed EPA to review the Clean Power Plan and three proposed and final rules related to it "for consistency with the policy set forth in ... this order" and, if appropriate, to "suspend, revise, or rescind" them. Thus, the status of the Clean Power Plan is in flux, with major decisions possible from both the executive and judicial branches.
If implemented, EPA's Clean Power Plan would allow states considerable flexibility in meeting their CO2 emission rates or emission targets. For example, states could establish new programs to meet their goals or use existing programs and regulations. Moreover, states could meet their goals individually or collaborate with other states to create (or use existing) multistate plans.
It is uncertain whether the scope and stringency of the RGGI program would be sufficient to meet the targets in EPA's Clean Power Plan. RGGI's existing emission cap stops at 2020; the Clean Power Plan's requirements begin in 2022 and continue through 2030. Second, the new CCR has the potential to provide up to 10 million tons of additional allowances each year, making an analysis more challenging.
RGGI participants began a second design review process at the end of 2015. According to the RGGI website, the design review "will solicit stakeholder input on RGGI program design elements, including considerations for compliance under the EPA Clean Power Plan."58
Final Observations
The nature of the RGGI program changed significantly in 2014. Comparing the first five years of RGGI (2009-2013) to the existing program is an apples-to-oranges exercise. The RGGI states significantly altered their emissions cap in 2014, and this new cap may have different effects than the original emissions cap. It is uncertain how this new development may impact electricity use and prices in the RGGI region and, in turn, the perception and support for the program.
As a group, the nine RGGI states account for approximately 7% of U.S. CO2 emissions from energy consumption and 16% of the U.S. gross domestic product (GDP).59 Table 2 indicates that RGGI's aggregate CO2 emissions from energy consumption rank in the top 20 among nations. But from a practical standpoint, the RGGI program's contribution to directly reducing the global accumulation of GHG emissions in the atmosphere is arguably negligible.
However, when business and industry have confronted a growing patchwork of state requirements, these sectors have historically preferred a national policy. RGGI and other state programs, particularly developments in California, may have some influence on federal policymakers. Note that the combination of RGGI and California CO2 emissions (749 million metric tons) would rank above seventh, behind Germany (Table 2).
In addition, RGGI's activities may create examples and/or models that could prove instructive for federal policymakers crafting more widespread applications. The program has provided a training ground for personnel from multiple states and various professions to develop a specific expertise in emissions trading issues. This knowledge base could be useful if a federal system were developed.
|
Country or State |
CO2 Emissions |
Country or State |
CO2 Emissions |
||
|
China |
9,377 |
Saudi Arabia |
576 |
||
|
United States |
5,508 |
Indonesia |
548 |
||
|
India |
1,895 |
Brazil |
547 |
||
|
Russia |
1,756 |
South Africa |
472 |
||
|
Japan |
1,177 |
United Kingdom |
446 |
||
|
Germany |
756 |
Mexico |
436 |
||
|
Iran |
646 |
9 RGGI States |
391 |
||
|
South Korea |
643 |
Australia |
378 |
||
|
Texas |
642 |
358 |
|||
|
Canada |
607 |
Italy |
343 |
||
Source: Prepared by CRS with data from EIA, "International Energy Statistics," "Total CO2 Emissions from the Consumption of Energy," and "State CO2 Emissions," at http://www.eia.gov.