Action on FY2017 Agriculture Appropriations
The FY2017 appropriation for Agriculture and Related Agencies was enacted on May 5, 2017, as part of the Consolidated Appropriations Act (P.L. 115-31, Division A). The fiscal year started on October 1, 2016, under a continuing resolution (CR) that lasted until December 9, 2016 (P.L. 114-223, Division C). A second CR lasted until April 28, 2017 (P.L. 114-254, Division A). A third CR extended until May 5 (P.L. 115-30). The CRs continued FY2016 funding with a few exceptions.1
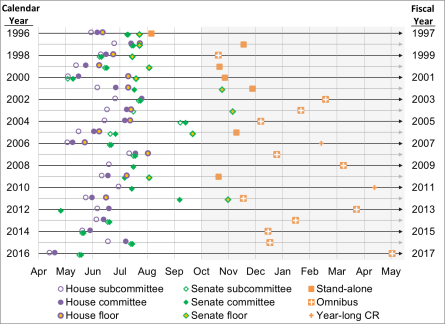
In regular action, the House and the Senate Appropriations Committees reported their FY2017 Agriculture appropriations bills (H.R. 5054, S. 2956) in April and May 2016, with some of the earliest subcommittee action in two decades (Figure 1; Appendix). But no further action on the individual bills occurred until they were incorporated into the omnibus appropriation.2
The discretionary total of the enacted appropriation is $20.877 billion, which is $623 million less than enacted in FY2016 (-2.9%). The appropriation also carries mandatory spending—largely determined in separate authorizing laws—that totaled about $132.5 billion. The overall total therefore exceeded $153 billion (Table 1). The discretionary caps were set so as not to trigger sequestration under limits established by the Bipartisan Budget Act of 2015 (P.L. 114-74).3
The White House released its FY2017 budget request on February 9, 2016,4 along with the detailed justification from the U.S. Department of Agriculture (USDA).5 The new Administration released an outline for FY2018 appropriations on March 16, 2017.6
Scope of Agriculture Appropriations
The Agriculture appropriations act funds all of USDA, except for the U.S. Forest Service. It also funds the Food and Drug Administration (FDA) in the Department of Health and Human Services. In even-numbered fiscal years, the enacted Agriculture bill carries CFTC funding under the usual practice for handling jurisdictional differences between the House and Senate.7
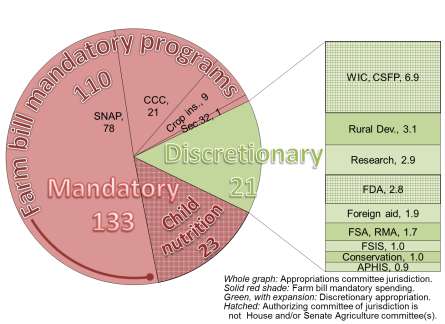
Agriculture appropriations include both mandatory and discretionary spending, but discretionary amounts are the primary focus since mandatory amounts are generally set by authorizing laws. The scope of the appropriation is shown by the major allocations in Figure 2. The largest discretionary spending items are domestic nutrition, agricultural research, rural development, FDA, foreign food aid, farm assistance programs, food safety inspection, conservation, and animal and plant health. The main mandatory spending items are the Supplemental Nutrition Assistance Program, child nutrition, crop insurance, and the Commodity Credit Corporation (which pays for the farm commodity, conservation, and other mandatory USDA programs).
|
Figure 1. Timeline of Action on Agriculture Appropriations, FY1997-FY2017 |
 |
|
Source: CRS. |
Amounts in the FY2017 Appropriation
The $20.877 billion enacted in the FY2017 Agriculture appropriation is officially $623 million smaller than the FY2016 discretionary appropriation (in terms of its allocation that counts against the budget limit, the "302(b)" subcommittee allocation). It achieves this primarily by increasing budgetary offsets over the FY2016 level through greater rescissions of prior appropriations and greater scorekeeping adjustments primarily from "negative subsidies" from loan programs that charge fees (Table 1). However, the budget authority provided to agencies in the major titles of the bill actually increases by $462 million (the top of the shaded bars in Figure 3).
Discretionary budget changes that are over $10 million within agencies include the following, relative to FY2016 (Table 2):
- Conservation programs. +$163 million, mostly for $150 million of watershed and flood prevention programs that have not been funded since FY2010.
- Rural development. +$119 million, mostly for rural water and wastewater programs (+$49 million), rural broadband (+$24 million), and rural housing rental assistance (+$15 million).
- Food and Nutrition Service. +$65 million, mostly for commodity assistance (+$19 million) and nutrition programs administration (+$20 million) in the regular nutrition title and a $19 million supplemental in the general provisions for commodity assistance. Offset by an $850 million rescission in WIC because of lower prior-year participation than expected.
- Animal and Plant Health Inspection Service. +$52 million, primarily for increases in emergency preparedness.
- Food and Drug Administration. +$42 million, including $36 million more for food safety activities.
- Farm Service Agency. +$29 million, including $23 million more to support a 25% increase in farm loan program authority.
- USDA administration. +$20 million to modernize headquarters facilities.
- Food Safety Inspection Service. +$17 million for inspection improvements.
- Food for Peace grants. -$116 million from less supplemental funding ($134 million) to augment constant base funding of $1.466 billion.
- Disaster assistance. -$114 million, comprised from $38 million less appropriated for programs than in FY2016 ($206 million in the second continuing resolution plus $28 million in the omnibus appropriation) and $76 million more in disaster designation offsets that do not count against budget caps.
- Agricultural research agencies. -$46 million, comprised primarily of $25 million more for Agriculture and Food Research Initiative (AFRI) grants, and $26 million more for Agricultural Research Service (ARS) operations, offset by $112 million less for ARS buildings and facilities.
Mandatory spending carried in the bill—mostly determined in separate authorizing laws—increases $13.5 billion over FY2016. All of this increase is in farm programs, including a $14.4 billion increase in the reimbursement to the Commodity Credit Corporation for higher than expected payments for farm commodity revenue support programs (Table 2). This increase is automatic based on farm bill formulas and does not affect discretionary spending limits.
Recent Trends in Agriculture Appropriations
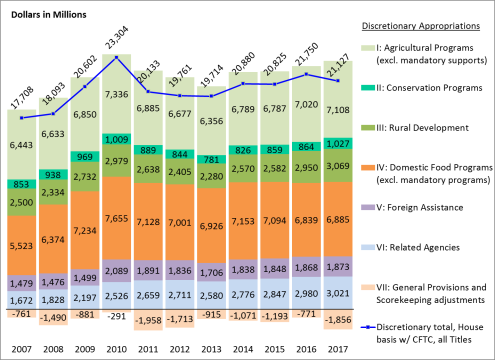
Over time, changes by title of the Agriculture appropriations bill have generally been proportionate to changes in the bill's total discretionary limit, though some activities have sustained relative increases and decreases. Agriculture appropriations peaked in FY2010 and declined through FY2013. Since then, total Agriculture appropriations have increased (Figure 3). However, whether that increase returns the appropriation to various historical benchmarks depends upon inflation adjustments and other factors.
The stacked bars in Figure 3 represent the discretionary spending authorized for each title in the 10 years since FY2007. The total of the positive stacked bars is the budget authority contained in Titles I-VI. It is higher than the official "302(b)" discretionary spending limit (the line) because of the budgetary offset from negative amounts in Title VII General Provisions and other scorekeeping adjustments. General Provisions are negative mostly because of limits placed on mandatory programs, which are scored as savings (Table 2).
For example, in the FY2017 appropriation, budget authority for the primary agencies in the bill (Titles I-VI) increased $462 million (the top of the stacked bars in Figure 3) even though the official discretionary spending allocation decreased $623 million (the line in Figure 3).
Increases in the use of CHIMPS and other tools to offset discretionary appropriations ameliorated reductions in discretionary budget authority in FY2011 and succeeding years. For example, the official "302(b)" discretionary total for the bill was given credit for declining 13.6% in FY2011, while the total of Titles I-VI declined only 6.4% that year (Figure 3). The effect is less pronounced in FY2016, since the offset was smaller, in part because of additional spending in General Provisions for foreign food aid and emergency programs.
Some areas have sustained real increases, while others have declined (apart from the peak in 2010). Agencies with sustained real increases (that is, inflation-adjusted; Figure 4) since FY2008 include FDA and CFTC (Related Agencies) and, to a lesser extent, foreign food assistance. Areas with real decreases in discretionary spending since 2008 include general agricultural programs and domestic nutrition programs. Rural development and conservation also had a real decrease over the same period, though FY2016 reversed that trend for rural development, and FY2017 reversed it for conservation.
|
Figure 3. Discretionary Agriculture Appropriations, by Title, Since FY2007 |
 |
|
Source: CRS. Includes CFTC in Related Agencies in all years. |
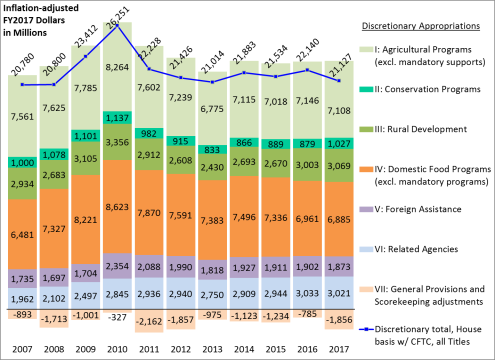
Table 1. Agriculture and Related Agencies Appropriations, by Title, FY2016-FY2017
(budget authority in millions of dollars)
|
FY2016 |
FY2017 |
Change: FY2016 to FY2017 Enacted |
|||||
|
Title of Agriculture Appropriations Act |
Admin. Request |
H. Cmte. H.R. 5054 |
S. Cmte. S. 2956 |
||||
|
I. Agricultural Programs: Discretionary |
7,020.3 |
7,091.1 |
7,015.7 |
7,069.7 |
7,107.7 |
+87.4 |
+1.2% |
|
Mandatory (M)a |
16,032.6 |
23,638.4 |
23,638.4 |
23,648.4 |
31,280.2 |
+15,247.6 |
+95.1% |
|
Subtotal |
23,052.9 |
30,729.5 |
30,654.1 |
30,718.2 |
38,387.9 |
+15,335.0 |
+66.5% |
|
II. Conservation Programs |
863.8 |
861.3 |
868.2 |
1,015.4 |
1,027.4 |
+163.6 |
+18.9% |
|
III. Rural Development |
2,950.0 |
3,015.9 |
3,036.4 |
3,001.7 |
3,069.2 |
+119.2 |
+4.0% |
|
IV. Domestic Food Programs: Discretionary |
6,838.9 |
6,932.4 |
6,880.5 |
6,890.3 |
6,884.7 |
+45.8 |
+0.7% |
|
Mandatory (M) |
102,958.1 |
104,830.9 |
102,803.0 |
102,830.9 |
101,226.7 |
-1,731.5 |
-1.7% |
|
Subtotal |
109,797.0 |
111,763.3 |
109,683.4 |
109,721.1 |
108,111.3 |
-1,685.6 |
-1.5% |
|
V. Foreign Assistance |
1,868.5b |
1,752.3 |
1,870.9 |
2,006.9 |
1,872.9b |
+4.4 |
+0.2% |
|
VI. Food and Drug Administration |
2,729.6 |
2,742.7 |
2,765.6 |
2,771.8 |
2,771.2 |
+41.6 |
+1.5% |
|
Commodity Futures Trading Commission |
250.0 |
330.0 |
250.0 |
[250.0]c |
[250.0] |
+0.0 |
+0.0 |
|
VII. General Provisions: CHIMPSd & rescissions |
-865.0 |
-645.7 |
-914.7 |
-998.2 |
-1,597.0 |
-732.0 |
+84.6% |
|
Disaster/emergency programs |
273.0 |
0.0 |
5.0 |
0.0 |
234.8e |
-38.2 |
-14.0% |
|
Other appropriations |
283.1b |
0.0 |
45.5 |
16.6 |
237.4b |
-45.7 |
-16.1% |
|
Scorekeeping adjustmentsf |
-332.0 |
-524.0 |
-524.0 |
-524.0 |
-525.0 |
-193.0 |
+58.1% |
|
Subtract disaster declaration in this bill |
-130.0 |
— |
— |
— |
-206.1e |
-76.1 |
+58.6% |
|
Totals |
|||||||
|
Discretionary: Senate basis w/o CFTC |
[21,500.0] |
21,225.9 |
[21,049.0] |
21,250.0 |
20,877.0 |
-623.0 |
-2.9% |
|
Discretionary: House basis w/ CFTC |
21,750.0 |
21,555.9 |
21,299.0 |
[21,500.0] |
[21,127.0] |
-623.0 |
-2.9% |
|
Mandatory (M) |
118,990.7 |
128,469.3 |
126,441.4 |
126,479.3 |
132,506.9 |
+13,516.2 |
+11.4% |
|
Total: Senate basis w/o CFTC |
140,490.7 |
149,695.3 |
147,490.4 |
147,729.3 |
153,383.9 |
+12,893.2 |
+9.2% |
Source: CRS, using appropriations text and reports, and Congressional Budget Office (CBO) tables.
Notes: Amounts are nominal budget authority in millions of dollars. Discretionary authority unless labeled otherwise. Bracketed amounts are not in the official totals due to differing House-Senate jurisdiction for CFTC.
a. Includes some mandatory funding from other titles, particularly mandatory conservation programs.
b. In addition to the regular appropriations for Food for Peace Title II grants in Title V ($1.466 billion), extra appropriations were made under General Provisions in FY2016 ($250 million) and FY2017 ($134 million). The effective total for Food for Peace Title II grants is $1.716 billion in FY2016 and $1.600 billion in FY2017.
c. See the Senate-reported Financial Services appropriation, S. 3067.
d. Changes in Mandatory Program Spending (CHIMPS) are reductions made to mandatory programs.
e. Includes $206 million appropriated for the Emergency Conservation Program (ECP) and Emergency Watershed Program (EWP) in the second continuing resolution (P.L. 114-254, Section 185) that were offset as emergency spending. Another $29 million for ECP was included in the final appropriation (Section 753).
f. "Scorekeeping adjustments" are not necessarily appropriated items and may not always be shown but are part of the official CBO score (accounting) of the bill. They predominantly include "negative subsidies" in loan program accounts and adjustments for disaster designations in the bill.
Table 2. Agriculture and Related Agencies Appropriations, by Agency, FY2014-FY2017
(budget authority in millions of dollars)
|
FY2014 |
FY2015 |
FY2016 |
FY2017 |
Change: FY2016 to FY2017 Enacted |
|||||
|
Agency or Major Program |
Admin. Request |
H. Cmte. H.R. 5054 |
S. Cmte. S. 2956 |
||||||
|
Title I. Agricultural Programs |
|||||||||
|
Departmental Administration |
526.1 |
364.5 |
373.2 |
448.7 |
392.4 |
403.5 |
403.9 |
+30.8 |
+8.2% |
|
Research, Education and Economics |
|||||||||
|
Agricultural Research Service |
1,122.5 |
1,177.6 |
1,355.9 |
1,255.8 |
1,251.4 |
1,242.2 |
1,269.8 |
-86.1 |
-6.3% |
|
National Institute of Food and Agriculture |
1,277.1 |
1,289.5 |
1,326.5 |
1,374.0 |
1,341.2 |
1,363.7 |
1,362.9 |
+36.4 |
+2.7% |
|
National Agricultural Statistics Service |
161.2 |
172.4 |
168.4 |
176.6 |
168.4 |
169.6 |
171.2 |
+2.8 |
+1.7% |
|
Economic Research Service |
78.1 |
85.4 |
85.4 |
91.3 |
86.0 |
86.8 |
86.8 |
+1.4 |
+1.6% |
|
Under Secretary, Research, Education, Econ. |
0.9 |
0.9 |
0.9 |
0.9 |
0.9 |
0.9 |
0.9 |
+0.0 |
+0.0% |
|
Marketing and Regulatory Programs |
|||||||||
|
Animal and Plant Health Inspection Service |
824.9 |
874.5 |
897.6 |
904.4 |
934.0 |
942.5 |
949.4 |
+51.8 |
+5.8% |
|
Agricultural Marketing Service |
81.3 |
82.4 |
82.5 |
83.2 |
83.5 |
84.2 |
86.2 |
+3.7 |
+4.5% |
|
Section 32 (M) |
1,107.0 |
1,284.0 |
1,303.0 |
1,322.0 |
1,322.0 |
1,322.0 |
1,322.0 |
+19.0 |
+1.5% |
|
Grain Inspection, Packers, Stockyards Admin. |
40.3 |
43.0 |
43.1 |
43.5 |
43.1 |
43.5 |
43.5 |
+0.4 |
+1.0% |
|
Under Secretary, Marketing and Regulatory |
0.9 |
0.9 |
0.9 |
0.9 |
0.9 |
0.9 |
0.9 |
+0.0 |
+0.9% |
|
Food Safety |
|||||||||
|
Food Safety & Inspection Service |
1,010.7 |
1,016.5 |
1,014.9 |
1,030.4 |
1,030.4 |
1,033.8 |
1,032.1 |
+17.2 |
+1.7% |
|
Under Secretary, Food Safety |
0.8 |
0.8 |
0.8 |
0.8 |
0.8 |
0.8 |
0.8 |
+0.0 |
+0.4% |
|
Farm and Commodity Programs |
|||||||||
|
Farm Service Agencya |
1,592.2 |
1,603.3 |
1,595.1 |
1,613.6 |
1,607.5 |
1,621.2 |
1,624.0 |
+29.0 |
+1.8% |
|
FSA Farm Loans: Loan Authorityb |
5,527.3 |
6,402.1 |
6,402.1 |
6,655.1 |
6,667.1 |
6,655.1 |
8,002.6 |
+1,600.5 |
+25.0% |
|
Risk Management Agency Salaries and Exp. |
71.5 |
74.8 |
74.8 |
66.6 |
74.8 |
75.8 |
74.8 |
+0.0 |
+0.0% |
|
Federal Crop Insurance Corporation (M) |
9,502.9 |
8,930.5 |
7,858.0 |
8,839.1 |
8,839.1 |
8,849.1 |
8,667.0 |
+809.0 |
+10.3% |
|
Commodity Credit Corporation (M) |
12,538.9 |
13,444.7 |
6,871.1 |
13,476.9 |
13,476.9 |
13,476.9 |
21,290.7 |
+14,419.6 |
+209.9% |
|
Under Secretary, Farm and Foreign Agr. |
0.9 |
0.9 |
0.9 |
0.9 |
0.9 |
0.9 |
0.9 |
+0.0 |
+0.3% |
|
Subtotal: Discretionary |
6,789.0 |
6,786.9 |
7,020.3 |
7,091.1 |
7,015.7 |
7,069.7 |
7,107.7 |
+87.4 |
+1.2% |
|
Mandatory (M) |
23,149.1 |
23,659.7 |
16,032.6 |
23,638.4 |
23,638.4 |
23,648.4 |
31,280.2 |
+15,247.6 |
+95.1% |
|
Subtotal |
29,938.1 |
30,446.6 |
23,052.9 |
30,729.5 |
30,654.1 |
30,718.2 |
38,387.9 |
+15,335.0 |
+66.5% |
|
Title II. Conservation Programs |
|||||||||
|
Conservation Operations |
812.9 |
846.4 |
850.9 |
860.4 |
855.3 |
864.5 |
864.5 |
+13.6 |
+1.6% |
|
Watershed and Flood Prevention |
— |
— |
— |
— |
— |
150.0 |
150.0 |
+150.0 |
— |
|
Watershed Rehabilitation Program |
12.0 |
12.0 |
12.0 |
— |
12.0 |
— |
12.0 |
+0.0 |
+0.0% |
|
Under Secretary, Natural Resources |
0.9 |
0.9 |
0.9 |
0.9 |
0.9 |
0.9 |
0.9 |
+0.0 |
+0.3% |
|
Subtotal |
825.8 |
859.3 |
863.8 |
861.3 |
868.2 |
1,015.4 |
1,027.4 |
+163.6 |
+18.9% |
|
Title III. Rural Development |
|||||||||
|
Salaries and Expenses (including transfers)c |
657.4 |
678.2 |
682.9 |
698.5 |
672.8 |
683.3 |
675.8 |
-7.0 |
-1.0% |
|
Rural Housing Service |
1,279.6 |
1,298.4 |
1,616.4 |
1,616.9 |
1,653.5 |
1,639.4 |
1,654.9 |
+38.4 |
+2.4% |
|
RHS Loan Authorityb |
27,408.1 |
27,421.5 |
27,496.8 |
27,433.2 |
27,653.4 |
27,596.4 |
28,083.4 |
+586.6 |
+2.1% |
|
Rural Business-Cooperative Serviced |
130.2 |
103.2 |
90.5 |
149.5 |
110.4 |
92.0 |
97.7 |
+7.2 |
+8.0% |
|
RBCS Loan Authorityb |
1,022.8 |
984.5 |
979.3 |
1,116.0 |
998.7 |
979.3 |
988.4 |
+9.1 |
+0.9% |
|
Rural Utilities Service |
501.6 |
501.7 |
559.3 |
550.1 |
598.8 |
586.0 |
639.9 |
+80.5 |
+14.4% |
|
RUS Loan Authorityb |
7,514.5 |
7,464.1 |
8,210.6 |
7,993.8 |
8,210.0 |
8,217.0 |
8,217.0 |
+6.5 |
+0.1% |
|
Under Secretary, Rural Development |
0.9 |
0.9 |
0.9 |
0.9 |
0.9 |
0.9 |
0.9 |
+0.0 |
+0.3% |
|
Subtotal, Discretionary |
2,569.7 |
2,582.4 |
2,950.0 |
3,015.9 |
3,036.4 |
3,001.7 |
3,069.2 |
+119.2 |
+4.0% |
|
Subtotal, RD Loan Authorityb |
35,945.4 |
35,870.1 |
36,686.7 |
36,543.0 |
36,862.1 |
36,792.7 |
37,288.9 |
+602.2 |
+1.6% |
|
Title IV. Domestic Food Programs |
|||||||||
|
Child Nutrition Programs (M) |
19,288.0 |
21,300.2 |
22,149.7 |
23,230.7 |
23,175.7 |
23,201.7 |
22,794.0 |
+644.2 |
+2.9% |
|
WIC Program |
6,715.8 |
6,623.0 |
6,350.0 |
6,350.0 |
6,350.0 |
6,350.0 |
6,350.0 |
+0.0 |
+0.0% |
|
SNAP, Food & Nutrition Act Programs (M) |
82,169.9 |
81,837.6 |
80,849.4 |
81,689.2 |
79,673.3 |
79,682.2 |
78,480.7 |
-2,368.7 |
-2.9% |
|
Commodity Assistance Programs |
269.7 |
278.5 |
296.2 |
313.1 |
315.1 |
313.1 |
315.1 |
+18.9 |
+6.4% |
|
Nutrition Programs Administration |
141.3 |
150.8 |
150.8 |
179.4 |
168.5 |
173.3 |
170.7 |
+19.9 |
+13.2% |
|
Under Sec., Food, Nutrition & Consumer |
0.8 |
0.8 |
0.8 |
0.8 |
0.8 |
0.8 |
0.8 |
+0.0 |
+0.4% |
|
Subtotal |
|||||||||
|
Discretionary |
7,152.7 |
7,094.1 |
6,838.9 |
6,932.4 |
6,880.5 |
6,890.3 |
6,884.7 |
+45.8 |
+0.7% |
|
Mandatory (M) |
101,432.9 |
103,096.7 |
102,958.1 |
104,830.9 |
102,803.0 |
102,830.9 |
101,226.7 |
-1,731.5 |
-1.7% |
|
Subtotal |
108,585.6 |
110,190.9 |
109,797.0 |
111,763.3 |
109,683.4 |
109,721.1 |
108,111.3 |
-1,685.6 |
-1.5% |
|
Title V. Foreign Assistance |
|||||||||
|
Foreign Agricultural Service |
177.9 |
181.4 |
191.6 |
196.6 |
194.6 |
196.6 |
196.6 |
+5.0 |
+2.6% |
|
Food for Peace Title II, and admin. expenses |
1,468.7 |
1,468.5 |
1,468.5e |
1,350.1 |
1,466.1 |
1,600.1 |
1,466.1e |
-2.4 |
-0.2% |
|
Local and regional food procurement |
— |
— |
— |
15.0 |
— |
— |
— |
— |
— |
|
McGovern-Dole Food for Education |
185.1 |
191.6 |
201.6 |
182.0 |
201.6 |
201.6 |
201.6 |
+0.0 |
+0.0% |
|
CCC Export Loan Salaries |
6.7 |
6.7 |
6.7 |
8.5 |
8.5 |
8.5 |
8.5 |
+1.8 |
+26.5% |
|
Subtotal |
1,838.5 |
1,848.3 |
1,868.5e |
1,752.3 |
1,870.9 |
2,006.9 |
1,872.9 |
+4.4 |
+0.2% |
|
Title VI. Related Agencies |
|||||||||
|
Food and Drug Administration |
2,560.7 |
2,597.3 |
2,729.6 |
2,742.7 |
2,765.6 |
2,771.8 |
2,771.2 |
+41.6 |
+1.5% |
|
Commodity Futures Trading Commissionf |
215.0 |
[250.0] |
250.0 |
330.0 |
250.0 |
[250.0]f |
[250.0] |
+0.0% |
+0.0% |
|
Subtotal |
2,775.7 |
2,597.3 |
2,979.6 |
3,072.7 |
3,015.6 |
[3,021.8] |
[3,021.2] |
+41.6 |
+1.4% |
|
Title VII. General Provisions |
|||||||||
|
Reductions in Mandatory Programsg |
|||||||||
|
a. Environmental Quality Incentives Program |
-272.0 |
-136.0 |
-209.0 |
— |
-209.0 |
-189.0 |
-179.0 |
+30.0 |
-14.4% |
|
b. Watershed Rehabilitation Program |
-153.0 |
-69.0 |
-68.0 |
-54.0 |
-54.0 |
-63.0 |
-54.0 |
+14.0 |
-20.6% |
|
c. Conservation Stewardship Program |
— |
-7.0 |
— |
— |
-5.0 |
— |
— |
+0.0 |
+0.0% |
|
d. Fresh Fruit and Vegetable Program |
-119.0 |
-122.0 |
-125.0 |
-125.0 |
-125.0 |
-125.0 |
-125.0 |
+0.0 |
+0.0% |
|
e. Biorefinery Assistance Program |
-40.7 |
-16.0 |
-19.0 |
— |
-30.0 |
— |
-20.0 |
-1.0 |
+5.3% |
|
f. Biomass Crop Assistance Program |
— |
-2.0 |
-20.0 |
— |
-20.0 |
-20.0 |
-20.0 |
+0.0 |
+0.0% |
|
g. The Emergency Food Assistance Program |
— |
— |
— |
— |
+19.0 |
— |
+19.0 |
+19.0 |
— |
|
h. Cushion of Credit (Rural Development) |
-172.0 |
-179.0 |
-179.0 |
-151.5 |
-151.5 |
-165.0 |
-132.0 |
+47.0 |
-26.3% |
|
i. Section 32 |
-189.0 |
-121.0 |
-216.0 |
-311.0 |
-231.0 |
-237.0 |
-231.0 |
-15.0 |
+6.9% |
|
j. Other CHIMPS and rescissions |
-8.0 |
-133.0 |
+5.0 |
+0.0 |
-4.0 |
+5.0 |
-1.0 |
-6.0 |
-120.0% |
|
Subtotal, CHIMPS |
-953.7 |
-785.0 |
-831.0 |
-641.5 |
-810.5 |
-794.0 |
-743.0 |
+88.0 |
-10.6% |
|
Rescissions (discretionary) |
-33.3 |
-17.0 |
-34.0 |
-4.2 |
-104.2 |
-204.2 |
-854.0 |
-820.0 |
— |
|
Other appropriations |
|||||||||
|
a. Disaster/emergency programs |
— |
116.0 |
273.0 |
— |
5.0 |
— |
234.8h |
-38.2 |
-14.0% |
|
b. Other appropriations |
106.6 |
6.6 |
283.1e |
— |
45.5 |
16.6 |
237.4e |
-45.7 |
-16.1% |
|
Subtotal, Other appropriations |
106.6 |
122.6 |
556.1 |
— |
50.5 |
16.6 |
472.2 |
-83.9 |
-15.1% |
|
Total, General Provisions |
-880.4 |
-679.4 |
-308.9 |
-645.7 |
-864.2 |
-981.6 |
-1,124.8 |
-815.9 |
— |
|
Scorekeeping Adjustmentsi |
|||||||||
|
Disaster declaration in this bill |
— |
-116.0 |
-130.0 |
— |
— |
— |
-206.1h |
-76.1 |
+58.6% |
|
Other scorekeeping adjustments |
-191.0 |
-398.0 |
-332.0 |
-524.0 |
-524.0 |
-524.0 |
-525.0 |
-193.0 |
+58.1% |
|
Subtotal, Scorekeeping adjustments |
-191.0 |
-514.0 |
-462.0 |
-524.0 |
-524.0 |
-524.0 |
-731.1 |
-269.1 |
+58.3% |
|
Totals |
|||||||||
|
Discretionary: Senate basis w/o CFTC |
[20,665.0] |
20,575.0 |
[21,500.0] |
21,225.9 |
[21,049.0] |
21,250.0 |
20,877.0 |
-623.0 |
-2.9% |
|
Discretionary: House basis w/ CFTC |
20,880.0 |
[20,825.0] |
21,750.0 |
21,555.9 |
21,299.0 |
[21,500.0]f |
[21,127.0] |
-623.0 |
-2.9% |
|
Mandatory (M) |
124,582.0 |
126,756.5 |
118,990.7 |
128,469.3 |
126,441.4 |
126,479.3 |
132,506.9 |
+13,516.2 |
+11.4% |
|
Total: Senate basis w/o CFTC |
145,247.0 |
147,331.5 |
140,490.7 |
149,695.3 |
147,490.4 |
147,729.3 |
153,383.9 |
+12,893.2 |
+9.2% |
Source: CRS, using referenced appropriations text and report tables, and unpublished Congressional Budget Office (CBO) tables.
Notes: Amounts are nominal budget authority in millions of dollars. Amounts are discretionary authority unless labeled otherwise; (M) indicates that the account is mandatory authority (or primarily mandatory authority). Bracketed amounts are not in the official totals due to differing House-Senate jurisdiction for CFTC but are shown for comparison.
a. Includes regular FSA salaries and expenses, plus transfers for farm loan program salaries and administrative expenses. Also includes farm loan program loan subsidy, State Mediation Grants, Dairy Indemnity Program (mandatory funding), and Grassroots Source Water Protection Program. Does not include appropriations to the Foreign Agricultural Service for export loans and P.L. 480 administration that are transferred to FSA.
b. Loan authority is the amount of loans that can be made or guaranteed with a loan subsidy. It is not added in the budget authority subtotals or totals.
c. Includes Rural Development salaries and expenses and transfers from the three rural development agencies for salaries and expenses. Amounts for the agencies thus reflect program funds for loans and grants.
d. Amounts for the Rural Business-Cooperative Service (RBCS) are before the rescission in the Cushion of Credit account, unlike in Appropriations committee tables. The rescission is included with the changes in mandatory program spending (CHIMPS) as classified by CBO, which allows the RBCS subtotal to remain positive.
e. In addition to the regular appropriations for Food for Peace Title II grants in Title V ($1.466 billion), extra appropriations were made under General Provisions in FY2016 ($250 million) and FY2017 ($134 million). The effective total for Food for Peace Title II grants is $1.716 billion in FY2016 and $1.600 billion in FY2017.
f. Jurisdiction for CFTC is in the House Agriculture appropriations subcommittee and the Senate Financial Services appropriations subcommittee. After FY2008, CFTC is carried in enacted Agriculture appropriations in even-numbered fiscal years, always in House Agriculture markup and never in Senate Agriculture markup. Bracketed amounts are not in the official totals due to differing House-Senate jurisdiction for CFTC but are shown for comparison. For the FY2017 Senate amount, see the Senate-reported Financial Services appropriation, S. 3067.
g. Includes reductions (limitations and rescissions) to mandatory programs that may also be known as Changes in Mandatory Program Spending (CHIMPS).
h. Includes $206 million appropriated for the Emergency Conservation Program (ECP) and Emergency Watershed Program (EWP) in the second continuing resolution (P.L. 114-254, Section 185) that were offset as emergency spending. Another $29 million for ECP was included in the final appropriation (Section 753).
i. "Scorekeeping adjustments" are not necessarily appropriated items and may not be shown in appropriations committee tables but are part of the official CBO score (accounting) of the bill. They predominantly include "negative subsidies" in loan program accounts and adjustments for disaster designations in the bill.
Appendix. Action on Agriculture Appropriations
|
House Action |
Senate Action |
Final Appropriation |
|||||||||
|
Fiscal Year |
Subcmte. |
Cmte. |
Floor |
Subcmte. |
Cmte. |
Floor |
Enacteda |
Public Law |
CRS Report |
||
|
1995 |
5/26/1994 |
6/9/1994 |
6/17/1994 |
6/22/1994 |
6/23/1994 |
7/20/1994 |
9/30/1994 |
E |
IB94011 |
||
|
1996 |
6/14/1995 |
6/27/1995 |
7/21/1995 |
9/13/1995 |
9/14/1995 |
9/20/1995 |
10/21/1995 |
E |
95-624 |
||
|
1997 |
5/30/1996 |
6/6/1996 |
6/12/1996 |
7/10/1996 |
7/11/1996 |
7/24/1996 |
8/6/1996 |
E |
IB96015 |
||
|
1998 |
6/25/1997 |
7/14/1997 |
7/24/1997 |
7/15/1997 |
7/17/1997 |
7/24/1997 |
11/18/1997 |
E |
|||
|
1999 |
6/10/1998 |
6/16/1998 |
6/24/1998 |
6/9/1998 |
6/11/1998 |
7/16/1998 |
10/21/1998 |
O |
|||
|
2000 |
5/13/1999 |
5/24/1999 |
6/8/1999 |
6/15/1999 |
6/17/1999 |
8/4/1999 |
10/22/1999 |
E |
|||
|
2001 |
5/4/2000 |
5/16/2000 |
7/11/2000 |
5/4/2000 |
5/10/2000 |
7/20/2000 |
10/28/2000 |
E |
|||
|
2002 |
6/6/2001 |
6/27/2001 |
7/11/2001 |
Polled outb |
7/18/2001 |
10/25/2001 |
11/28/2001 |
E |
|||
|
2003 |
6/26/2002 |
7/26/2002 |
— |
7/23/2002 |
7/25/2002 |
— |
2/20/2003 |
O |
|||
|
2004 |
6/17/2003 |
7/9/2003 |
7/14/2003 |
7/17/2003 |
11/6/2003 |
11/6/2003 |
1/23/2004 |
O |
|||
|
2005 |
6/14/2004 |
7/7/2004 |
7/13/2004 |
9/8/2004 |
9/14/2004 |
— |
12/8/2004 |
O |
|||
|
2006 |
5/16/2005 |
6/2/2005 |
6/8/2005 |
6/21/2005 |
6/27/2005 |
9/22/2005 |
11/10/2005 |
E |
|||
|
2007 |
5/3/2006 |
5/9/2006 |
5/23/2006 |
6/20/2006 |
6/22/2006 |
— |
2/15/2007 |
Y |
|||
|
2008 |
7/12/2007 |
7/19/2007 |
8/2/2007 |
7/17/2007 |
7/19/2007 |
— |
12/26/2007 |
O |
|||
|
2009 |
6/19/2008 |
— |
— |
Polled outb |
7/17/2008 |
— |
3/11/2009 |
O |
|||
|
2010 |
6/11/2009 |
6/18/2009 |
7/9/2009 |
Polled outb |
7/7/2009 |
8/4/2009 |
10/21/2009 |
E |
|||
|
2011 |
6/30/2010 |
— |
— |
Polled outb |
7/15/2010 |
— |
4/15/2011 |
Y |
|||
|
2012 |
5/24/2011 |
5/31/2011 |
6/16/2011 |
Polled outb |
9/7/2011 |
11/1/2011 |
11/18/2011 |
O |
|||
|
2013 |
6/6/2012 |
6/19/2012 |
— |
Polled outb |
4/26/2012 |
— |
3/26/2013 |
O |
|||
|
2014 |
6/5/2013 |
6/13/2013 |
— |
6/18/2013 |
6/20/2013 |
— |
1/17/2014 |
O |
|||
|
2015 |
5/20/2014 |
5/29/2014 |
— |
5/20/2014 |
5/22/2014 |
— |
12/16/2014 |
O |
|||
|
2016 |
6/18/2015 |
7/8/2015 |
— |
7/14/2015 |
7/16/2015 |
— |
12/18/2015 |
O |
|||
|
2017 |
4/13/2016 Draftc Voice vote |
4/19/2016 Voice vote |
— |
5/17/2016 Voice vote |
5/19/2016 30-0 |
— |
5/5/2017 Votes: H: 309-118 S: 79-18 |
O |
Explanatory Statement: Congressional Record, May 3, 2017, Part II, H3328-H3364 |
||
Source: CRS.
a. E = Enacted as standalone appropriation (9 times over 23 years); O = Omnibus appropriation (12 times); Y = Year-long continuing resolution (two times).
b. A procedure that permits a Senate subcommittee to transmit a bill to its full committee without a formal markup session. See CRS Report RS22952, Proxy Voting and Polling in Senate Committee.
c. The House Agriculture appropriations subcommittee draft is available at http://appropriations.house.gov/UploadedFiles/BILLS-114HR-SC-AP-FY2017-Agriculture-SubcommitteeDraft.pdf.