Introduction
Congress has shown great concern about the performance of the nation's freight network. In the 2015 surface transportation reauthorization, the Fixing America's Surface Transportation Act (FAST Act; P.L. 114-94), Congress stated a national policy of improving the condition and performance of a "National Multimodal Freight Network" to help the United States compete in the global economy while mitigating the adverse environmental impacts of freight movement. The law authorized funding to improve freight transportation infrastructure, directed the U.S. Department of Transportation (DOT) to identify freight choke points and critical commerce corridors, and required state departments of transportation to establish freight performance targets. The law also called upon DOT to establish performance metrics for U.S. seaports.
DOT forecasts that domestic freight tonnage will increase by 40% over the next three decades, and that truck tonnage will increase by 44%.1 Some of the most congested truck routes, such as Interstate 95 in the East and Interstate 5 in the West, run parallel to coastal shipping routes, and water shipment through the Saint Lawrence Seaway and the Great Lakes has the potential to relieve pressure on major east-west highways, pipelines, and railroads in the Midwest. Coastal and Great Lakes shipping, therefore, may offer opportunities to facilitate commerce along these corridors.
In recent years, however, domestic shipborne commerce has generally lost ground to truck and rail freight. This is despite long-standing policy intended to promote use of the U.S. merchant marine, particularly deep-draft oceangoing ships, with financial assistance provided to U.S. shipbuilders, ship owners, and ship crews. A 2007 law authorizing federal support for projects intended to divert truck and rail freight to parallel waterways has been unsuccessful in reversing this trend.2
One reason for the declining cargo volumes of domestic coastal and Great Lakes shipping is that aspects of federal maritime policy tend to raise the cost of transporting goods by ship relative to other modes. Also, port costs appear to be a particular barrier to diverting truck freight to a coastal waterway. This report examines recent trends in waterborne freight movement within the United States and offers policy options that might strengthen the competitive position of coastal and Great Lakes shipping in the face of robust demand for freight transportation.
Ships as a Method of Transporting Freight
Under a different mix of federal policies, ships could be a least-cost method for moving goods. They do not need to acquire and maintain rights-of-way like railroads and pipelines. They can move much more cargo per trip and per gallon of fuel than trucks and railroads. Although ships are slower than other modes of freight transportation, many shippers are willing to sacrifice transit time for substantially lower costs, as long as delivery schedules are reliable.
The willingness of some shippers to accept longer transit times in return for the cost advantages of waterborne shipping is evident in the movement of U.S. foreign trade. Importers in the eastern United States have a choice of unloading Asian goods at a Pacific Coast port and moving them across the country by railroad or shipping their goods through the Panama Canal directly to an East Coast port. The transcontinental rail crossing takes about a week, and is significantly more costly than the "all-water route" through the Panama Canal, which takes about two weeks. Generally, importers of higher-value goods choose the quicker but more expensive rail route, while importers of lower-value goods choose the all-water route. About a third of the containers shipped from Asia to the U.S. East Coast move via the all-water route through the Canal.3 Conversely, West Virginia coal, with low value per ton, is exported to Asia from the ports of Baltimore and Norfolk, where it is loaded on ships that sail through the Panama Canal. Moving it by rail to West Coast ports would be faster but more costly.
With an extensive coastline, water access between the Atlantic Ocean and the Great Lakes, and the possibility of intercoastal transport between the Atlantic and Pacific coasts through the Panama Canal, U.S. geography is well suited to take advantage of ships' ability to facilitate commerce. The fact that a very large share of U.S. economic activity takes place along its coasts would seem to offer a considerable market for coastal shipping.
However, the domestic ship fleet could be a constraining factor, in terms of the age of some of the ships and because some common ship designs are missing from the fleet. For instance, while the maximum economic life of a ship in the world market is typically 20 years, 75% of the domestic container ship fleet is beyond this age, and 65% is older than 30 years. Only two dry bulk ships are available in the oceangoing fleet, and they are approaching 40 years in age. The Great Lakes fleet consists mostly of dry bulk ships, and these ships are older than 40 years. No break-bulk or heavy-lift/project cargo ships exist in the fleet. These ships are useful for carrying such prevalent types of cargo as steel products and large pieces of equipment. The one chemical tanker in the fleet is nearly 50 years old. The oil tanker fleet is more modern because the Oil Pollution Act of 1990 (P.L. 101-380) required that oil tank vessels have double hulls, necessitating more recent building activity.
Altogether, there are only 128 deep-draft ships in the domestic fleet.4 The availability of these ships may also be a factor. Vessels transporting goods between two U.S. points must be U.S.-built. This requirement originates in the Merchant Marine Act of 1920 (P.L. 66-261, §27) and is part of the law commonly referred to as the Jones Act. No such restriction applies to equipment used in truck, rail, pipeline, or air transportation, or in international waterborne commerce.
The Decline of U.S. Coastal Shipping
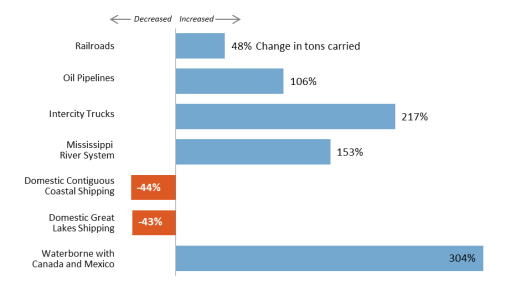
Despite their inherent efficiencies, domestic coastal and Great Lakes shipping carry barely half as much cargo today as they did in 1960 (Figure 1), even though the U.S. economy is much larger today. Over the same period, railroads have increased their transport volume by about 50%, and intercity trucks, oil pipelines, river barges, and coastal ships linking the United States with Canada and Mexico all have more than doubled their freight tonnage. While ships remain an attractive transport method for importers and exporters, they apparently are not attractive to shippers in domestic commerce.
 |
|
Source: CRS analysis of Association of American Railroads, Railroad Facts; Eno Transportation Foundation, Transportation in America, With Historical Compendium 1939-1999; U.S. Department of Transportation, Freight Analysis Framework; U.S. Army Corps of Engineers, Waterborne Commerce Statistics. Note: "Intercity Trucks" excludes local trucking. Mississippi River System is composed of barges, while the other waterborne modes are composed of barges and ships. |
The fact that vessels can move low-value goods more economically than railroads could be important for domestic trade between the interior Midwest and the coasts. The Mississippi River System (including the Ohio River and Illinois Waterway) and the Great Lakes and St. Lawrence Seaway, combined with coastal shipping, offer potential "all-water routes" to move cargo between the interior and both the Atlantic and Pacific Coasts. However, the relatively high cost and limited availability of domestic coastal shipping may lead to use of international trade in place of domestic trade. As one example, hog and poultry farmers in the Carolinas often import feed from South America partly because the shipping cost is less than the cost of bringing feed by rail from the Midwest; an all-water route might make feed from the Midwest more price-competitive.5 An all-water route could also reduce the chance of a spill when transporting hazardous cargoes between the two regions because a smaller number of trips would transport the same amount of cargo.
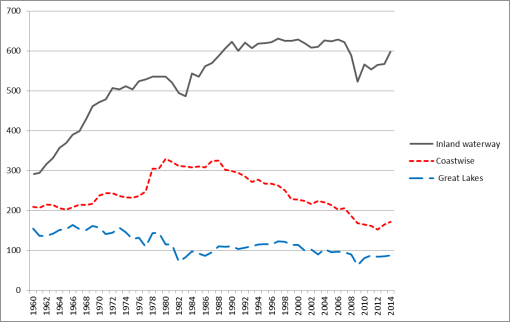
Figure 2 illustrates that the substantial reduction in both domestic coastwise and Great Lakes shipping volumes has occurred over several decades. This indicates that the decline is due not to a short-term business cycle but to more enduring economic factors. The commodity mix of domestic coastwise and Great Lakes cargo is much less diverse than it once was, as higher-value cargo has largely shifted to truck and rail modes.6 (Note that the "coastwise" data in Figure 2 include domestic shipping to and from Alaska, Hawaii, and Puerto Rico, unlike in Figure 1.)
|
Figure 2. Domestic Waterborne Tonnage, 1960 to 2014 (in millions of tons) |
 |
|
Source: U.S. Army Corps of Engineers, Waterborne Commerce Statistics. |
Concern about the decline of coastwise and Great Lakes shipping is of long standing. For example, in 1960, U.S. domestic ocean carriers urged Congress to approve a bill requiring the Interstate Commerce Commission to raise rail rates on parallel routes to improve the maritime industry's competitive position. No such legislation was enacted.7
Coastwise shipping of refined petroleum products today is a third of the volume shipped in 1960. In the early 1960s, strikes by crews on coastal tankers were a factor in decisions to build the Colonial Pipeline from Houston to New York and the Olympic Pipeline from Puget Sound refineries to Portland, OR.8 Today, these two coastal pipelines, along with a third, the Plantation Pipeline running from Baton Rouge, LA, to Washington, DC, transport the equivalent of 4,000 tanker loads of refined products per year.9
As Figure 2 indicates, coastwise shipping temporarily surged in the late 1970s as the opening of the Alaska pipeline brought about coastwise shipments of North Slope crude oil from the Port of Valdez. The Alaska oil shipments, which went mainly to refineries near Seattle, San Francisco, and Los Angeles,10 held steady for about a decade but then began declining. According to one analyst, the decline has been due partly to high transportation costs, which reduce the profitability of Alaska production.11 More recently, the volume of coastwise and inland waterway freight has been rising due to the boom in crude oil production in Texas and North Dakota. However, coastwise movement of this oil and the products refined from it is overwhelmingly performed by barge; very little oil in domestic trade moves by tanker ship.
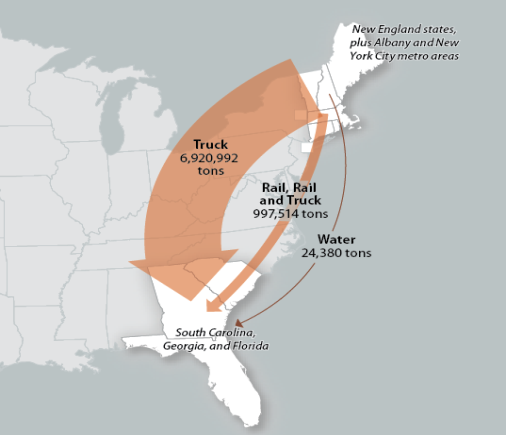
The use of coastal shipping is decreasing even between origin and destination pairs close to the coastline. For example, freight moving from New England and eastern New York to the southeastern coastal states of South Carolina, Georgia, and Florida overwhelmingly moves by overland modes (Figure 3). Assuming an average of 25 tons per full truckload, the nearly 7 million tons carried by truck in 2014 (as single-mode shipments) equates to over 276,000 truck trips (758 per day). The amount carried by water over the entire year equates to a single coastal-sized shipload.
Reviving coastal shipping could dramatically increase the capacity of the nation's freight network. It also could provide a competitive alternative for some shippers, potentially addressing persistent complaints by shippers that carriers in the rail and oil pipeline industries are able to exert market power to command unfairly high freight rates.12 Moreover, some of the necessary infrastructure is largely in place, as many of the harbors the federal government dredges for deep-draft vessels currently have little or no ship traffic. Increasing coastal shipping would require little additional investment in highways, railroads, or pipelines. The question is whether a different mix of federal policies would make coastal trade an attractive option for shippers and ship owners.
Higher Construction Cost of U.S.-Built Ships
The comparatively high cost of U.S.-built ships appears to be deterring prospective carriers from building such vessels for use in coastwise trade.13 Recent U.S.-built coastal-size container ships have a price range of $190 million to $250 million.14 This is six to eight times greater than the cost of a coastal or feeder ship of similar size built in a foreign shipyard (at about $30 million).15 Although barges also must be built in the United States, the cost of a U.S.-built ship is six to eight times greater than the cost of the equivalent cargo capacity in barge tows. Equivalent freight train capacity is also much less costly than U.S.-built ship capacity (Table 1).
|
Vehicle Equipment |
Equipment Needed for |
Total Cost |
Capital Cost per |
|
Freight train |
Two train sets: |
~$30 million |
$1,300 |
|
River Barge Tow |
One push boat (6,000 hp), |
~$25 million |
$1,086 |
|
Foreign-built |
one vessel |
$25 million to |
$1,086 to |
|
U.S.-built |
one vessel |
$190 million to |
$8,260 to |
Source: Association of American Railroads, Railroad Facts; U.S. Maritime Administration, Title XI loan applications pending and approved; press articles on barge equipment costs; press releases from foreign shipyards (see text).
Notes: Because trains travel much faster than ships and barges, one train set making two trips could match the capacity of one barge or ship voyage. In this case, the cost of equivalent freight train capacity would be approximately $15 million, or approximately $650 per capacity ton. Costs do not include operating costs.
The comparatively high cost of building ships domestically is related to the absence of foreign competition and the lack of economies of scale. The domestic oceangoing ship fleet is mostly deployed on routes where competition from overland transportation is not present, such as routes from the U.S. mainland to Hawaii, Puerto Rico, and Alaska. A fleet of small general-cargo ships is employed exclusively in delivering supplies to harbor communities in Alaska (where road connections do not exist), and the domestic tanker fleet is predominantly employed where pipeline service is unavailable or is operating at capacity. The three U.S. shipyards able to construct commercial deep-draft vessels, generally using foreign designs and importing the engines, bow and stern sections, and other key components, typically build only one or two deep-draft ships per year for the domestic market and none for foreign sale. The low level of demand leaves the shipyards unable to gain efficiencies from large-scale production.
In contrast, the existing barge fleet is large, consisting of nearly 4,000 towboats/push boats and about 22,000 barges on the Mississippi River System alone. U.S. shipyards build around 1,000 barges and approximately 70 towboats/push boats each year, enabling them to take advantage of scale economies. Unlike domestic ocean carriers, barge carriers face strong competitive pressure, particularly from railroads, which in turn leads to price pressure on the many U.S. shipyards that compete in barge construction.
The substitution of coastal barges for coastal ships is not captured in Figure 1. Although the total tonnage carried by vessel along the coasts and on the Great Lakes has declined by 44% since 1960, closer analysis shows that ship tonnage on these waterways has decreased by 61% over that period, while barge tonnage has increased by 356%.16
Federal Ship Financing Assistance
Two federal programs are intended to facilitate financing of U.S.-built ships, with the goal of strengthening the domestic shipbuilding industry. Under the Title XI program, the U.S. Maritime Administration (MARAD) provides loan guarantees of up to 87.5% of the cost of vessels built in U.S. shipyards.17 The guarantees enable purchasers to obtain lower interest rates from private lenders. MARAD also provides a tax-free account in which U.S. carriers can deposit funds intended to be used for purchasing U.S.-built ships for use in the Great Lakes trade or on routes serving noncontiguous areas such as Alaska, Hawaii, and Puerto Rico.18
These programs have supported the construction of most U.S.-built ships. However, the programs have been controversial.19 A July 2015 audit determined that the loan guarantee program had $644 million of loans in default, implying that the construction cost of some vessels in service with domestic ocean carriers ultimately would be paid by government funds.20
Cargo Preference Applies to Imported Ship Components
A 2011 determination by MARAD requires that at least 50% of the tonnage of imported components used to build ships with government financing must be shipped on U.S.-flagged vessels.21 This requirement is authorized by the Cargo Preference Act of 1954 (P.L. 83-644).22 This and other laws require that 50% to 100% of cargo transported overseas that is owned or involves financing by the federal government be carried by U.S.-flag ships.23 This policy, known as cargo preference, benefits owners of the U.S.-flag international vessels that transport these components. It does not benefit the owners of vessels in the separate domestic Jones Act fleet, as the MARAD determination makes domestic ships more costly to build. Vessels in the U.S.-flag international fleet do not have to be U.S.-built (and none are), but they are required to have U.S. crews and be U.S.-owned.
On December 1, 2016, MARAD issued final regulations specifying that the requirement to import vessel components aboard U.S.-flag ships begins as soon as an application for Title XI financing is filed, not when the application is approved.24 This is a change from previous regulations, because many Title XI applicants receive approval after construction begins and imported components have already been delivered to the U.S. shipyard. Two former senior officials of MARAD filed comments in opposition to this change, stating, "the requirements will impose a substantial financial burden from increased shipping costs, supply chain disruptions, and additional paperwork to demonstrate compliance."25 Two U.S. shipyards noted that large imported ship components are best carried on heavy-lift/project cargo ships designed to handle bulky cargoes, but there are none in the U.S.-flag fleet. They cited examples in which complying with the Cargo Preference Act requirement significantly raised the cost of foreign components ordered for coastal ships under construction. They also objected that MARAD determines "fair and reasonable" rates for such cargo based on a markup from the estimated cost to U.S.-flag carriers of providing the service rather than on the rates that would be available from a foreign-flag carrier, further increasing the construction cost of U.S.-built ships with foreign components.26
Cargo-Handling Costs
One important contributor to the cost of shipping goods by water is the cost of loading and discharging the cargo. Comparatively high cargo-handling costs, especially for containers, appear to put coastwise shipping at a disadvantage with respect to other modes of transportation. This is an obstacle to the policy goal of diverting truck traffic to the water mode, as legislated by Congress in 2007.27
U.S. container ports are widely considered to be much less efficient than ports in Europe and Asia, some of which are fully automated.28 A 2013 study examining the feasibility of coastal container services on the East Coast found that port handling costs were the largest cost element, greater than ship fuel and vessel capital cost, the second- and third-largest cost elements.29 However, the study found significant differences in container-handling costs among East Coast ports, as Table 2 indicates. At Charleston, SC, and Savannah, GA, some vessels may use terminals run by the state port authorities and manned by state employees rather than members of the longshore union; the per-container rate at those terminals was $165 rather than $255, according to the study.
|
Port |
Handling Cost per Container |
|
|
New York/New Jersey |
$400 |
|
|
Philadelphia |
$280 |
|
|
Baltimore |
$345 |
|
|
Norfolk |
$345 |
|
|
Charleston |
$165, $255 |
|
|
Savannah |
$165, $255 |
|
|
Miami |
$220 |
|
Source: East Coast Marine Highway Initiative M-95 Study, Parsons Brinckerhoff, October 2013, pp. 3-11.
As the table indicates, the total cost of loading a container aboard a ship at an East Coast port of origin and then discharging it from a ship at another East Coast port could be several hundred dollars.30 Adding vessel costs to port costs appears to make coastwise shipping more costly than competing modes, rather than leaving room for the rate discount a shipper will expect for using a significantly slower mode of transportation.
Some evidence of the extent to which port container-handling costs may deter waterborne shipping may be visible in U.S. trade with Canada. Despite an extremely large volume of trade with Canada, the United States imports and exports fewer containers by ship in trade with Canada than with Cambodia, the 50th-largest U.S. partner in terms of waterborne containerized trade.31 Waterborne trade with Canada need not be conducted in a U.S.-built vessel, suggesting that other factors are discouraging waterborne container movements between the two countries. Container port costs could be one factor, but it could be that truck or rail service is preferred for containerized cargo because of a variety of other factors.32
Ship Crew Costs
A MARAD study found that crew costs accounted for 70% of daily operating costs for a U.S.-crewed container ship in 2011, indicating that labor is an important cost element for U.S.-flag vessel operators.33 For a foreign-flag ship, crew costs amounted to only 28% of daily operating costs. The difference in crew costs was the main reason operating costs of U.S.-flag vessels were over twice those of foreign flag ships, MARAD found. Although the MARAD study pertained to ships in international trade, its conclusions about the important role of crew costs in total ship operating costs are relevant to coastal shipping as well.
The cost differential is significant, because their high operating costs generally make it uneconomic for domestic ships to call at foreign ports as well as domestic ones. Doing so would allow domestic carriers to better utilize their ships. Domestic ships sail on "piston" routes, going back and forth between two ports instead of sailing on triangular routes that might improve vessel utilization. For example, U.S. carriers are more heavily loaded on sailings from Florida to Puerto Rico than on the return trips from Puerto Rico to Florida. If they were to call at Caribbean island nations on those voyages, they could amass more cargo before returning to Florida, thereby improving capacity utilization. The ability to move triangularly is an important efficiency advantage of cargo ships, but ships in U.S. coastal trades cannot take advantage of it because foreign flag ships have a significant cost advantage on the U.S. foreign trade routes. The limited geography of the domestic fleet could explain why there are no Jones-Act qualified heavy-lift/project cargo ships available. This cargo does not typically generate a steady flow from the same origins and destinations, so these ships need a larger geography to find cargo. To some degree, break-bulk and dry bulk ships could be lacking in the domestic fleet for the same reason.
To help the U.S.-flag international fleet overcome the large cost difference between foreign and U.S. crews, the federal government provides operating subsidies to most U.S.-flag international vessels. For FY2017, Congress appropriated $3.5 million per ship in operating subsidy ($400,000 per ship more than in FY2016), and it has recently increased the authorized amount from $3.1 million per ship to $5 million per ship for FY2018, with additional increases thereafter.34 These subsidies for international ships may have an adverse effect on domestic shipping, to the extent that they lead to higher wages for U.S. mariners. As mentioned above, U.S.-flag international carriers rely heavily on preference cargoes that are reserved for them, so competitive market forces do not constrain wages. Domestic shipping lines hire from the same shipboard unions that supply crews to the U.S.-flag international fleet, and therefore face similar wage costs.
In the past, Congress has recognized the upward pressure on crew costs induced by operating subsidies for the U.S.-flag international fleet. In 1996, it changed the operating subsidy from a floating amount based on the differential between U.S. and foreign crewing costs to a fixed amount because of concern that the floating differential inflated U.S. crewing costs.35 Nonetheless, the comparatively high labor costs in coastal shipping caused by government subsidies for international shipping have led to a market response in the form of greater use of barges instead of ships in coastal transport.
Market Response to High Coastal Shipping Costs
U.S. shippers—that is, the owners of cargo—have responded to the comparatively high cost of domestic ships by turning to truck, rail, and pipeline transport, importing goods instead of sourcing domestically, and utilizing barges instead of ships for a growing share of coastal transport.
Import Substitution
The higher cost of U.S. domestic shipping may have led to waterborne imports and exports displacing coastal trade in some commodities. With the world economy growing faster than the U.S. economy since World War II, one might expect that U.S. international and domestic waterborne trade would both increase, but that international trade would have increased faster than domestic coastwise trade. However, since 1960 coastwise and domestic Great Lakes shipping volume has actually decreased by 104 million tons, while international waterborne volume has increased by over 1 billion tons.
As Table 3 indicates, many materials are imported in large volume through coastal ports but are also exported in substantial volume. In most cases, negligible quantities of these products are shipped coastwise or on the Great Lakes, even though large volumes move through U.S. ports. This suggests that lower transportation costs may be leading consumers located near the ports to choose imports over similar domestic products, encouraging domestic producers to sell their products abroad rather than to domestic customers, or otherwise ship domestically by overland modes.
|
Commodity |
Import |
Export |
Coastwise and |
|
Kerosene |
1,550 |
1,967 |
250 |
|
Nitrogenous fertilizer |
11,705 |
1,675 |
739 |
|
Potassic fertilizer |
1,814 |
2,761 |
17 |
|
Ammonia |
4,162 |
49 |
0 |
|
Sulphur (dry) |
545 |
1,947 |
0 |
|
Metallic salts |
1,581 |
7,148 |
117 |
|
Pulp and waste paper |
2,273 |
21,140 |
24 |
|
Newsprint |
312 |
395 |
3 |
|
Paper and paperboard |
3,244 |
5,915 |
19 |
|
Nonferrous scrap |
588 |
1,264 |
0 |
|
Nonferrous ores |
925 |
1,629 |
0 |
|
Aluminum ore |
16,067 |
2,301 |
492 |
|
Copper |
1,329 |
186 |
1 |
|
Aluminum |
2,506 |
259 |
3 |
|
Vegetable oils |
3,063 |
1,809 |
7 |
|
Animal feed |
603 |
14,292 |
92 |
|
Meat (fresh, frozen) |
1,183 |
5,025 |
157 |
Source: U.S. Army Corps of Engineers, Waterborne Commerce Statistics.
Note: For reference, 23,000 tons can be used as an approximate coastal shipload.
Import substitution appears to be occurring as well with respect to Alaska, Hawaii, and Puerto Rico. Comparing waterborne shipping volumes between 1960 and today, one finds that shipments received from the contiguous United States have increased only slightly, while shipments received from foreign sources have increased tremendously. Hawaii and Puerto Rico now receive more cargo from foreign countries than they do from the U.S. mainland.36
Barge Substitution
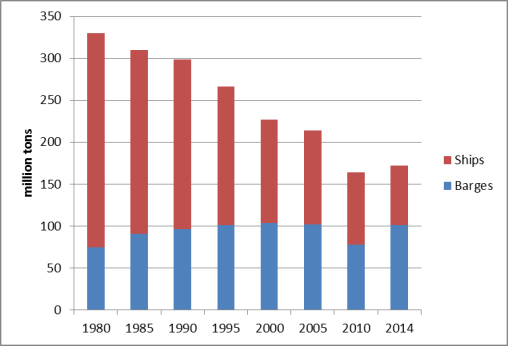
As Table 3 indicates, many of the commodities heavily imported or exported but with negligible amounts shipped coastally are dry bulk raw materials or chemicals. As mentioned above, the domestic oceangoing fleet is lacking in dry bulk ships and chemical tankers, and so many of these commodities shipped coastwise are carried in barges instead of ships. For example, 88% of the fertilizer, 76% of the chemicals, and 81% of the forest products moved by water in coastwise trade are shipped in barges.37 As Figure 4 indicates, this reflects a long-term trend of ship cargo declining and barge cargo holding relatively steady, resulting in a market share shift between the two vessel types. In 1960, only 10% of coastwise trade was shipped in barges; deep-draft ships carried 90%. Today, barges carry 60% of coastwise tonnage.
 |
|
Source: U.S. Army Corps of Engineers, Waterborne Commerce Statistics, National Summaries, Table 1-12. |
Due to the high cost of building and crewing domestic ships, the U.S. maritime industry has designed a unique type of barge that can operate offshore, the "articulated tug barge" (ATB).38 The bow of the tug that pushes the barge fits into a notch at the stern of the barge and is hinged to it so the two vessels can handle sea swells without breaking apart. This makes it more seaworthy than river barge tows, but still more limited than ships in rough sea conditions. In addition to lower construction costs, ATBs typically require a third as many crew, six to eight for seagoing barges versus 20 to 23 for ships. A larger ATB can carry anywhere from 50% to 100% as much cargo as a coastal ship, so its capital and labor costs are lower per unit of cargo.
However, barges are not as efficient as ships in moving goods over longer distances. Since they are slower than ships, beyond a certain distance their lower daily operating costs are negated by the additional time required to reach the destination. Thus, the domestic oceanborne shipping market, despite the relatively long distances to Alaska, Hawaii, and Puerto Rico, is trending toward shorter-distance voyages. Since 1960, the average length of a coastwise freight movement has decreased from 1,500 miles to 1,000 miles. In contrast, the average haul of railroads, a direct competitor, has increased from 461 miles to 1,006 miles. This contrast in average shipment distance between the two modes helps explain the loss of market share to railroads in terms of ton-miles (a measure of both volume and distance of cargo moved).39 Since 1980, railroad ton-miles have increased by 100%, while coastwise shipping ton-miles have decreased by 73%.
ATBs mostly handle liquid cargoes.40 The current fleet of ATBs has the equivalent capacity of about 50 coastal tankers. Thus, the seagoing barge fleet frustrates U.S. shipyards' ability to achieve better economies of scale in construction of coast-size ships. It also complicates efforts to achieve the federal policy goal of maintaining a large pool of mariners skilled in deep-draft ship navigation,41 as crew members aboard seagoing barges do not need to meet the same licensing requirements as crew members on coastal ships.
The shift from ships to barges has meant that a greater share of coastwise shipping is moving in smaller, slower, and less reliable (because of sea state conditions) conveyances. Meanwhile, land-based competitors have converted to more efficient conveyances. Railroads have employed larger-capacity rail cars and longer trains, and have improved their schedule reliability. Pipeline operators have installed larger-diameter pipes and have added pumping stations or horsepower to existing stations to move product faster. Thus, coastal shipping is moving less cargo per trip, while its competition is moving more cargo per trip.
Panama Canal No Longer Used for Domestic Commerce
The substitution of barges for ships and their inability to operate efficiently over long distances is a factor in the near abandonment of the Panama Canal for domestic waterborne commerce. In the 1950s and 1960s, around 6 million tons (a modest amount) of domestic cargo was shipped annually between the U.S. East and West Coasts through the Panama Canal.42 In recent years, however, domestic cargo ships have seldom transited the Canal,43 even as U.S. trade with South America utilizing the Canal has quadrupled since 1960.
To better compete with the U.S. transcontinental railroads in moving cargo from Asia to the East and Midwest, Panama recently completed a lock-widening project to accommodate ships carrying up to 7,000 40-foot containers. This will lower the cost of U.S. waterborne imports and exports, but since the United States rarely uses the canal for domestic commerce, the expanded canal will be of little benefit to most domestic shippers. The larger canal could be particularly relevant for moving domestic crude oil, as the tankers that carry Alaska oil were too large to transit the Panama Canal prior to its expansion.44
Coastal Shipping Has Shrunk to Captive Markets
Coastwise shipping has retrenched to routes where overland modes are not an option, either for reasons of geography or because of the nature of the goods being shipped.
- Today, 35% of domestic ocean-shipping tonnage is employed on services between Hawaii, Puerto Rico, and Alaska and the U.S. mainland—routes where overland modes are not available.45
- Another 25% of coastal waterborne tonnage is delivery of fuel to Florida from Louisiana and Texas and to New England from the Colonial Pipeline terminus at New York Harbor. Neither Florida nor New England is connected to the refined petroleum pipeline network that runs from Texas and Louisiana up through the eastern seaboard. The Colonial and Plantation pipelines have been running at or near capacity in recent years.46 With refineries unable to ship more refined product to the East Coast by pipeline, Jones Act tankers have added about one to three tanker loads per month (although tankers bringing gasoline from Europe fill most of the void, transporting about 30 tanker loads per month).47 Thus, Jones Act tankers are not competing with pipelines but supplementing their capacity. Pipeline operators have made at least three unsuccessful attempts since the 1980s to connect Florida to the interstate pipeline network; among other stakeholders, maritime interests involved in delivering fuel to Florida have sought to block those projects.48
- On the West Coast, Jones Act tankers deliver refined petroleum products to coastal cities lacking a refinery or pipeline connection. These shipments account for about 10% of total U.S. coastal waterborne tonnage.49
Loss of Competitive Markets
Ore and Scrap for Steelmaking
Approximately 25% of coastal shipping tonnage is ore shipped from the Mesabi iron mines in northeast Minnesota to steel mills near Chicago, Detroit, and Cleveland. This may be the only major Jones Act route that over the long term has been able to retain its market share in the face of rail competition. Part of the reason may be the nature of the commodity itself. Iron ore is exceptionally dense (heavy); if it were loaded into railroad cars, they could be filled to only 70% of capacity before reaching the maximum weight limit (286,000 lbs. per car). To sufficiently supply just one Great Lakes steel mill, several train trips would be required to carry the 70,000 tons a single ship delivers about every four days. Additionally, a Great Lakes iron ore ship does not need shoreside labor when unloading, as the process is completely automated. Nonetheless, U.S.-flag vessels' control of iron ore shipments faces an increasing challenge from new methods of steel manufacturing. Most steel today is produced not from iron ore but from scrap metal, which is transported largely by truck and rail.50 Virtually no scrap metal is shipped on the Great Lakes or along the coasts.
"Megasize Loads"
Vessels have a potential comparative advantage in shipping large pieces of equipment—that is, so-called "oversize" cargo that exceeds the weight or size dimensions allowed on highways or railroads. Shipments requiring travel through multiple states can be especially problematic for the truck mode because each state typically will require a special permit and have different rules about escort vehicles, time of day when travel is permitted, and type of trailer equipment required. State permitting practices add substantial cost and delays to interstate shipments by road. While railroads have higher weight tolerances than highways, their cargo width tolerances are not much greater because of limitations imposed by parallel tracks and trackside structures. Both of these modes face bridge and tunnel height restrictions.
Vessels largely avoid all of these encumbrances, at least for a substantial portion of a trip. They still require overland transport to and from port facilities, as few buyers and sellers of these goods are likely located directly on a waterway. However, a 2016 study found that vessels are not competitive with trucks and railroads in moving oversize cargo.51 The study found that vessels were used only in the rare cases involving "megasize" loads, loads so large that neither highways nor railroads could physically accommodate their shipment. As is the case in the U.S.-flag international fleet, as mentioned above, there are also no heavy-lift/project cargo ships in the domestic fleet.
Higher-Value Cargo
When aggregating cargo volumes in tons, it is easy to overlook those cargoes that have higher value-to-weight ratios and thus may be as economically significant as iron ore or petroleum, even though their tonnage does not equate. Ships are also capable of competing with overland modes for higher value cargo, as seen on the Great Lakes and in the carriage of automobiles. The Great Lakes region remains the nation's center of industrial production, although its dominance is not what it once was and its consumer market (population) has also declined. The availability of low-cost waterborne shipping on the Great Lakes once gave the region a comparative advantage.52 The Great Lakes region is still prominent in auto manufacturing, grain milling, paper manufacturing, machinery manufacturing, and the processing of dairy products. However, as Table 4 indicates, these industries are either no longer shipping their product over the Lakes or are doing far less of it. Only the volume of cement and gypsum (construction materials) has held steady.
|
Product Category |
1960 |
2014 |
|
Autos, trucks, other vehicles, and parts |
716,804 |
85,000 |
|
Wheat, grain milling (flour) |
2,200,802 |
16,000 |
|
Paper |
691,263 |
0 |
|
Electrical machinery and machine tools |
84,978 |
0 |
|
Dairy products |
99,160 |
0 |
|
Cement and gypsum |
3,281,150 |
3,257,000 |
Source: U.S. Army Corps of Engineers, Waterborne Commerce Statistics.
The U.S.-built fleet of car carriers is entirely employed in transporting automobiles to Alaska, Hawaii, and Puerto Rico. None of the ships is used on the Great Lakes or along the coasts, where they would face competition from railroads and trucks. However, foreign-built car carriers are employed in shipping new automobiles from Mexico to the southeastern ports, while auto plants in the Southeast export automobiles to Asia through the Panama Canal rather than moving them by rail to a West Coast port, indicating that coastal ships might be able to capture a portion of domestic automobile movements if costs and terms of service were attractive.
A National Maritime Strategy
In 2014, Congress requested that MARAD submit a national maritime strategy for increasing the use and size of the U.S. fleet.53 In response, MARAD held a series of symposiums to invite ideas from industry. Most of the suggestions by U.S.-flag carriers and shipyards were to either expand legal restrictions favoring the use of U.S.-flag vessels, step up enforcement of existing restrictions, or increase appropriations to MARAD programs. Only one shipper, General Electric Corp. (GE), participated in the symposium. The company's representative commented, "Today U.S. flag is seen as a group of carriers that we have to use. I think going forward, to be successful, you have to be seen as a group of carriers we want to use."54
The federal government has attempted to promote the U.S. merchant marine by imposing legal restrictions that direct cargo toward U.S.-built ships and offering financial assistance to encourage use of U.S.-built ships. However, federal policies have not addressed the issue that is arguably most important to cargo shippers, the cost of shipping. The capital cost of a new ship limits their availability, with some commonly used ship types missing from the domestic fleet. This encourages domestic shippers to find other means of transport, further reducing the ability of domestic shipyards to achieve economies in production. This reinforcing loop serves neither the domestic ship owner nor shipbuilder.
On the contrary, federal policies have tended to raise the cost of transporting cargo domestically by ship. This has led cost-sensitive customers to avoid using ships in domestic commerce in favor of land-based modes. It also has encouraged the growth of a water-based alternative, oceangoing barges, that does not achieve the congressionally established objectives of sustaining a U.S. merchant fleet, providing employment for U.S. mariners, and strengthening the capabilities of U.S. shipbuilders. To address the cost issue, policymakers may seek more information on the following:
- While operating under the same Jones Act requirements as domestic ships, river barges have been relatively successful in increasing their market share (Figure 2, "Inland waterway"). Are there lessons from their success that are applicable to coastal shipping?
- Is the manning disparity between ATBs and coastal tankers justified? Could crewing requirements for coastal ships be reduced without sacrificing safety?
- What factors contribute to the high cost of U.S.-built ships compared to ships from foreign yards?
- Could the automated methods of handling iron ore at Great Lakes ports be applied at coastal ports for handling other types of cargo?
This is not a new line of inquiry. Congress has asked repeatedly for information on many of these questions since 1916, when it first created a federal agency to promote merchant shipping,55 and especially since 1936, when it created many of the present-day financial assistance programs.56 Federal maritime policy has tended to focus on the size of the fleet and the number of mariners while overlooking the usefulness of ships in moving commerce. Focusing more on the causes of the high cost of domestic coastal shipping could lead to policies that might reverse the shrinking cargo base, which could lead to greater demand for U.S. ships and mariners.