Introduction
The four major federal land management agencies—the Bureau of Land Management (BLM), Fish and Wildlife Service (FWS), and National Park Service (NPS), all within the Department of the Interior (DOI), and the Forest Service (FS) within the Department of Agriculture—have maintenance responsibility for more than 300,000 diverse assets in dispersed locations. These agencies maintain assets to preserve their functioning and to repair and replace components as needed.1
The infrastructure needs of the federal land management agencies have been a subject of significant federal and public attention for many years. Congressional and administrative attention has focused on deferred maintenance and repairs, defined as "maintenance and repairs that were not performed when they should have been or were scheduled to be and which are put off or delayed for a future period."2 Deferred maintenance and repairs often are called the maintenance backlog. The agencies assert that continuing to defer the maintenance and repair of facilities accelerates the rate of these facilities' deterioration, increases their repair costs, and decreases their value. Debate has focused on varied issues, including the level of funds needed to reduce deferred maintenance, whether agencies are using existing funding efficiently, the priority of deferred maintenance relative to regular maintenance, and whether additional sources of funds should be directed to maintenance. Other issues include how to balance the maintenance of existing infrastructure with the acquisition of new assets, whether disposal of assets is desirable given limited funding, and how much to prioritize maintaining infrastructure relative to other government functions.
Another issue relates to the dollar amount of deferred maintenance and the reasons for fluctuations over time. This report focuses on these issues. It first provides agency deferred maintenance estimates for FY2016, the most recent fiscal year for which this information is available. It also discusses changes in deferred maintenance over the past decade (FY2007-FY2016) and then identifies some of the factors that likely contributed to these changes.
Estimates
The agencies typically identify deferred maintenance through periodic condition assessments of facilities.3 FS currently reports an annual deferred maintenance dollar total composed of estimates for 13 classes of assets. These classes include roads, buildings, trails, fences, and water systems, among others.4 DOI currently reports annual deferred maintenance composed of estimates for four broad categories of assets: (1) roads, bridges, and trails; (2) irrigation, dams, and other water structures; (3) buildings; and (4) other structures. The "other structures" category includes a variety of assets (e.g., recreation sites and hatcheries).
For each of the 10 years covered by this report, FS has reported the amount of deferred maintenance as a single figure. DOI agencies began reporting deferred maintenance as a single figure in FY2015.5 In prior years, DOI agencies reported estimates as a range. For FY2014, for instance, the range had an "accuracy level of minus 15 percent to plus 25 percent of initial estimate."6 According to DOI, a range had been used because "[d]ue to the scope, nature, and variety of the assets entrusted to DOI, as well as the nature of deferred maintenance itself, exact estimates are very difficult to determine."7
FS estimates of deferred maintenance included in this report generally are taken from the agency's annual budget justifications to Congress.8 The DOI Budget Office provided the Congressional Research Service (CRS) with a deferred maintenance range for each DOI agency for each fiscal year from FY2007 to FY2014. From these ranges, CRS calculated mid-range figures. For instance, DOI estimated NPS deferred maintenance for FY2014 at between $9.31 billion and $13.70 billion. The CRS-calculated mid-range figure is $11.50 billion.9 This report reflects CRS's mid-range calculations for FY2007-FY2014 to facilitate comparison with FS estimates.10 Since FY2015, the DOI Budget Office has provided CRS with a single estimate for each DOI agency, and those figures are used in this report. They represent deferred maintenance as of the end of the fiscal year (i.e., September 30).11
FY2016
The four agencies had a combined FY2016 deferred maintenance estimated at $18.62 billion.12 The agencies had widely varying shares of the total. NPS had the largest portion, 59%, based on an estimate of $10.93 billion.13 The FS share was 29% of the total, with an estimated deferred maintenance of $5.49 billion. The FWS portion was 8%, reflecting the agency's deferred maintenance of $1.40 billion. BLM had the smallest share, 4%, based on a backlog estimate of $0.81 billion.
Each agency's deferred maintenance estimate for FY2016 consisted of various components. For FS, the single largest asset class was roads, which comprised 59% of the FY2016 total of $5.49 billion. The next largest asset class was buildings, which represented 22% of the FS FY2016 total. The next largest asset classes were trails (5%), fences (5%), and bridges (4%). Eight other asset classes made up the remaining 6%.
For NPS, the largest asset category was roads, bridges, and trails, which comprised 58% of the FY2016 deferred maintenance total of $10.93 billion. The buildings category comprised 19% of the total, followed by 17% for other structures and 6% for irrigation, dams, and other water structures.
Roads, bridges, and trails also reflected the largest share of BLM's FY2016 deferred maintenance, with 76% of the $0.81 billion total. Two other categories of assets had relatively comparable portions, specifically 10% for buildings and 9% for other structures. The remaining 5% was for irrigation, dams, and other water structures.
Roads, bridges, and trails did not make up the largest portion of FWS's FY2016 deferred maintenance ($1.40 billion), as it did for the other agencies. Rather, the four asset categories had roughly comparable portions, as follows: 28% for other structures; 27% for buildings; 24% for roads, bridges, and trails; and 21% for irrigation, dams, and other water structures.
Overview of Decade (FY2007-FY2016)
Changes in Estimates in Current and Constant Dollars
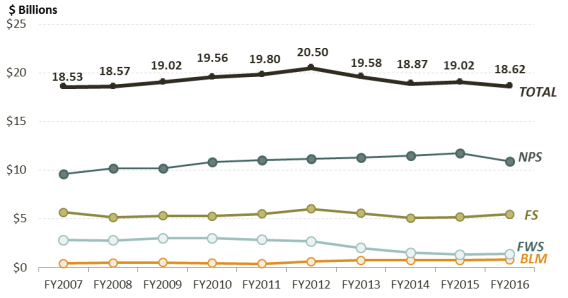
As shown in Table 1,14 in current dollars the total deferred maintenance estimate for the four agencies rose and then fell over the course of the decade, ending the decade relatively flat. It increased by $0.09 billion overall, from $18.53 billion to $18.62 billion, or 0.5%. Both the BLM and NPS estimates increased, by $0.39 billion (92%) and $1.31 billion (14%), respectively. By contrast, both the FWS and FS estimates decreased, by $1.44 billion (51%) and $0.17 billion (3%), respectively.
Within these overall changes, there was considerable variation among agency trends. The NPS estimate increased fairly steadily over the decade, before falling in FY2016. The FS estimate was nearly the same at the beginning and end of the decade, although it fluctuated between $5.10 billion and $6.03 billion throughout the 10-year period. The BLM estimate also fluctuated, rising then falling in the first half of the decade then increasing to a new high at the end of the decade. The FWS estimate peaked in FY2010, then declined by more than half over the next six years. Figure 1 depicts the annual changes in current dollars for each agency and for the four agencies combined. Factors that might have contributed to the changes are discussed in the "Issues in Analyzing Deferred Maintenance" section, below.
By contrast, as shown in Table 2, in constant dollars, the total deferred maintenance estimate for the four agencies decreased over the course of the decade by $3.09 billion, from $21.71 billion to $18.62 billion, or 14%. Three agencies had overall decreases: $0.33 billion (3%) for NPS, $1.14 billion (17%) for FS, and $1.92 billion (58%) for FWS. However, the BLM estimate increased by $0.32 billion (65%) over the 10-year period.
As was the case for current dollar estimates, the overall changes in constant dollars reflected various fluctuations. The BLM estimate fell and rose during the period, with the lowest estimate in the middle of the period (FY2011) and the highest at the end (FY2016). The FWS estimate exceeded $3 billion for each of the first five years before dropping steeply over the next five years to less than half that level. The NPS estimate increased fairly consistently during the first five years, then declined fairly steadily over the next five years. The FS estimate showed considerable annual variation, consisting of several increases and several decreases within the overall reduction. Figure 2 depicts the annual changes in constant dollars for each agency and for the four agencies combined.
Table 1. Estimated Deferred Maintenance by Agency in Current Dollars,
FY2007-FY2016
(in billions of current dollars)
|
Agency |
FY2007 |
FY2008 |
FY2009 |
FY2010 |
FY2011 |
FY2012 |
FY2013 |
FY2014 |
FY2015 |
FY2016 |
|
BLM |
0.42 |
0.47 |
0.53 |
0.44 |
0.40 |
0.61 |
0.74 |
0.74 |
0.75 |
0.81 |
|
FWS |
2.83 |
2.79 |
3.01 |
3.02 |
2.85 |
2.70 |
2.01 |
1.53 |
1.33 |
1.40 |
|
NPS |
9.61 |
10.17 |
10.17 |
10.83 |
11.04 |
11.16 |
11.27 |
11.50 |
11.73 |
10.93 |
|
FS |
5.66 |
5.15 |
5.31 |
5.27 |
5.51 |
6.03 |
5.56 |
5.10 |
5.20 |
5.49 |
|
Total |
18.53 |
18.57 |
19.02 |
19.56 |
19.80 |
20.50 |
19.58 |
18.87 |
19.02 |
18.62 |
Sources: Estimates for FS were taken from its annual budget justification to Congress, except that the FY2016 estimate was provided by the FS. Estimates for Department of the Interior (DOI) agencies for FY2007-FY2014 were calculated by CRS based on deferred maintenance ranges provided by the DOI Budget Office; estimates for FY2015 and FY2016 were provided by the DOI Budget Office.
Notes: BLM = Bureau of Land Management; FWS = Fish and Wildlife Service; NPS = National Park Service; FS = Forest Service.
Table 2. Estimated Deferred Maintenance by Agency in Constant Dollars,
FY2007-FY2016
(in billions of 2016 constant dollars)
|
Agency |
FY2007 |
FY2008 |
FY2009 |
FY2010 |
FY2011 |
FY2012 |
FY2013 |
FY2014 |
FY2015 |
FY2016 |
|
BLM |
0.49 |
0.53 |
0.60 |
0.50 |
0.44 |
0.65 |
0.77 |
0.75 |
0.75 |
0.81 |
|
FWS |
3.32 |
3.13 |
3.43 |
3.41 |
3.12 |
2.87 |
2.09 |
1.55 |
1.34 |
1.40 |
|
NPS |
11.26 |
11.40 |
11.58 |
12.22 |
12.09 |
11.87 |
11.74 |
11.68 |
11.78 |
10.93 |
|
FS |
6.63 |
5.77 |
6.04 |
5.95 |
6.04 |
6.41 |
5.79 |
5.18 |
5.22 |
5.49 |
|
Total |
21.71 |
20.81 |
21.65 |
22.07 |
21.69 |
21.81 |
20.39 |
19.17 |
19.11 |
18.62 |
Sources: Figures were calculated by CRS using U.S. Department of Commerce, Bureau of Economic Analysis, Table 3.9.4, "Price Indexes for Government Consumption Expenditures and Gross Investment," for nondefense structures, third quarter indexes, at http://www.bea.gov/iTable/iTable.cfm?ReqID=9&step=1#reqid=9&step=1&isuri=1.
Notes: BLM = Bureau of Land Management; FWS = Fish and Wildlife Service; NPS = National Park Service; FS = Forest Service.
|
Figure 2. Change in Deferred Maintenance by Agency in Constant Dollars, |
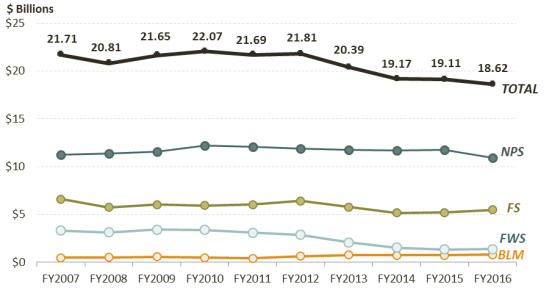 |
|
Sources: Amounts in 2016 constant dollars were calculated by CRS using the U.S. Department of Commerce, Bureau of Economic Analysis, Table 3.9.4, "Price Indexes for Government Consumption Expenditures and Gross Investment" for nondefense structures, third quarter indexes, at http://www.bea.gov/iTable/iTable.cfm?ReqID=9&step=1#reqid=9&step=1&isuri=1. Notes: BLM = Bureau of Land Management; FWS = Fish and Wildlife Service; NPS = National Park Service; FS = Forest Service. |
Agency Shares of Deferred Maintenance in Current and Constant Dollars
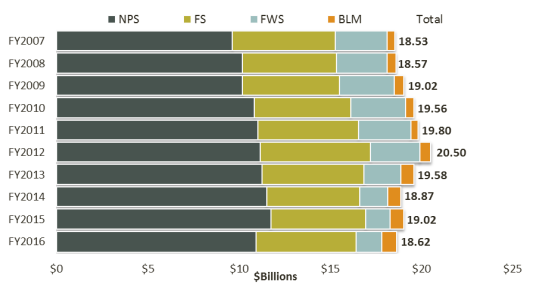
Throughout the decade, agency shares of the deferred maintenance totals differed, as shown in Figure 3 and Figure 4. In both current and constant dollars, in each fiscal year NPS had the largest portion of total deferred maintenance and considerably more than any other agency. FS consistently had the second-largest share, followed by FWS and then BLM. Moreover, the NPS portion of the annual total grew overall throughout the period, from 52% in FY2007 to 59% in FY2016. By contrast, the FS share of the total decreased over the 10-year period from 31% to 29%. The FWS component also declined, from 15% to 8%, whereas the BLM portion rose from 2% to 4%.15
The asset class or category that included roads typically comprised the largest portion of each agency's deferred maintenance. Roads represented the largest portion of FS deferred maintenance from FY2007 to FY2016. Over the 10-year period, the NPS roads, bridges, and trails category had the highest share of the agency's deferred maintenance, and irrigation, dams, and other water structures had the smallest. In most years, the portion of NPS deferred maintenance for the "other structures" category exceeded the buildings portion, but in some years the reverse was the case. Roads, bridges, and trails also was the biggest category of BLM's deferred maintenance from FY2007 to FY2016. Although this category typically represented a majority of the FWS total deferred maintenance in the earlier part of the period, this has not been the case since FY2013. A decline in the dollar estimate for roads, bridges, and trails resulted in a sizeable drop in overall FWS deferred maintenance beginning in FY2013, as discussed below.
|
Figure 4. Deferred Maintenance Total by Agency in Constant Dollars, |
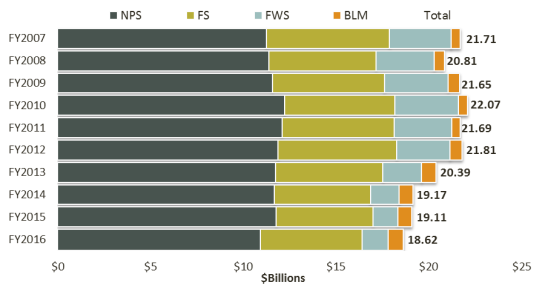 |
|
Sources: Amounts in 2016 constant dollars were calculated by CRS using the U.S. Department of Commerce, Bureau of Economic Analysis, Table 3.9.4, "Price Indexes for Government Consumption Expenditures and Gross Investment" for nondefense structures, third quarter indexes, at http://www.bea.gov/iTable/iTable.cfm?ReqID=9&step=1#reqid=9&step=1&isuri=1. Notes: BLM = Bureau of Land Management; FWS = Fish and Wildlife Service; NPS = National Park Service; FS = Forest Service. |
Issues in Analyzing Deferred Maintenance
Fluctuations in deferred maintenance estimates are likely the result of many factors, among them estimation methods, levels of funding, asset portfolios, and economic conditions, as discussed below. The extent to which these and other factors affected year-to-year changes in any one agency's maintenance backlog is unclear, in part because comprehensive information is not readily available in all cases or has not been examined. Therefore, the data in this report may not fully explain the changes in deferred maintenance estimates over time.
Methodology
Methods for assessing the condition of assets and estimating deferred maintenance have changed over the past decade. As a result, it is unclear what portion of the change in deferred maintenance estimates is due to the addition of maintenance work that was not done on time and what portion may be due to changes in methods of assessing and estimating deferred maintenance. With regard to facility assessment, agencies have enhanced efforts to define and quantify the maintenance needs of their assets. Efforts have included collecting comprehensive information on the condition of facilities and maintenance and improvement needs. For instance, the first cycle of comprehensive condition assessments of NPS industry-standard facilities16 was completed at the end of FY2006. NPS continues to develop business practices to estimate the maintenance needs of non-industry-standard assets.17 This category presents particular challenges because it includes unique asset types.18
Alterations in methodology have contributed to changes in deferred maintenance estimates as shown in the following examples for roads. The FY2015 FWS budget justification states that
[i]n 2012, Service leadership concluded that condition assessment practices and policies in place at that time were unintentionally producing higher than appropriate [deferred maintenance (DM)] cost estimates for some types of constructed real property. DM estimates for our extensive inventory of gravel and native surface roads are a major contributor to this challenge. In response, the FWS is refining its practices and procedures to improve consistency of DM cost estimates and their use in budget planning. Significant reductions in the DM backlog are resulting from this effort.19
Subsequent FWS budget justifications have elaborated on changes to methods of estimating deferred maintenance for roads. For instance, the FY2017 document states that "[d]eferred maintenance estimates for our extensive inventory of roads were further classified to emphasize public use and traffic volume. As a result, minimally used administrative roads are now generally excluded from contributing to deferred maintenance backlog calculations."20 Of note is that the roads, bridges, and trails category of FWS deferred maintenance declined substantially in the past five years in current dollars, from $1.46 billion in FY2012 to $0.33 billion in FY2016. This decline is reflected in the smaller FWS deferred maintenance total for FY2016 ($1.40 billion). The FWS change in the method of estimating deferred maintenance for roads, bridges, and trails appears to be a primary reason for the decreased estimate for this category and total FWS deferred maintenance.
Similarly, FS attributes variations in deferred maintenance during the decade partly to changes in the methodology for estimating roads. Since FY2008, the roads estimate has been limited to certain types of roads—passenger-car roads (Levels 3-5)—whereas prior year estimates included closed roads and high-clearance roads (Levels 1-2).21 Also, in FY2013 and FY2014, FS adjusted the survey methodology for passenger-car roads, with the goal of providing more accurate estimates of the roads backlog.22 Overall, the FS estimate of deferred maintenance for roads fell considerably during the decade in current dollars, from $4.16 billion in FY2007 to $3.21 billion in FY2016.23 The extent to which the drop is attributable to changes in methodology, including regarding the types of roads reflected in the estimates, is not certain.24
Broader changes in methodology also occurred during the decade. For example, NPS previously used an accuracy range of -30% to +50% to derive the estimated range of deferred maintenance for industry-standard assets.25 The change to an accuracy range of -15% to +25% of the initial estimate would have affected NPS deferred maintenance estimates and CRS's calculations of mid-range figures as reflected in this report (through FY2014).
Funding
How much total funding is provided each year for deferred maintenance for the four agencies is unclear because annual presidential budget requests, appropriations laws, and supporting documents typically do not aggregate funds for deferred maintenance. Portions of deferred maintenance funding have come from agency maintenance and construction accounts, recreation fees, concession fees, and the Highway Trust Fund (Department of Transportation) for roads, among other accounts. Moreover, funding figures are not directly comparable to deferred maintenance estimates because the estimates are limited to project costs and thus do not reflect indirect costs, such as salaries and benefits for government employees. Annual appropriations figures typically reflect indirect costs. Evaluations of the sufficiency of federal funding for deferred maintenance may be hindered by the lack of total funding figures and by the incomparability of appropriations and deferred maintenance estimates.
Moreover, consistent and comprehensive information on the effect of federal funding on the condition of facilities and deferred maintenance over the decade does not appear to be available in budget documents. In particular, information based on the facilities condition index (FCI)26 seems to be incomplete or inconsistent in agency budget justifications. In some cases, budget justifications either do not provide FCI figures for assets or provide figures only for certain years. The FY2011 BLM budget justification, for example, notes in several places that the FCI was a new measurement beginning in 2009.27 In other cases, it is not clear if the FCI figures cover all agency assets or a subset of the assets. Together, the budget justifications present a mix of FCI information using quantitative measurements; percentage measurements; and qualitative statements, such as that a certain number or percentage of structures are in "good" condition, but without corresponding FCI figures.
Although amounts and impacts of deferred maintenance funding may not be readily available, the agencies at times have asserted a need for increased appropriations to reduce their backlogs. As a recent example, the FY2016 NPS budget justification sets out a proposal for increased funds to address deferred maintenance.28 In the past, agencies sometimes attributed reductions in deferred maintenance (or slower rates of increase) in part to additional appropriations, such as those provided in the American Recovery and Reinvestment Act of 2009 (ARRA; P.L. 111-5).29 The FY2016 FWS budget justification notes the ARRA funding as one factor contributing to a reduction in the backlog from the FY2010 high, for instance.30
Assets
The asset portfolios of the four agencies vary considerably in terms of number, type, size, age, and location of agency assets. Although comprehensive data on these variables over the past decade are not readily available, it is likely that they affect agency maintenance responsibilities and maintenance backlogs. For instance, NPS has more assets than the other DOI agencies, a sizeable portion of which were constructed before 1900 or in the first half of the 20th century. Moreover, some of these assets are in urban areas or are iconic structures, which could affect maintenance costs.31
The effect of changes in agency asset portfolios on deferred maintenance is not entirely clear. However, it could be asserted that the acquisition of assets, such as a sizeable number of large or iconic assets in relatively poor condition, would increase regular maintenance needs and the backlog, if maintenance is not performed when scheduled. Similarly, it could be argued that disposal of assets, such as a large quantity of old assets in poor condition, could reduce deferred maintenance.
Agencies have examined whether to retain assets in their current condition or dispose of some assets, as the following examples indicate. FS has sought to reduce its maintenance backlog by conveying unneeded or underused administrative sites, as well as decommissioning roads, road and facility infrastructure, and nonpriority recreation sites.32 FWS attributed recent reductions in deferred maintenance in part to "disposing of unneeded assets."33 NPS identified assets that are not critical to the agency's mission and that are in relatively poor condition for potential disposal. NPS later noted that although the agency seeks to improve the condition of its asset portfolio by disposing of assets, "analysis of removal costs versus annual costs often precludes the removal option."34
Economic Conditions
Deferred maintenance estimates might vary due to economic conditions that are not related to agency efforts or within the control of facility managers. For example, if deferred maintenance estimates reflect costs of needed materials, supplies, and labor, then the cost of deferred maintenance might change as the costs of these products and services change. Further, NPS noted that deferred maintenance estimates could fluctuate with market trends and inflation.35 In a wider economic context, FS noted that the increase (in current dollars) in the deferred maintenance estimate for roads from FY2006 to FY2007 was partly the result of rises in fuel prices and other associated construction costs.36